Published: October 9th, 2024
In the current quarter, Wells Fargo is expected to post $20.38 billion in revenues, a 2.3% fall from the prior year, and profits per share (EPS) of $1.27, an 8.6% year-over-year decline.
The stock price chart shows that, in spite of these declines, Q3 projections have been comparatively stable since the start of the quarter, with long-term revisions trending upward. This is in contrast to the forward 12-month consensus EPS estimates.
The discounted valuation of the finance sector stands out as one of the most alluring options available, especially with the S&P 500 close to record highs.
This is particularly true for investors hoping for a mild economic landing, which would help this fragile industry by increasing lending demand and lowering credit losses.
Let's see the further aspect of this stock from the WFC technical analysis:

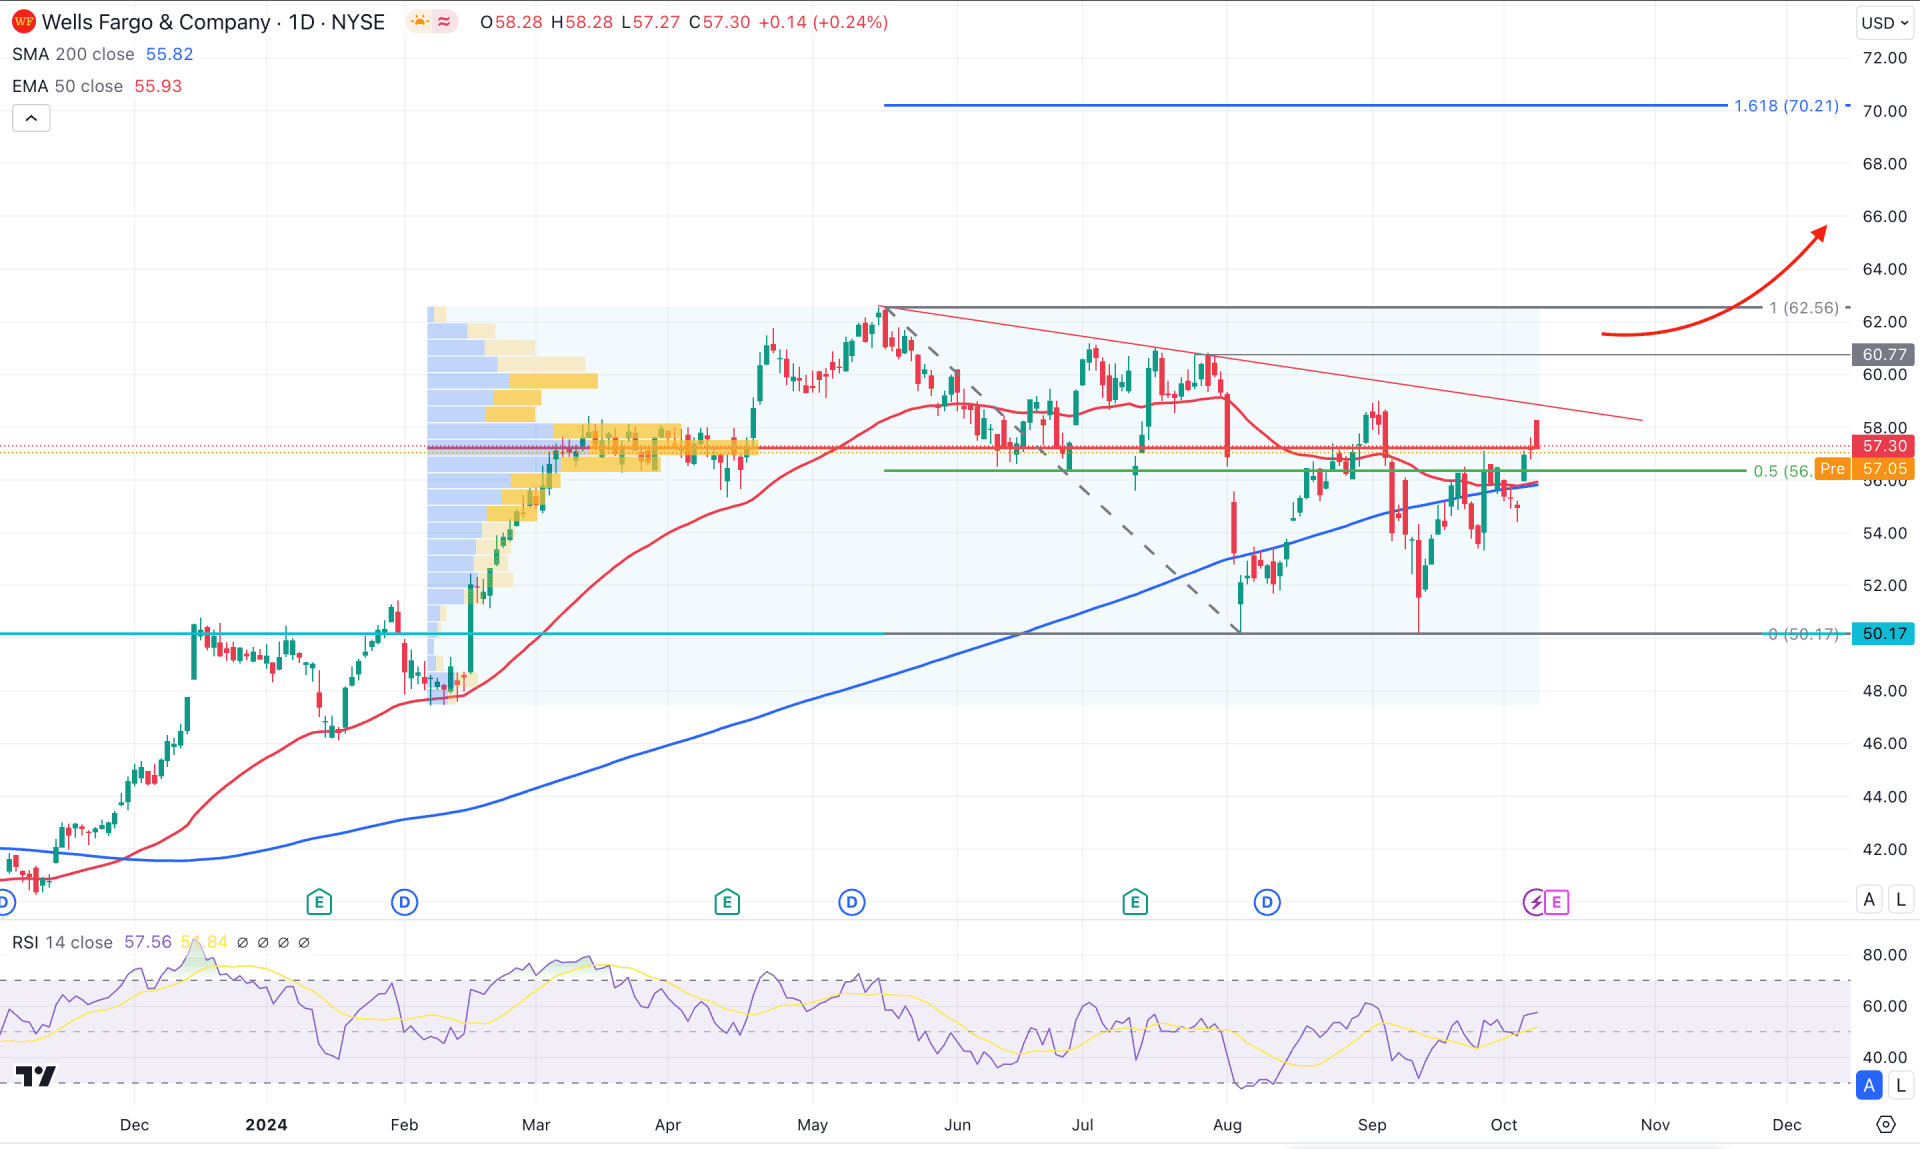
The broader market context is bullish in the daily chart of WFC, as decent buying pressure has been seen in recent years. In 2024, the stock showed a decent return, while the current price is trading with a 16% return.
In the higher timeframe, an extreme corrective movement is visible as in the last 5 months candlesticks' showed long wicked formation, signaling a sell-side liquidity grab. Moreover, the weekly price showed the same structure, where the recent price aimed higher from the double bottom breakout from the 50.17 support level.
In the volume structure, the buying pressure is still questionable as the most significant level since the beginning of 2024 is just below the current price. As the higher timeframe suggests an extreme correction within a bullish trend, a valid bullish break from the high volume line might resume the trend in the coming days.
In the daily chart, the recent price shows a bearish correction, with a downside slope from the 50-day Exponential Moving Average line. However, the 200-day SMA is still protected and working as an immediate support level.
In the secondary indicator window, the 14-day Relative Strength Index (RSI) hovers above the 50.00 line, suggesting that bulls are still holding their position.
Based on the daily outlook of WFC, a valid bullish trend line breakout with a daily candle above the 60.77 level could open a bullish opportunity aiming for the 70.21 Fibonacci Extension level. Moreover, a stable market above the 62.56 high could extend the bullish possibility above the 80.00 area.
On the bearish side, investors should monitor how the price reacts at the trend line resistance. A failure to move above the 62.56 level could be an alarming sign to bulls. A valid downside pressure with a daily close below the 56.00 line might extend the downside pressure below the 50.17 support level.

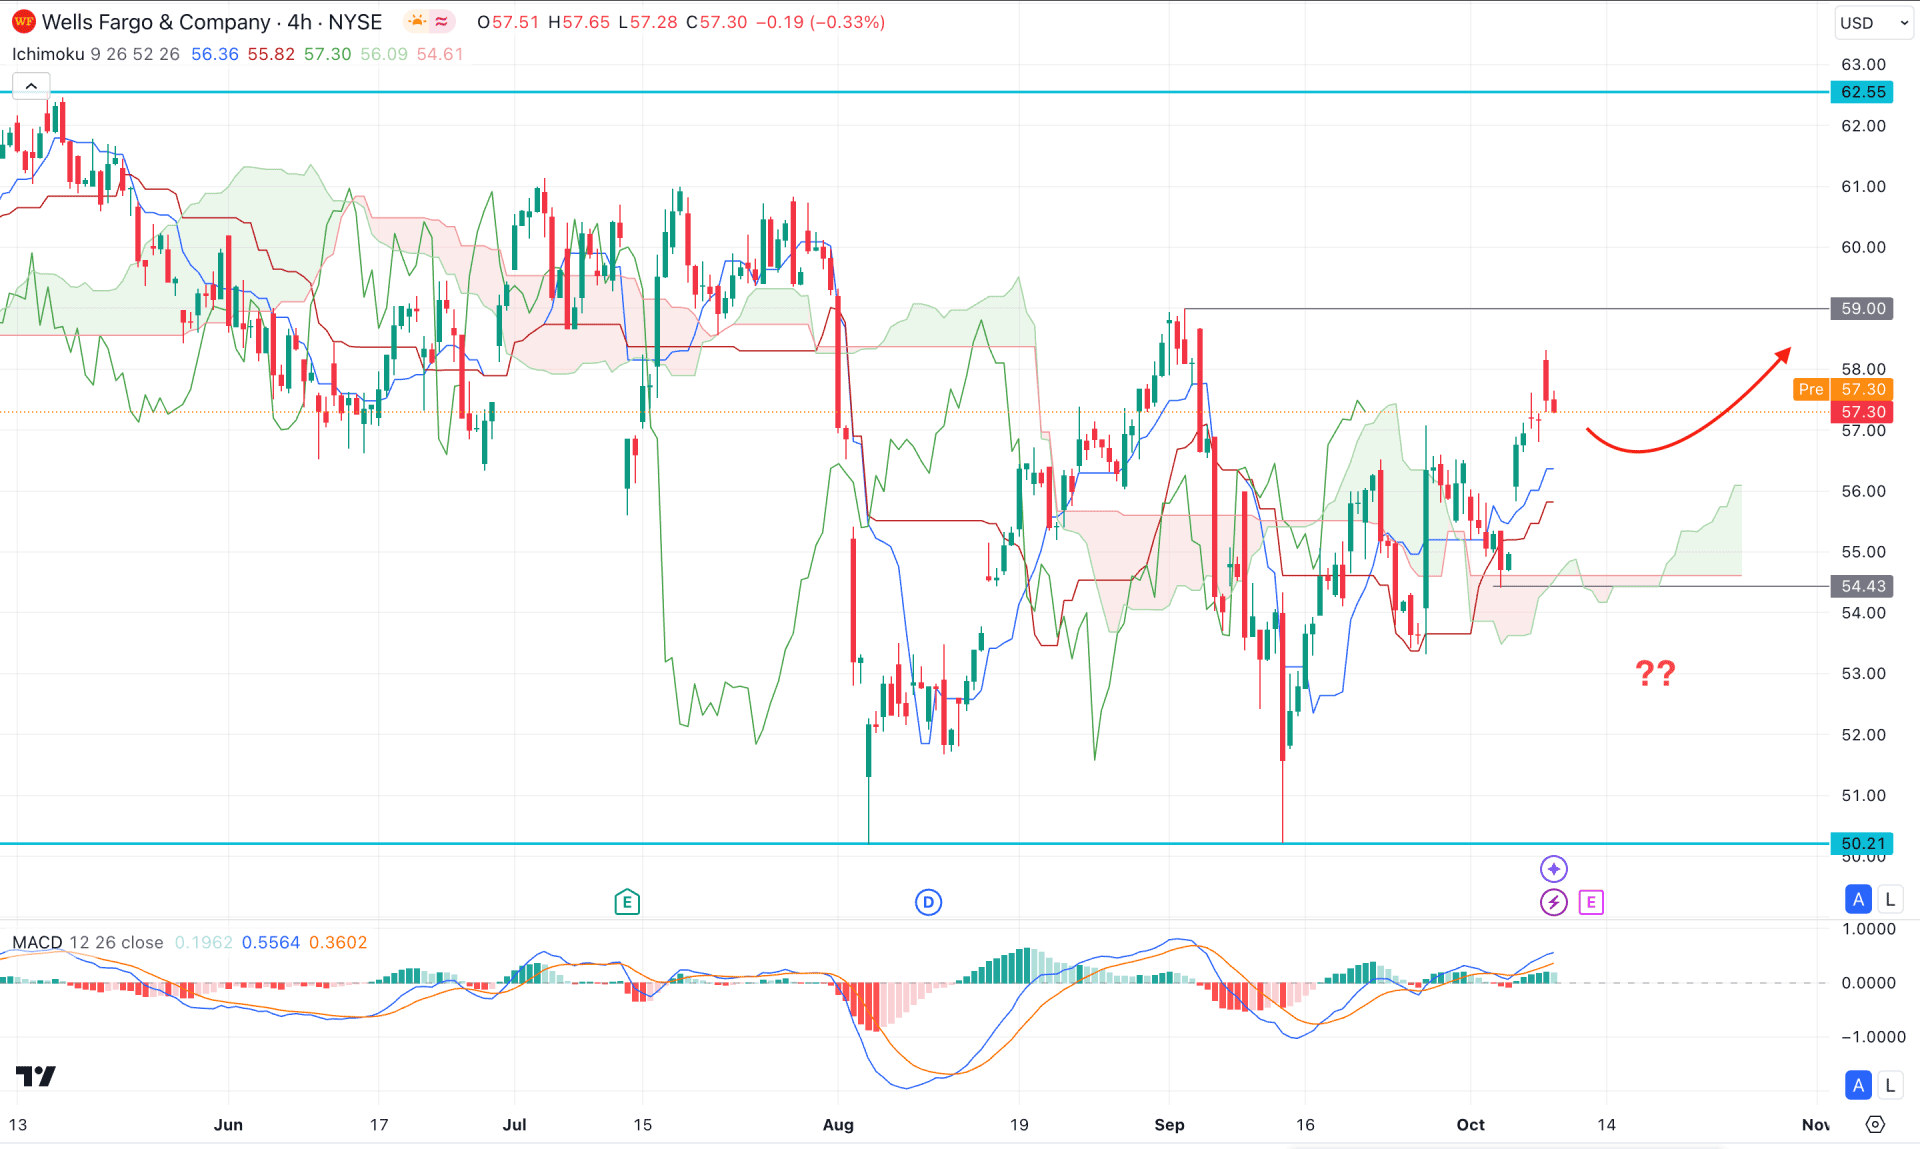
In the H4 timeframe, a valid bullish recovery is seen from the 50.00 area, taking the price above the Ichimoku cloud zone. Moreover, the Senkou Span A aimed higher, above the Senkou Span B line, which might work as an additional bullish signal.
In the indicator window, the MACD Histogram maintained the buying pressure as the recent line hovers above the neutral line. However, the overextended price above the Kijun Sen support and with a flat Signal line in the MACD indicator might work as pressure on bulls.
Primarily, a downside correction is pending as the recent price approached the 59.00 resistance level with a corrective momentum. However, a bullish recovery is possible from the 56.00 to 54.00 area, which might signal a pre-breakout momentum, aiming for the 62.00 level.
On the bearish side, a valid downside recovery below the 54.43 level could eliminate the bullish possibility and lower the price toward the 50.0 area.

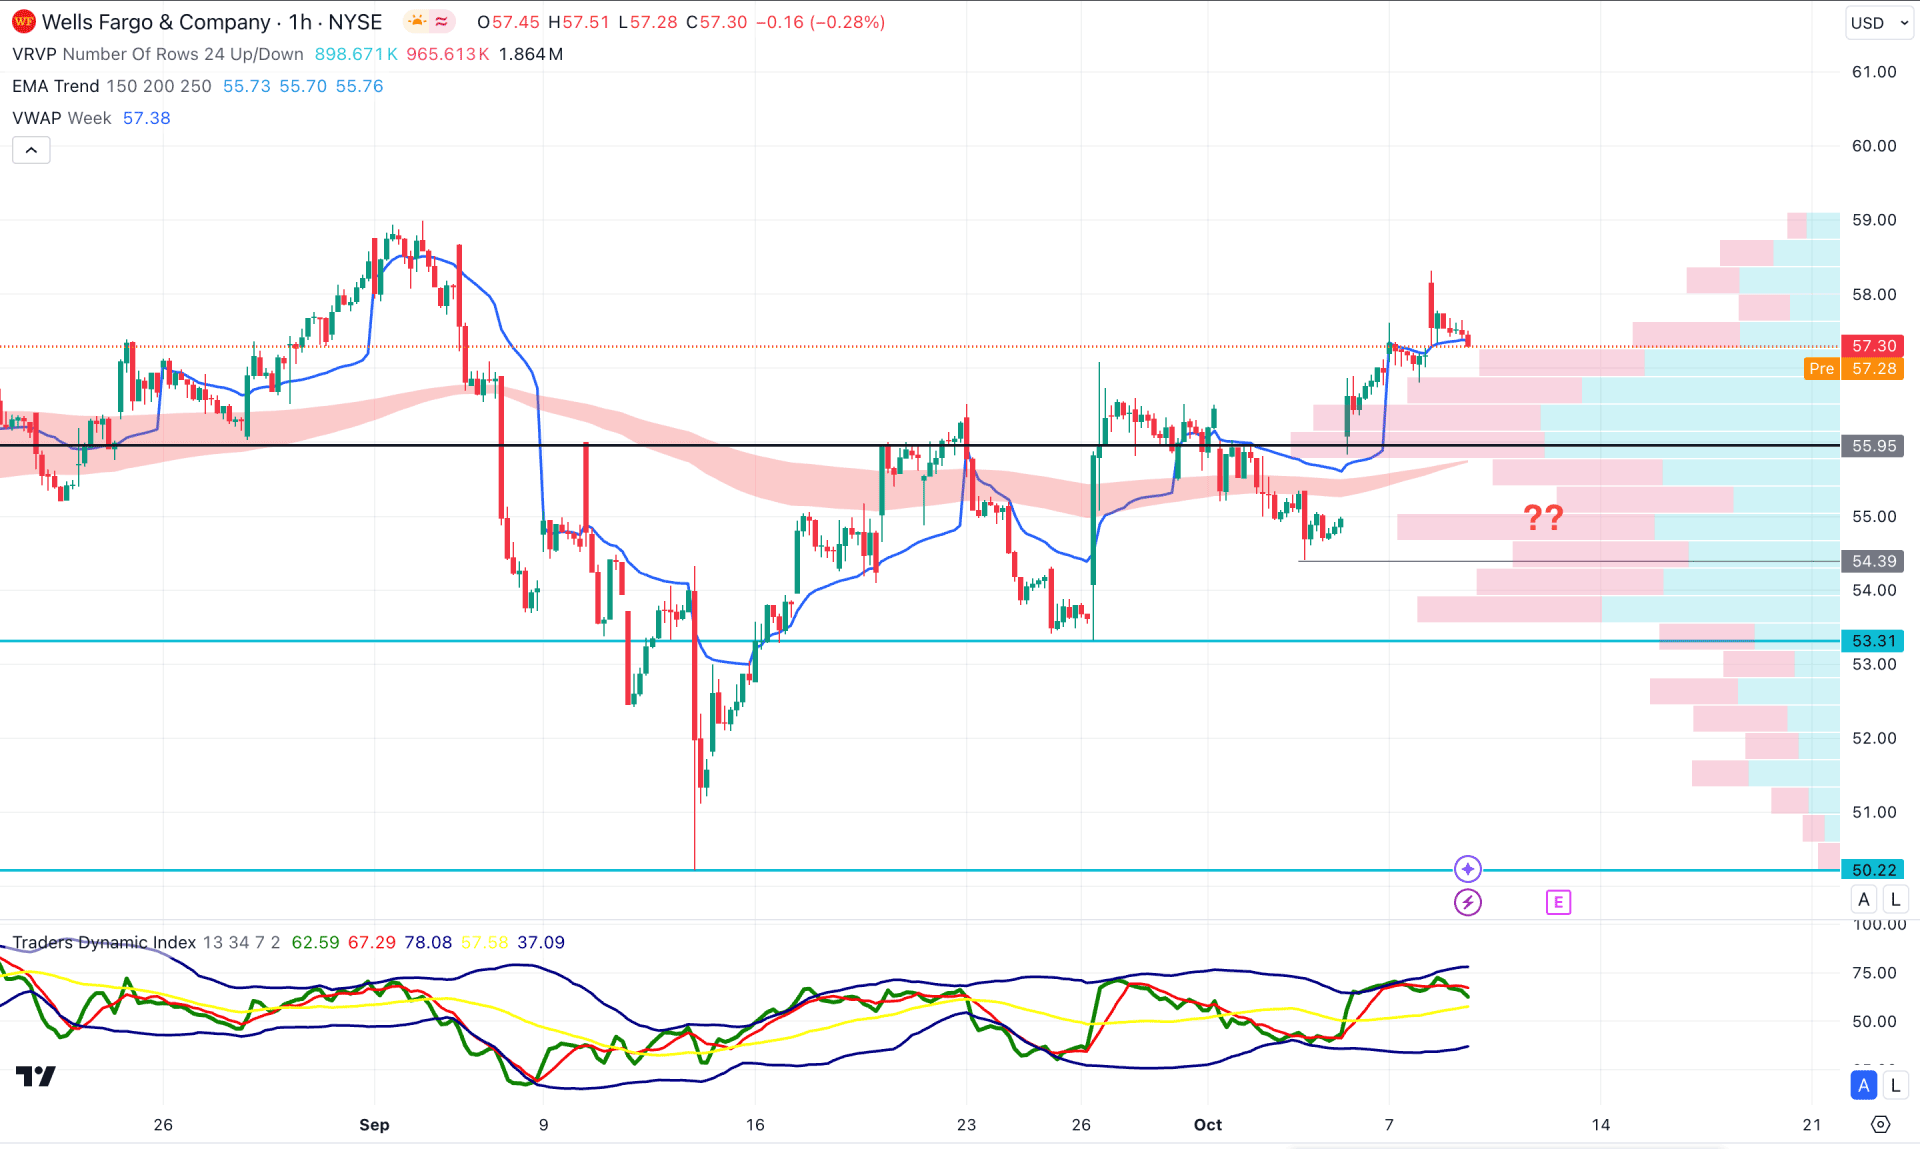
In the hourly chart of WFC, a bullish continuation is visible as the current price hovers above the critical dynamic visible range high volume line. Moreover, the dynamic EMA wave is having a bullish slope, signaling a secondary bullish signal.
On the other hand, the Traders Dynamic Index (TDI) shows a different story, where the current line aimed lower from the top.
In this context, a valid bullish reversal is needed from the bottom before validating the bullish continuation. However, a break below the 55.00 level with a bearish hourly candle might lower the price towards the 50.00 area.
Based on the current market momentum, WFC is trading with bullish pre-breakout momentum. The most recent price is below a crucial trend line resistance. In that case, a valid bullish break above the near-term resistance might validate the long opportunity in the coming days.