
Published: April 9th, 2025
The Federal Reserve maintained interest rates between 4.25 and 4.5% throughout the first quarter. Therefore, given the comparatively high interest rates, Wells Fargo's NII is unlikely to have grown significantly.
A volatile macroeconomic environment probably produced a favorable lending environment, given Trump's tariff ambitions. According to the Fed's most recent data, the demand for consumer, real estate, and business and industrial loans was low during the initial two months of the quarter. As a result, it is probable that the company's lending activity improved marginally during the reporting quarter.
In the initial quarter of 2025, mortgage rates remained close to 6.5%, indicating that renewal operations and issuance volumes did not significantly increase despite the Federal Reserve's 2024 interest rate reduction.
Transactional actions probably improved the company's investment advising and generated additional asset-based fee revenues. These revenues are expected to reach $2.6 billion, a 1.4% sequential increase.
The opening quarter 2025 had fewer worldwide mergers and acquisitions (M&As) than anticipated. The Asia Pacific area led a small increase in deal volume and value during the quarter. With the Trump administration's favorable regulations and the likelihood of tax cuts and deregulation, the year began with great optimism and hopes for strong investment banking (IB) performance.
But none of these came to pass, and the recovery vanished as market volatility soared due to uncertainties about the tariffs and the resulting trade war. Economic instability has resulted from these changes, as evidenced by data showing a downturn in the US economy and increasing inflationary pressure. WFC's IB fee increase is therefore anticipated to have been impacted.
Let's see the further aspect of this stock from the WFC technical analysis:
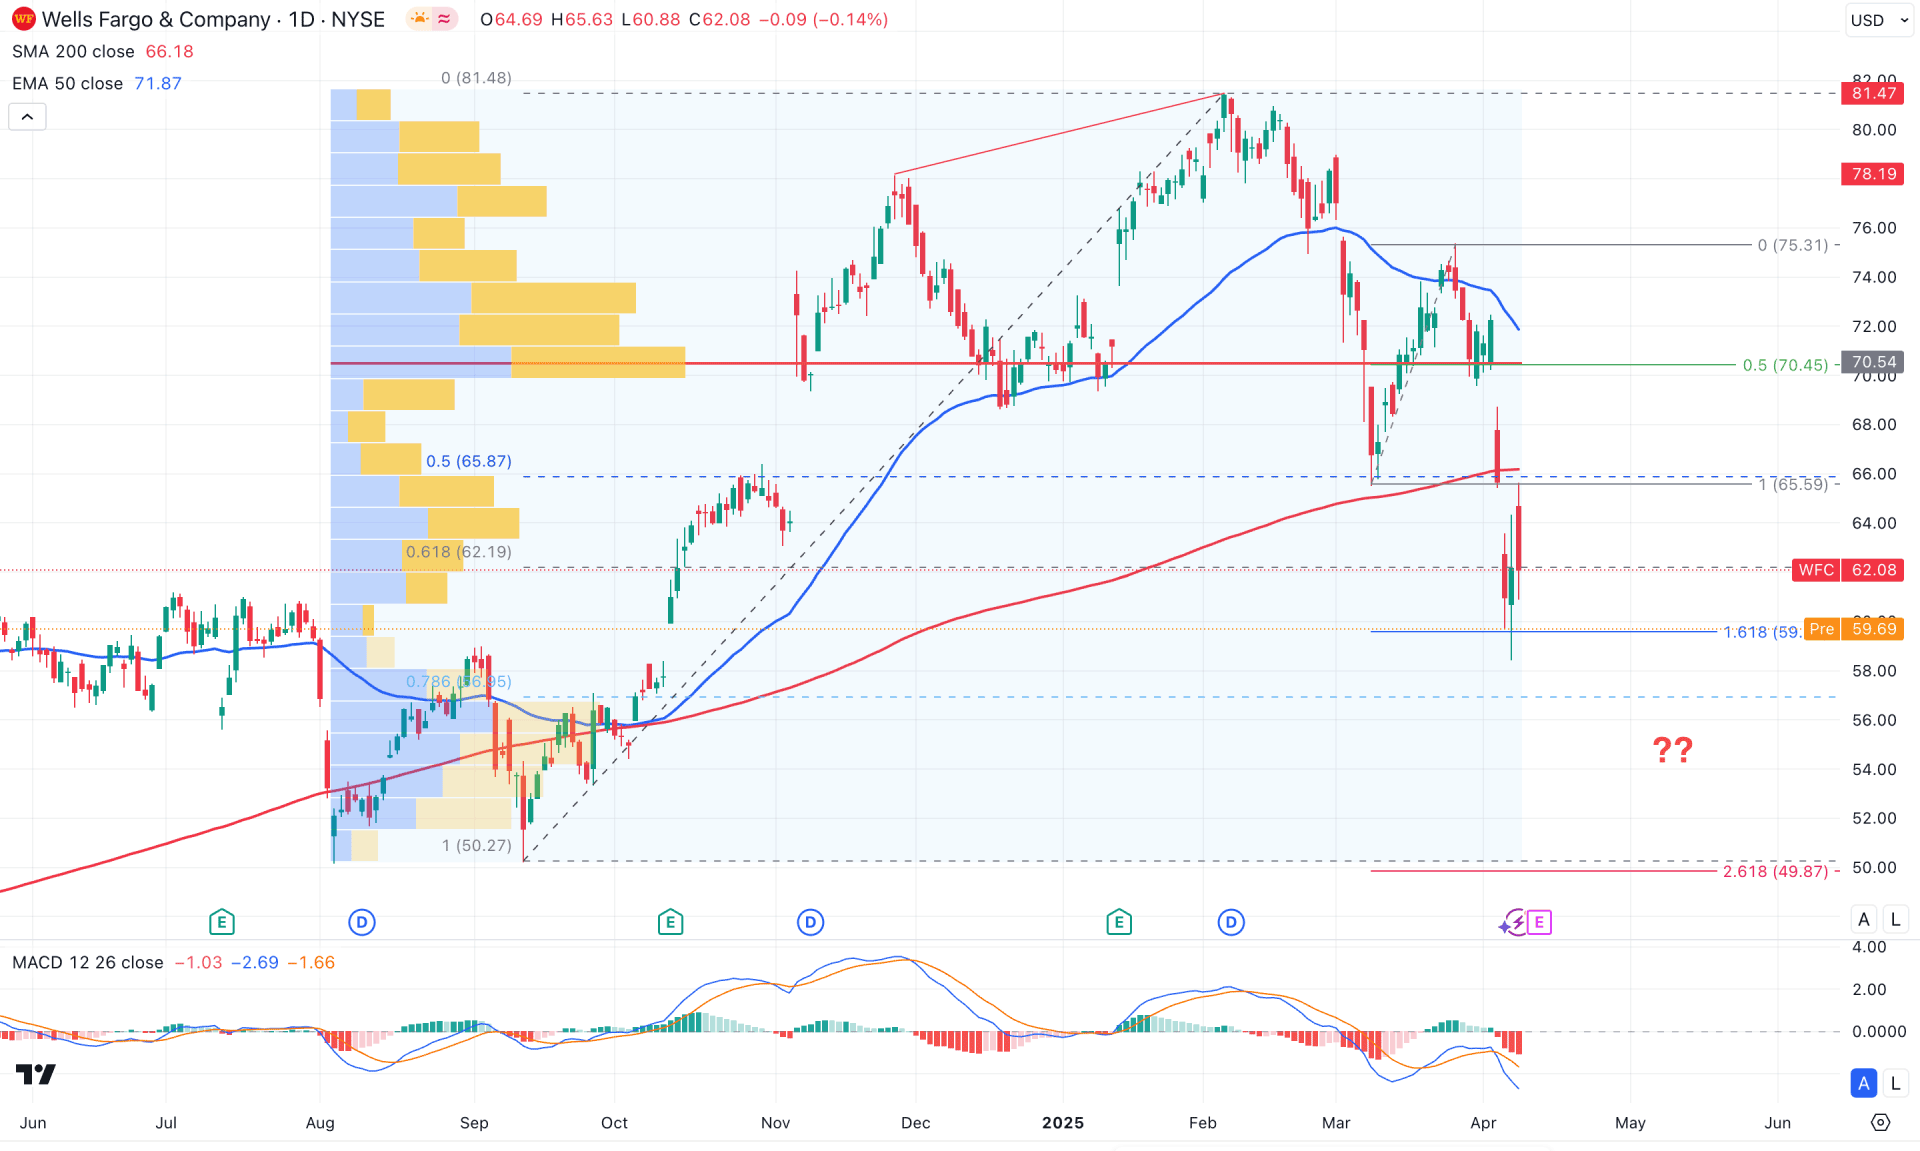
On the daily chart of Wells Fargo Stock (WFC), the recent price action shows extended selling pressure following a divergence at the all-time high. After forming two consecutive lower lows, the price is now trading below crucial dynamic lines. In this case, investors should monitor how the price responds to the ongoing selling pressure, as a valid rebound is needed before anticipating the long-term trend continuation.
The volume structure indicates institutional selling pressure, as the price failed to hold above the 70.54 high-volume line. The price rebounded briefly after forming a bearish break from that level before forming more selling pressure. As the price is currently recovering with a white gap from the high-volume line, a moderate bullish correction is still pending, even though the selling pressure remains active.
In the long-term market trend, the current price is trading below a three-month low, reaching the crucial bullish order block. A similar pattern is visible in the weekly timeframe, where the current price is forming an inside bar within a strong bullish weekly candle. A downside continuation could appear as long as the price remains within the bearish body of the existing weekly candle.
In the main price structure, both the 200-day SMA and the 50-day EMA are positioned above the current price, signaling a trend continuation.
In the indicator window, the MACD histogram has maintained selling pressure for four consecutive bars, confirming the bearish momentum.
Based on this outlook, the primary aim for this stock is to monitor for selling pressure and potentially join the bearish rally in a shorter time frame. However, the bull run from the September 2024 low has expanded the optimal trading range. Moreover, the ABCD correction has been completed at the 59.59 Fibonacci extension level. In this context, a potential bullish reversal is possible within the 56.95 to 65.59 area. A valid daily candle close above this zone could resume the existing uptrend toward the 82.00 level.
On the other hand, failure to break above the 70.54 high-volume line would pose a challenge for the bulls. In that case, any bearish rejection from the 50-day EMA could extend the current downtrend and potentially create a new swing low below the 58.41 level.
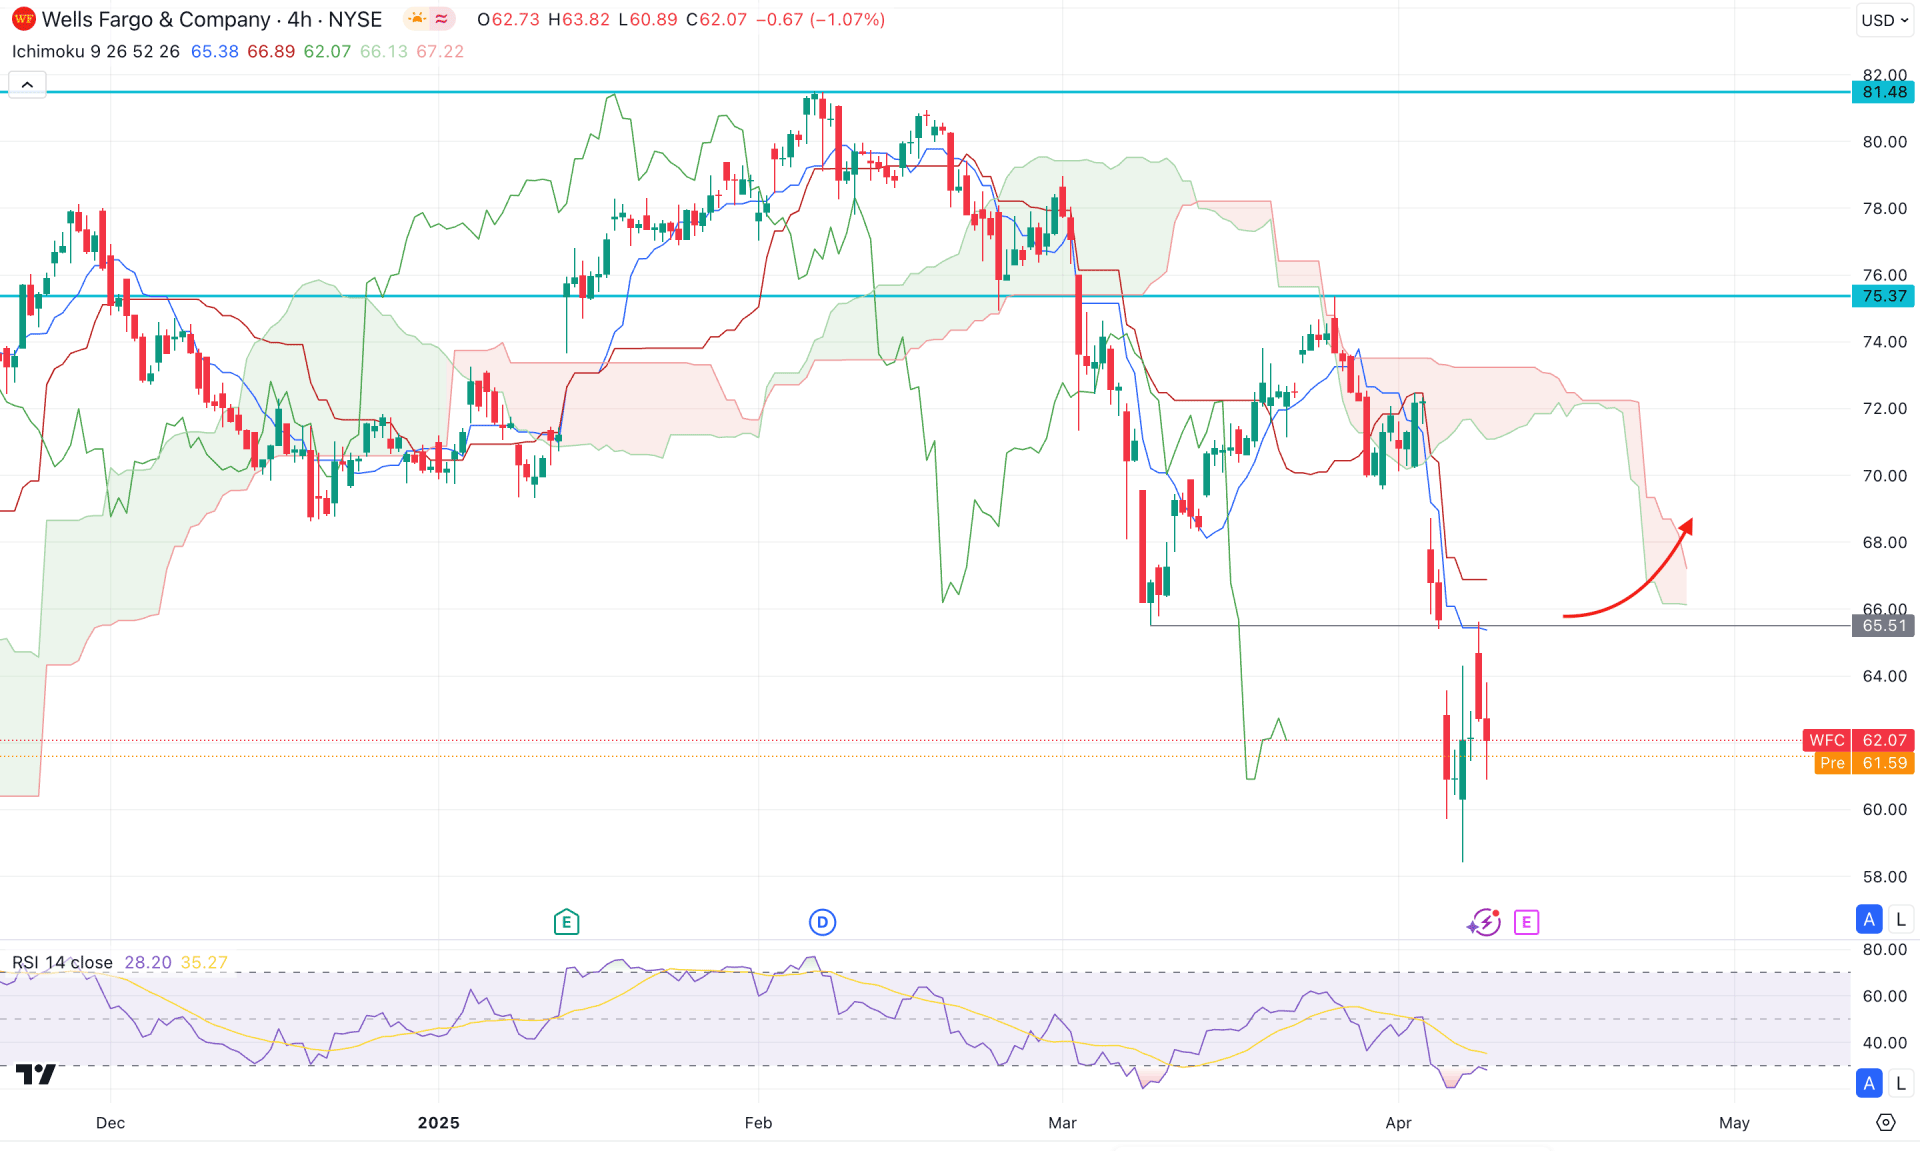
In the four-hour timeframe, a bearish pressure is clearly visible, while the current price is overextended below the Kumo Cloud area. As a result, the future cloud has flipped, with the Senkou Span A now positioned below the Senkou Span B.
In the near term, both dynamic lines act as resistance, and the price will face rejection after a retest at the high gap.
The indicator window shows a similar structure, with the current Relative Strength Index (RSI) positioned in the oversold area.
Following the broader market structure, a bullish rebound is pending as a correction to the bearish trend. However, a trend reversal requires a recovery above the cloud area, supported by a bullish counter-impulsive momentum.
On the bullish side, the immediate resistance is at the 75.17 level, with a potential upside target at 81.48. However, failure to break above the 68.00–74.60 resistance zone could increase selling pressure and potentially lead to a new swing low below the 58.00 area.
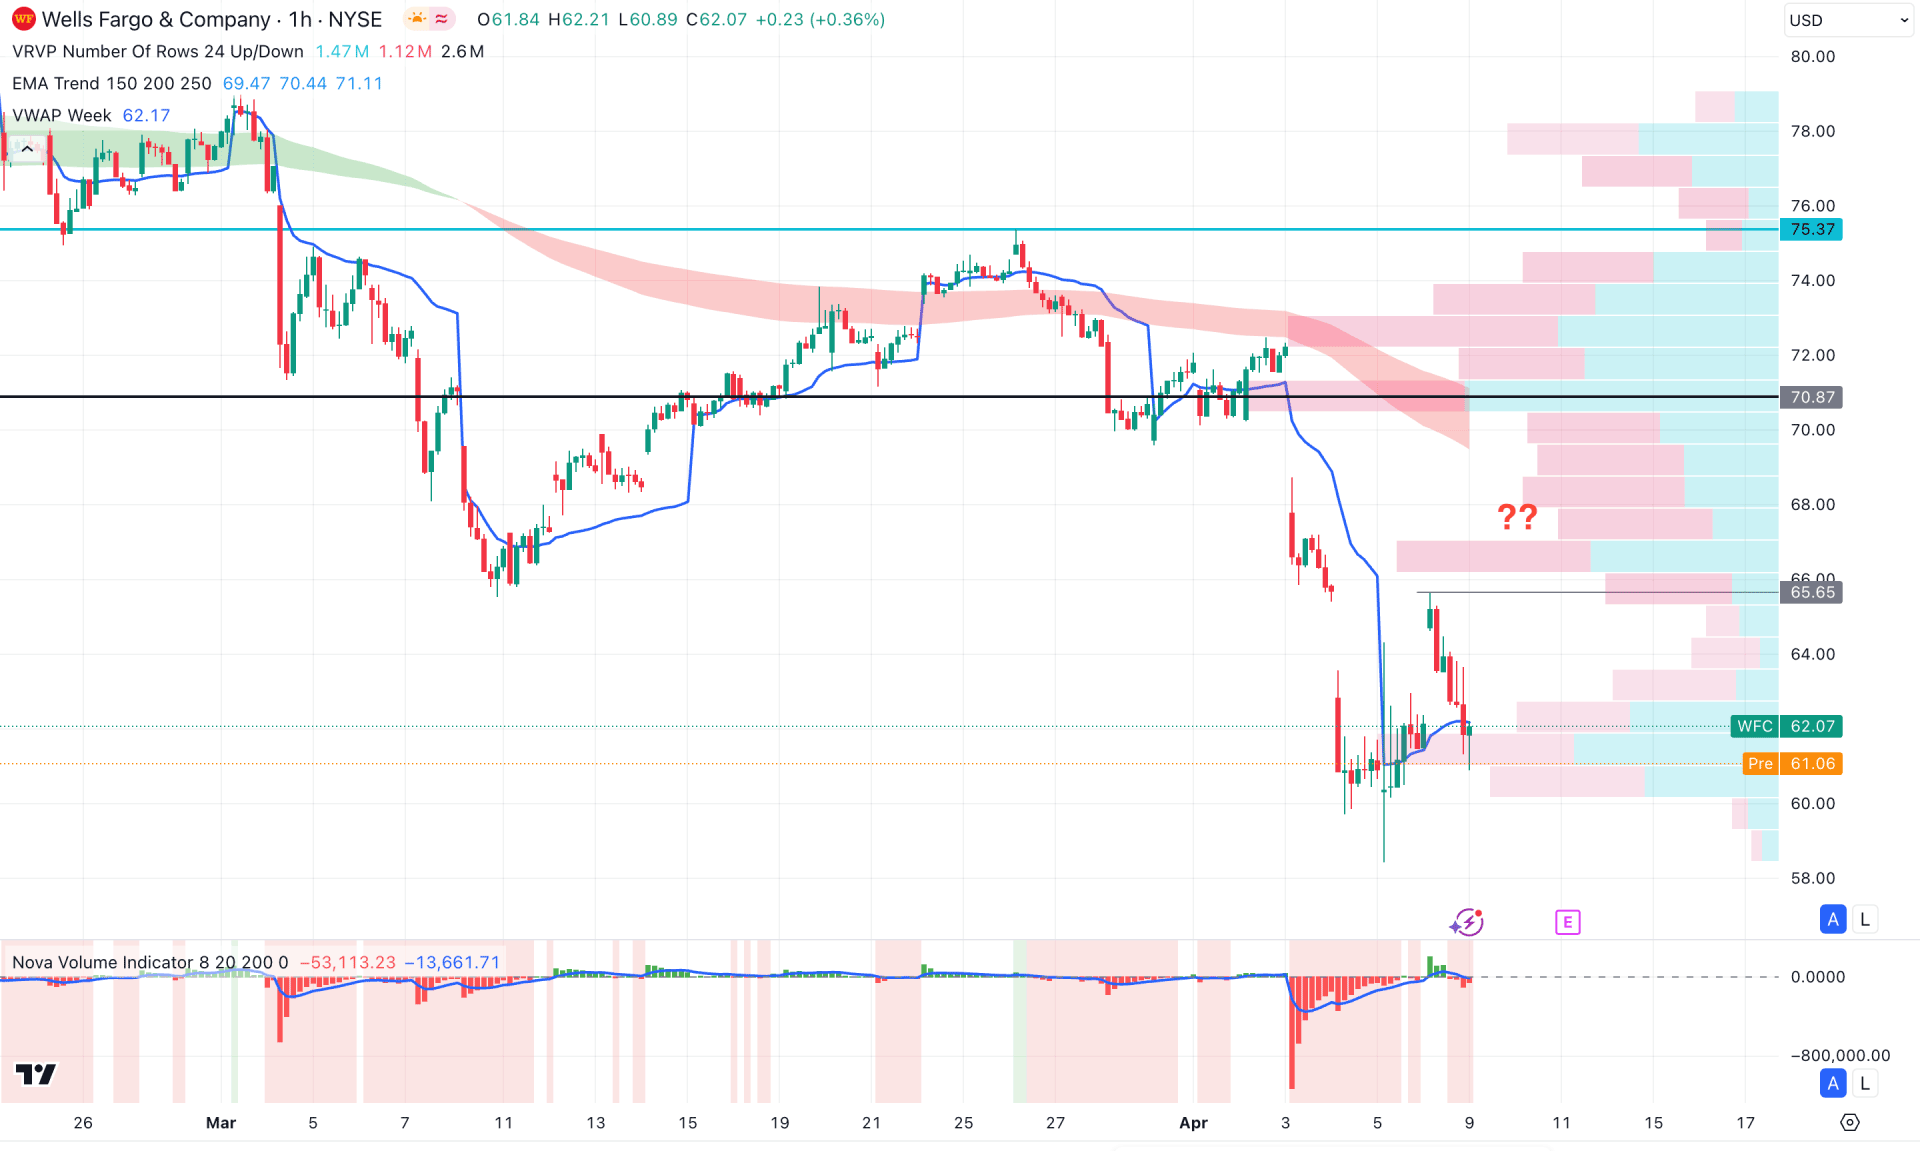
On the hourly chart, the ongoing bearish trend is clearly visible. The visible range high-volume node is positioned above the current price, aligning with the exponential moving average wave. As long as these dynamic levels remain above the current price, the bearish momentum may continue to extend.
On the other hand, the weekly VWAP level is closer to the current price, signaling a potential re-distribution phase. In this case, a breakout in the volume histogram along with an hourly candle closing below the 60.00 level could resume the existing downtrend and lead to a new low below the 58.00 area.
Alternatively, a deeper bullish correction is possible toward the 60.00–70.00 zone. However, a successful breakout above the 72.00 area, supported by a counter-trend bullish recovery, could invalidate the current bearish outlook.
Based on the current market structure, the long-term price is trading at a crucial bottom, from where a rebound is possible before a bullish continuation. In that case, investors should closely monitor the price action, as an invalidation of the intraday bearish continuation could be an early long opportunity.


