
Published: July 5th, 2023
After its $43 billion merger in April 2022, Warner Bros. Discovery (WBD) has encountered numerous obstacles to its success that have posed significant obstacles. Among these obstacles are executive reshuffles, underperforming films at the box office, and pervasive layoffs.
The value and benefits of the merger have been questioned due to the stock price decline of approximately 50 percent since its initial public offering.
Warner Bros. Discovery, Inc. is a globally renowned media and entertainment corporation with three primary business segments: Studios, Networks, and Direct-to-Consumer (DTC). The Studios segment concentrates on producing and distributing feature-length motion pictures for theatrical release, as well as licensing television programs to third parties.
The Networks segment predominantly comprises the company's domestic and international television networks. The DTC segment, meanwhile, concentrates on premium pay TV and streaming services.
Warner Bros. Discovery remains committed to achieving $4 billion in cost-saving synergies over the next two years despite the obstacles it faces. Positively, the company encountered a turnaround in streaming losses during the first quarter, and subscriber growth exceeded expectations.
In light of these positive developments, the company has revised its previous projections and now expects its direct-to-consumer business in the United States to become profitable within the current year.
Let’s see the upcoming price direction of WBD from the Warner Bros Stock (WBD) technical analysis:
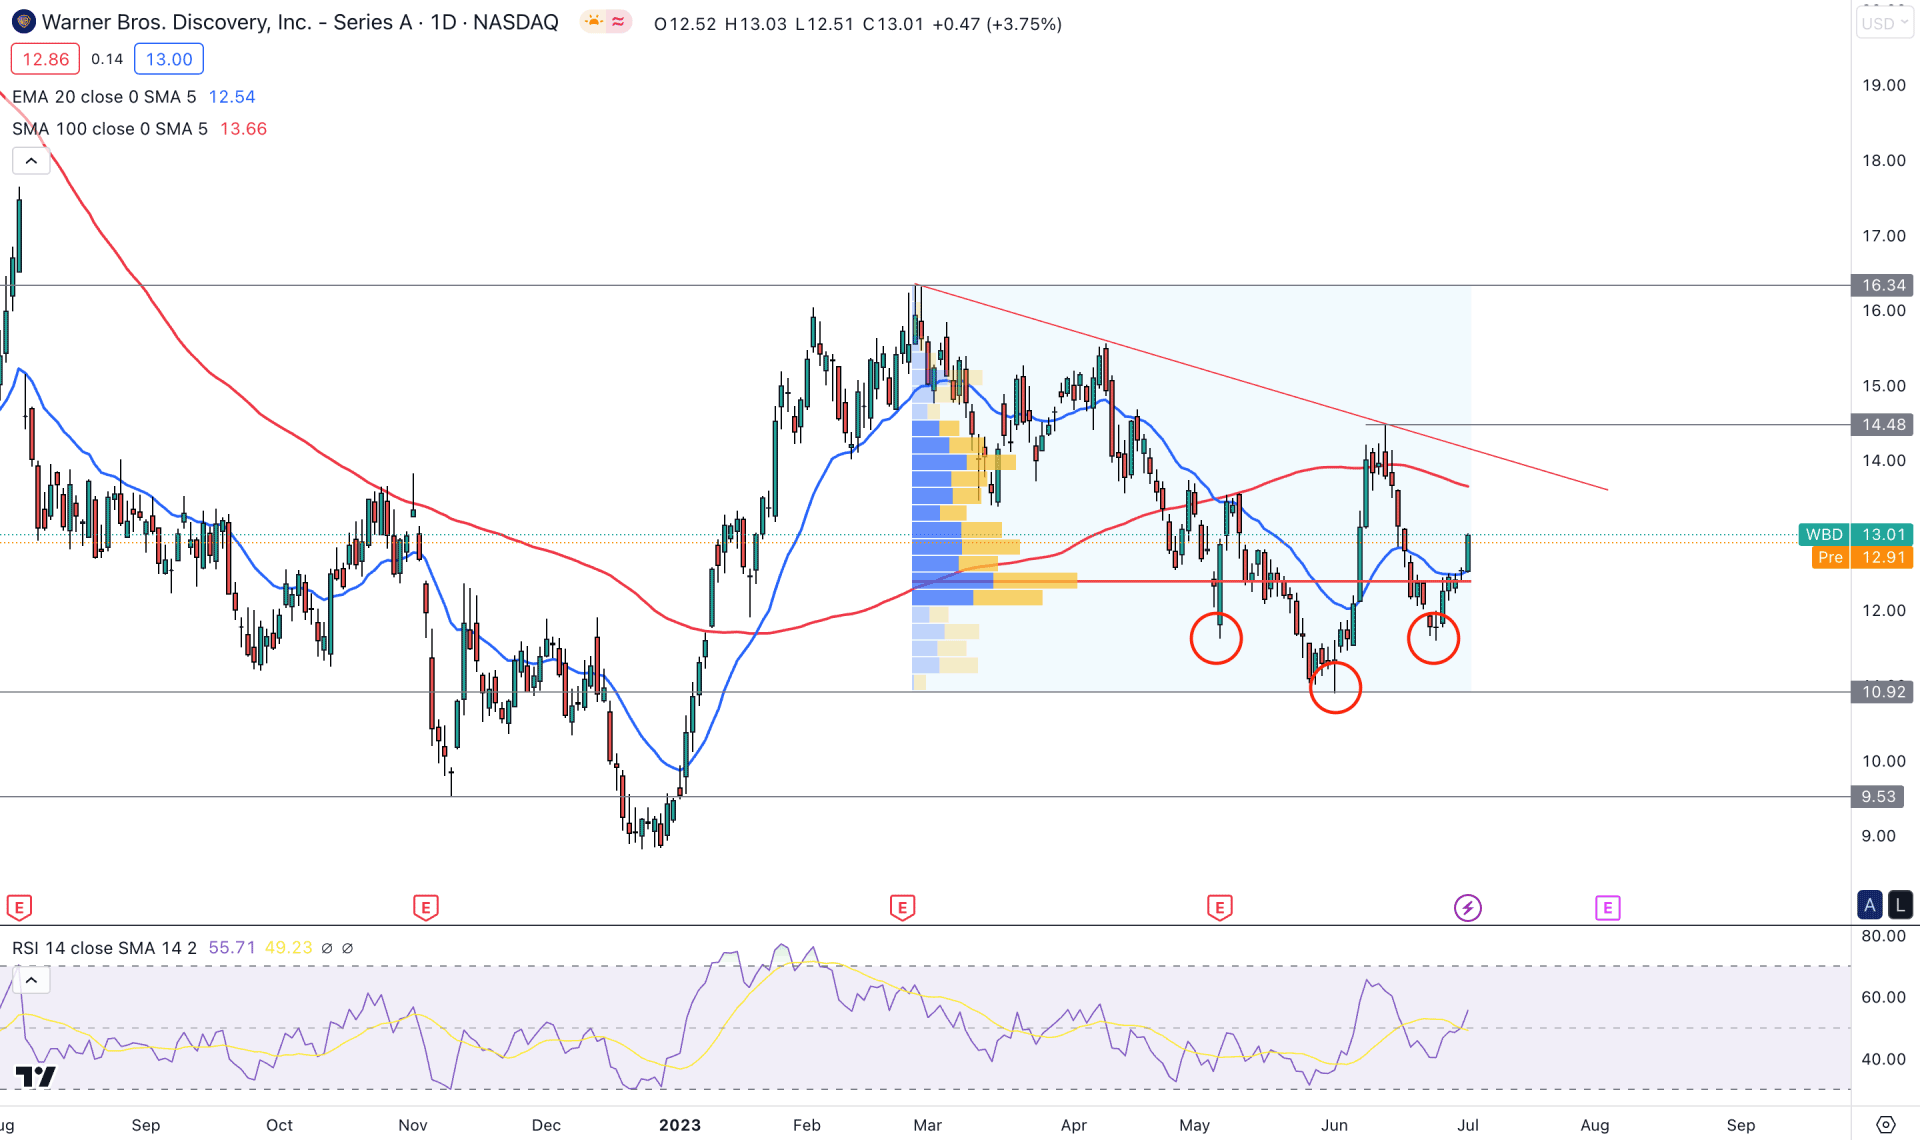
In the daily chart of WBD, the early buying signal is present from the sell-side liquidity sweep at the 9.53 key support level. The long-term bearish trend pushed the price below this zone but showed an immediate recovery. It is a sign of a strong buyers' presence in that area, and they might find another chance to fill orders from any bottom.
Besides, a potential inverse Head and Shoulders formation might work as a confluence bullish signal. However, the current price is still trading below the 100-day Simple Moving Average line, which indicates that the long-term trend is not established on the bullish side. However, the latest price moved above the 20-day Exponential Moving Average, signaling that short-term bulls have joined the market.
The integration of volume with the price action is crucial for stock investment and higher volume represents higher investment activity. Therefore, buying pressure with a higher trading volume is important, and for WBD, there is no expectation.
As per the latest volume structure, the highest trading volume since 27 February is at 12.40 level, which is just below the current price. Moreover, a strong bullish daily candle is present above this level, breaching the 20 EMA level.
The indicator window shows a strong bullish opportunity as the recent Relative Strength Index (RSI) failed to hold momentum below the 50.00 neutral line.
Based on the daily price outlook of WBD, the broader market structure is bearish. Still, the recent price action signals a bullish reversal possibility from the inverse Head and Shoulders breakout.
Investors should keep a close eye on the descending trend line resistance, as a valid trendline breakout with a daily candle above the 14.48 level would be a conservative buying sign, targeting the 30.00 area.
The alternative approach is to wait for the price to come below the 10.92 level, which may increase the possibility of testing the 8.00 level.
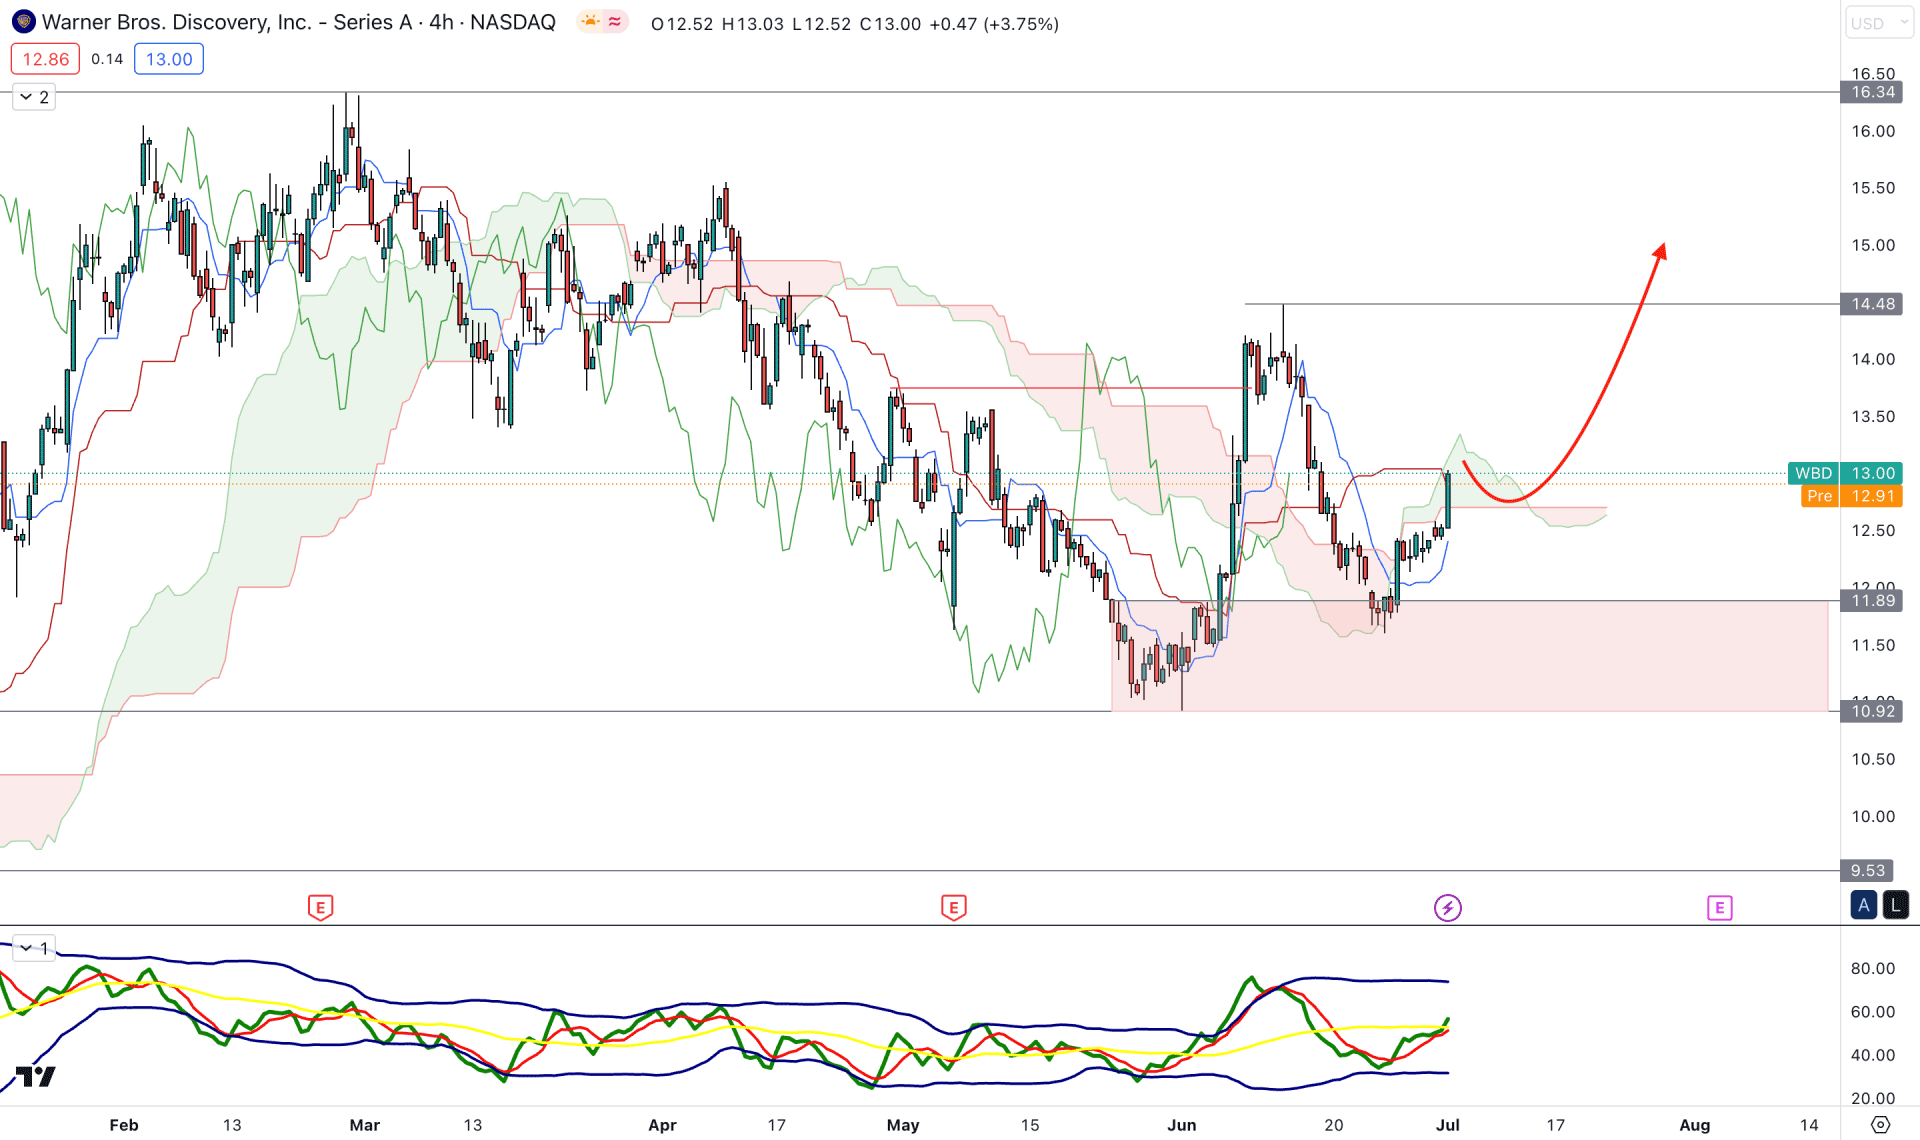
In the H4 outlook of WBD, the broader market direction is corrective, but a strong push above the Ichimoku Cloud is seen. It is a sign of an early bullish breakout, supported by the bullish CHoCH formation at the 13.75 level.
After making a swing high at the 14.48 level, bulls showed further interest from the 11.89 to 10.92 demand zone. As the recent price showed a bullish rejection from this area, we may expect the upcoming market direction to be bullish.
In the future cloud, the Senkou Span A reached the Senkou Span B, and a bullish crossover could validate the bullish trend. Also, the dynamic Kijun Sen is at the current price, and a bullish break above this level is needed to anticipate a long signal.
Based on the current market outlook, a bullish trend continuation opportunity is present in the H4 structure, and bulls may regain momentum to test the 20.00 level. However, breaking below the 10.90 level might extend the downside pressure, targeting the 9.00 level.
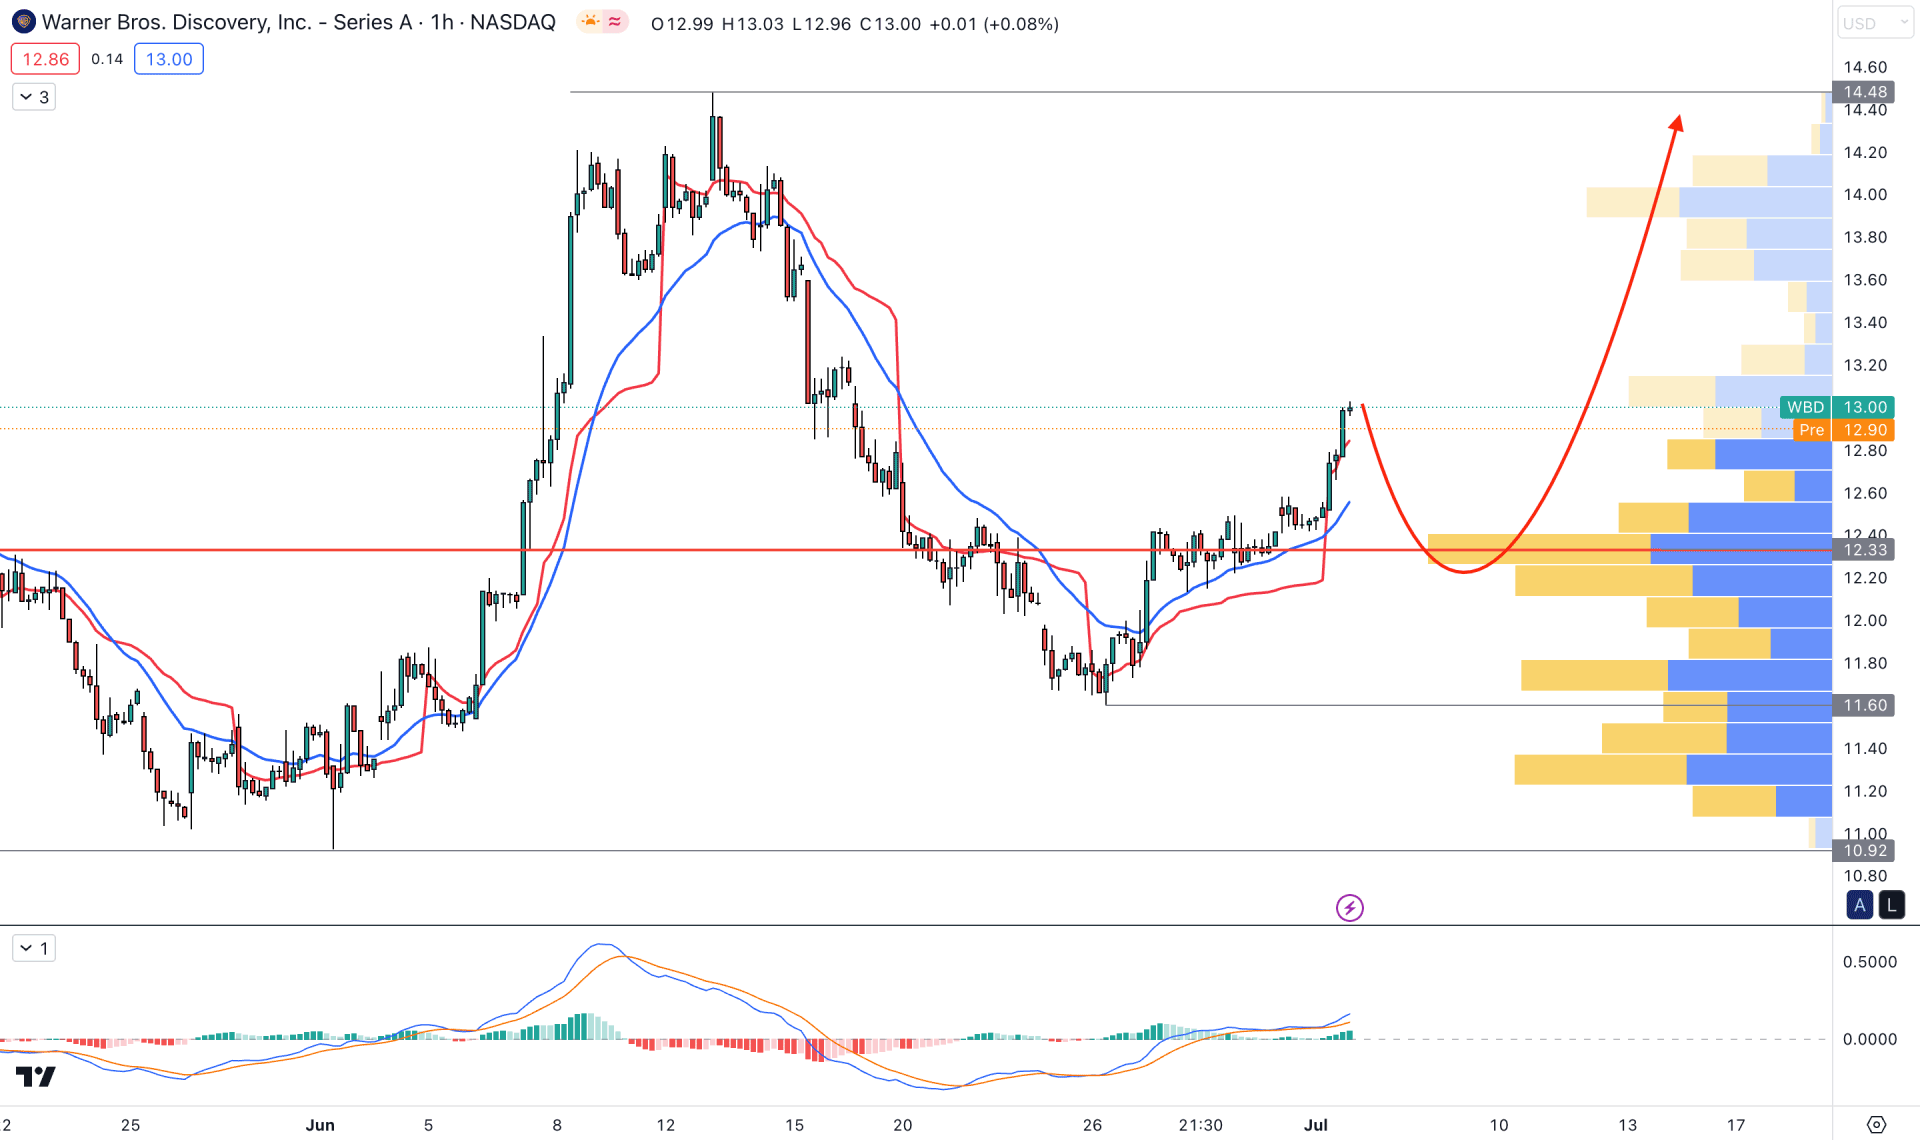
In the hourly chart, the current price is trading above the visible range high volume level, which signals that short-term bulls are active in the market. Moreover, the dynamic 20 EMA is working as an immediate support, whereas the current MACD Histogram is bullish.
The H1 structure shows a long opportunity, which is valid as long as the high volume level is below the current price. A bearish break with a new H1 candle below the 11.60 level might invalidate the bullish possibility at any time.
Based on the current market outlook, WBD stock could offer a strong long opportunity after breaking above the Inverse Head and Shoulders neckline. However, investors can join the market early if any bullish rejection shows from the H4 chart.


