
Published: February 19th, 2025
According to analysts, Walmart's overall sales are expected to have increased by 5% when it closes out fiscal year 2025, from $648.13 billion in FY24 to $678.56 billion. Walmart's revenue is expected to increase by 4% in FY26, reaching $704.61 billion.
Walmart's revenues are predicted to reach $179.18 billion in Q4, a 3% year-over-year increase. Earnings are anticipated to rise by 6% to $0.64 a share.
Over the course of the year, Walmart's earnings are anticipated to increase by 12% to $2.48 per share, from $2.22 in FY24. Analysts also predict that EPS will increase by an additional 11% in FY26, reaching $2.74.
Walmart's stock is currently trading at a forward P/E ratio of 37.9X, which is substantially higher than the S&P 500's 23X, at about $103 per share. Although it is near Amazon's 36.2X, it trades above Target's 13.7X.
Since its 3-for-1 stock split in February of last year, Walmart's stock has increased by more than 70%. Target's stock has fallen 13% over the last 12 months, while WMT has beaten the overall market and Amazon's 33% rise.
Let's see the future price direction of this stock from the WMT technical analysis:
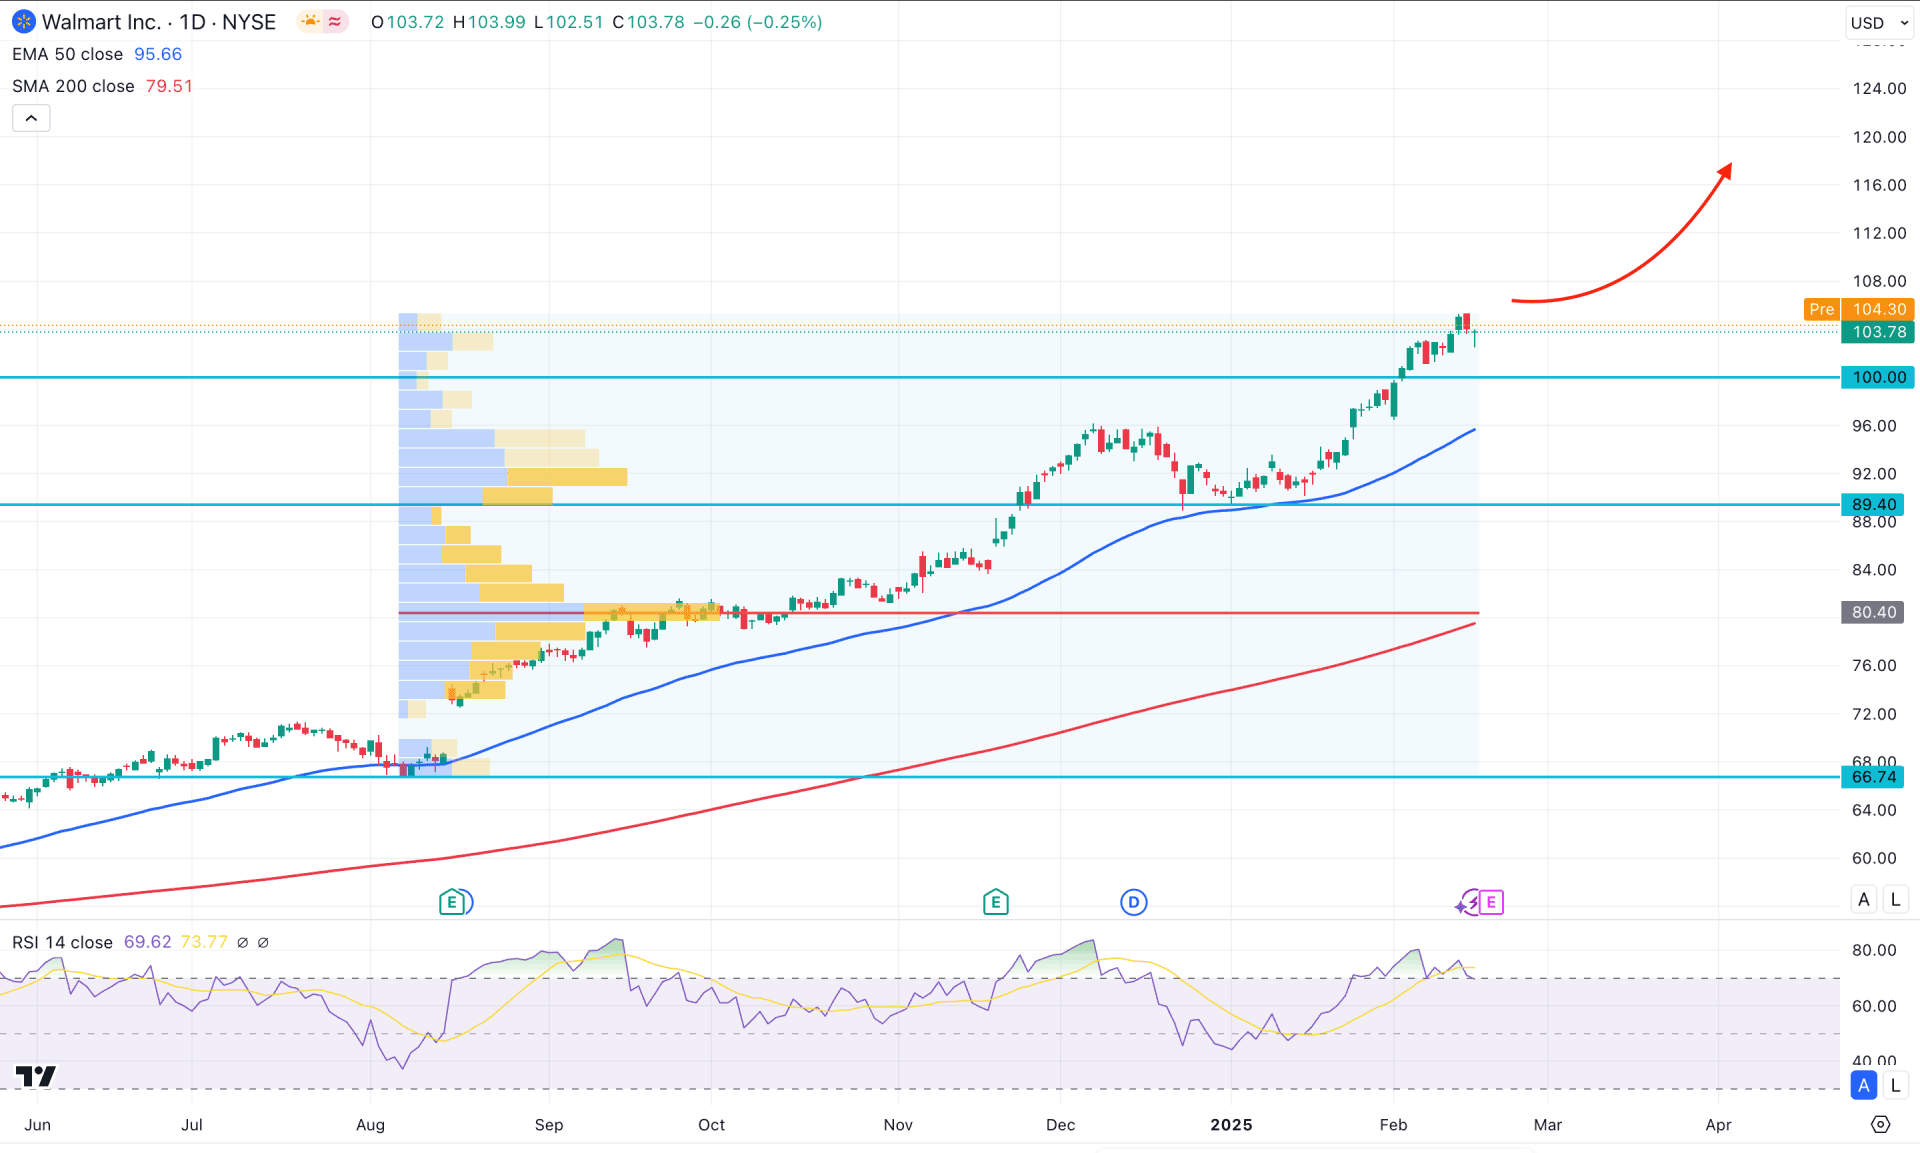
In the daily chart of WMT, an ongoing bullish trend is clear, with the current price trading near the all-time high area. Investors might wonder whether they should buy this stock at a record-high price or offload some investments if they hold an existing position.
Before proceeding further, let's see the price from the bird's eye view. It's been a roller coaster ride for this stock since the May 2022 bottom, taking the price at the 160% gain to the current price. Moreover, the ongoing monthly candle has been bullish for two consecutive months, with no sign of a recovery. The weekly price shows the same story, where the current price is trading within a bullish impulse after a rally-base-rally formation.
In the volume structure, the most active level since August 2024 is at the 80.40 level, which is way below the current price. Based on the volume structure, the bullish momentum is solid, from where an overbought condition could signal a minor downside correction.
In the main chart, the 200 day Simple Moving Average is below the high volume line, working as a major support. Moreover, the 50-day Exponential Moving Average has a bullish slope, below the 100.00 psychological line, which might work as an additional bullish signal.
In this context, the major market momentum is bullish for this stock, supported by the ongoing surge in the consumer price index (CPI). Moreover, the upbeat earnings projection could work as a bullish factor for this stock. In that case, the near-term psychological level to look at is the 120.00 level, which will be the primary target.
On the other hand, a stable price is visible above the 100.00 level, which might work as a strong support. Below that, the 50-day EMA and 89.40 static lines would be crucial prices to look at. A selling pressure with a daily candle below the 89.00 level might invalidate the current bullish momentum and lower the price towards the 200 day SMA area.
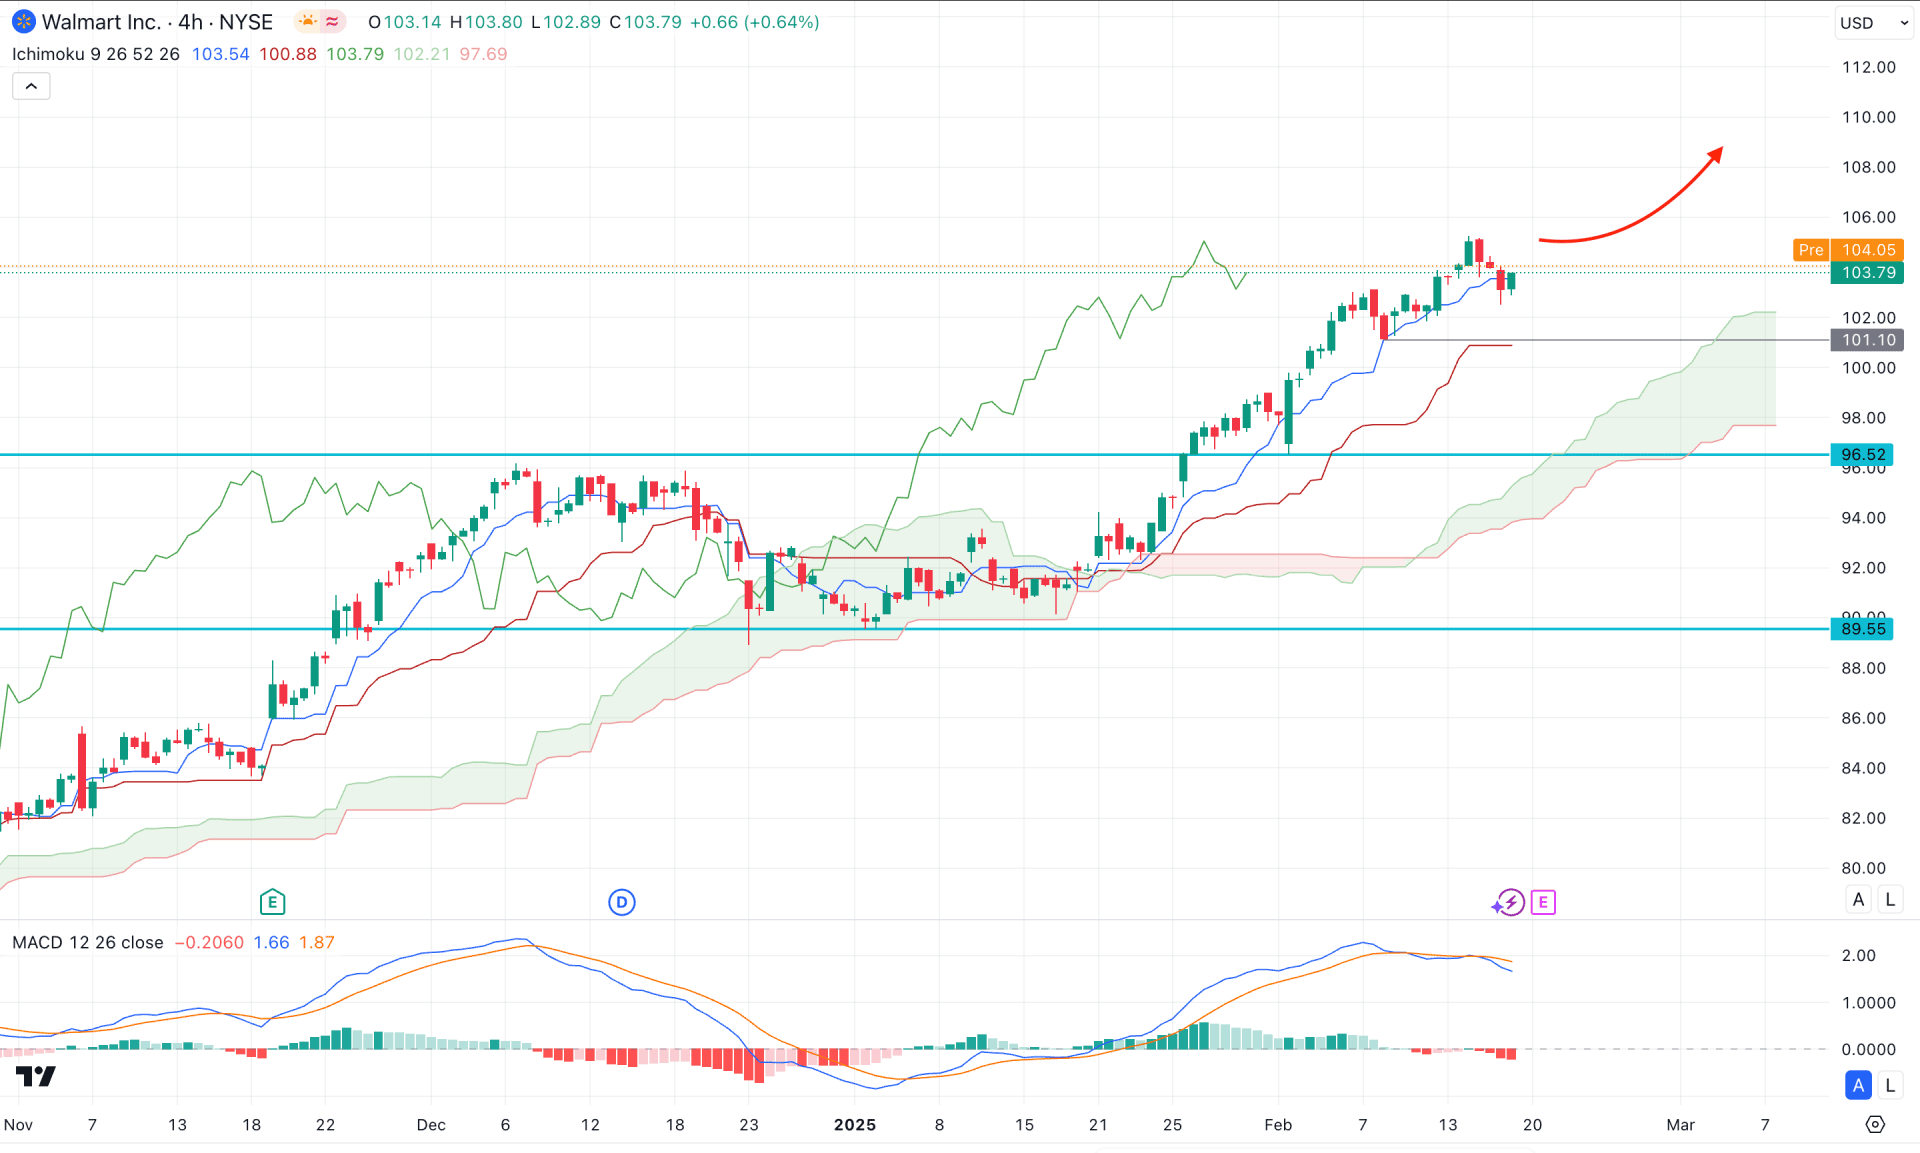
In the H4 timeframe, the most recent price is trading above the Ichimoku Cloud zone after having a minor retest. As long as the dynamic lines are below the current price, it might extend higher in the coming hours.
On the other hand, the overbought market condition is visible in the indicator window. The MACD Signal line formed a divergence with a bearish crossover at the top, while the Histogram fell below the neutral line.
Based on this outlook, investors might expect the price to form a minor bearish pressure before following the major bullish trend. Any bullish reversal from the dynamic Kijun Sen line could be a long opportunity, aiming for the 120.00 level.
On the other hand, a deeper downside correction might appear towards the Ichimoku Cloud zone, where buyers' tolerance level would be at the 92.00 level. Below this line, the price is likely to extend the loss and find support from the 80.00 area.
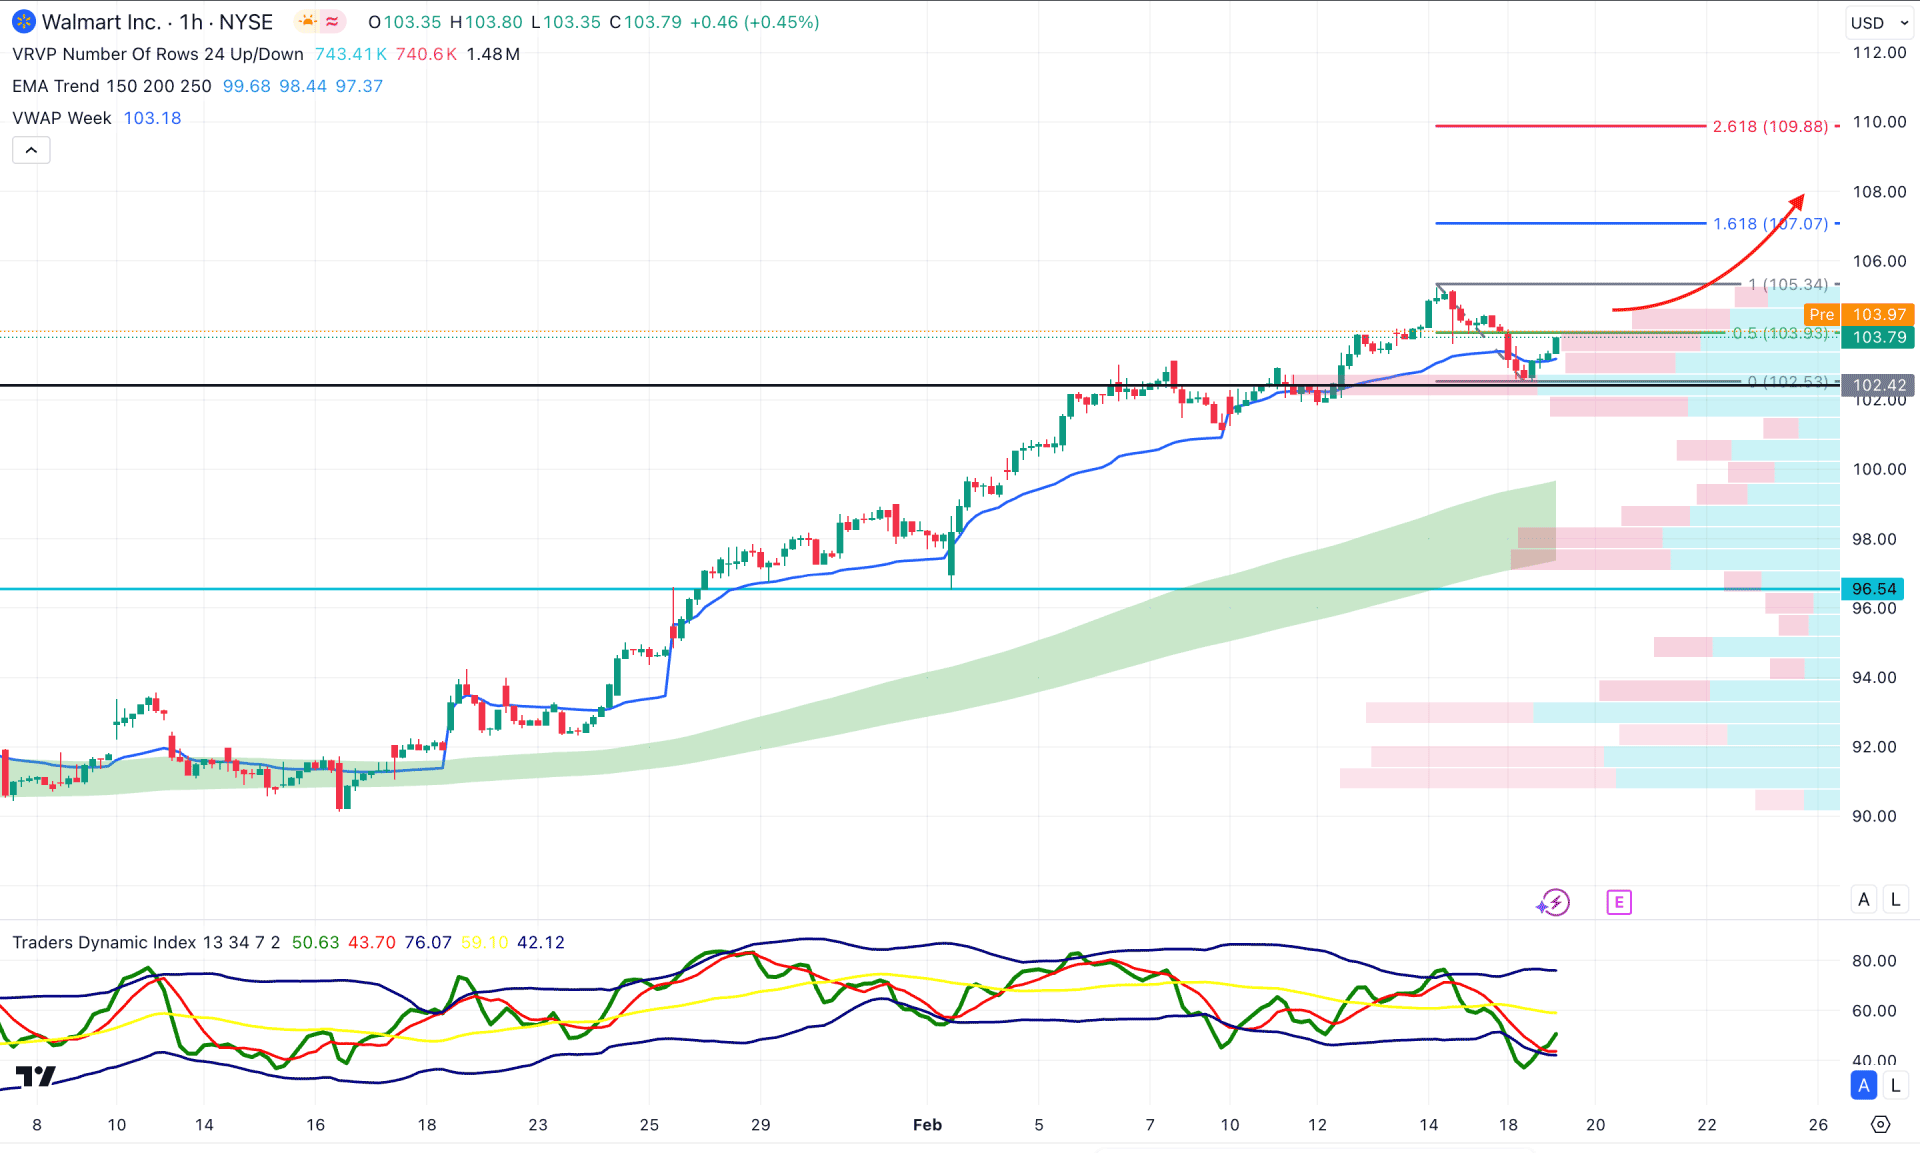
In the H1 timeframe, a bullish continuation momentum is visible. The Visible Range High Volume line is below the current price and working as a crucial support. The Moving Average wave is also below the current price and has a bullish slope.
In the immediate price action, a bullish rebound is visible with the hourly candle above the weekly VWAP line. The indicator window shows the same story where the current TDI line showed a rebound from the oversold line.
Based on this outlook, a bullish continuation is likely to appear where an hourly candle above the 105.34 level could extend the momentum above the 110.00 area.
The alternative approach is to find the deeper correction towards the Moving Average wave. However, more downside pressure below the 96.54 level could invalid the current structure and lower the price toward the 80.00 area.
Based on the current multi-timeframe analysis, WMT is trading within a strong bullish trend, with no sign of a bearish recovery. As the record-high price is near, the ideal approach is to look for long positions from the intraday perspective.


