
Published: August 10th, 2022
Walmart stock gained almost 0.94% over the past month, while the broader retail-wholesale sector gained 9.2%, with 8.25% growth in S&P 500.
However, wall street will be looking for a positive signal for Walmart as it approaches the earnings report date on 16 August 2022. On the earnings release date, Walmart is expected to show revenue at $1.60 per share, indicating a 10.11% year-over-year decline.
Valuation is also an important metric for this instrument, where the current Forward P/E ratio is at 22.11. However, the industry average Forward P/E is at 12.09, which indicates that Walmart stock is trading at a premium price.
In the PEG ratio, Walmart is also supportive to bulls, where the current PEG for WMT is 4.92, higher than the industry average of 1.80.
Despite the growth outlook, Walmart stock is trading lower where massive selling pressure is seen before the consolidation at 120.00 swing low. Can bulls recover the price? Let’s have a look at the future price direction from Walmart Stock (WMT) technical analysis.
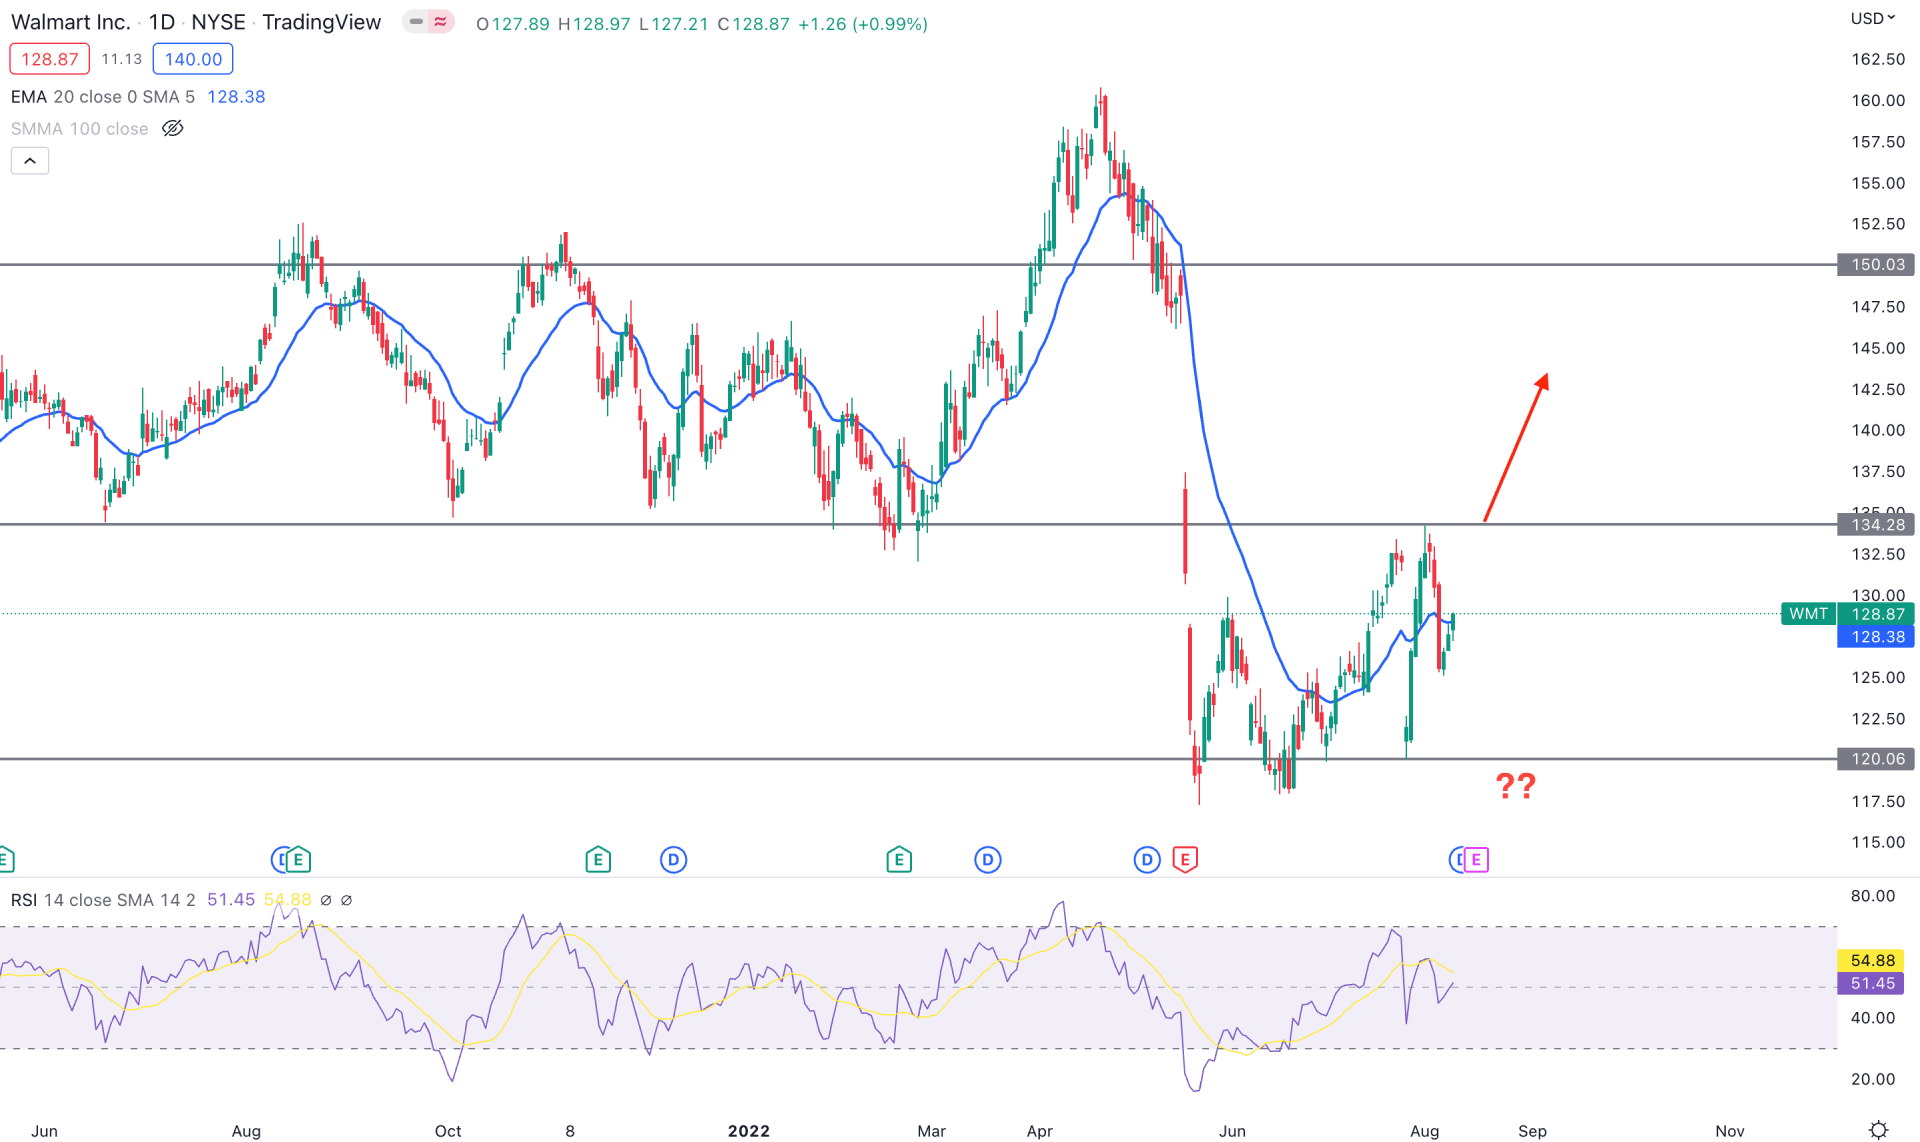
In the daily chart, Walmart Stock is trading lower where the recent price trades within the 120.00 134.28 zone. However, the excessive volatility after the bearish trend indicates that bears are struggling to hold the momentum, where any buying pressure would indicate a trading opportunity.
Walmart stock showed buying pressure from the 120.00 level as the price made a massive bullish daily close above the 20-day moving average. In the indicator window, neutral market momentum is seen from the Relative Strength Index, where the current RSI Leven hovers at the 50% level.
Based on the daily price structure, the bullish pressure may extend towards the 150.00 key resistance level if bulls can close above the 134.28 level daily. The alternative approach is to find a bearish daily candle below the 120.00 level before aiming toward the 100.00 psychological area.
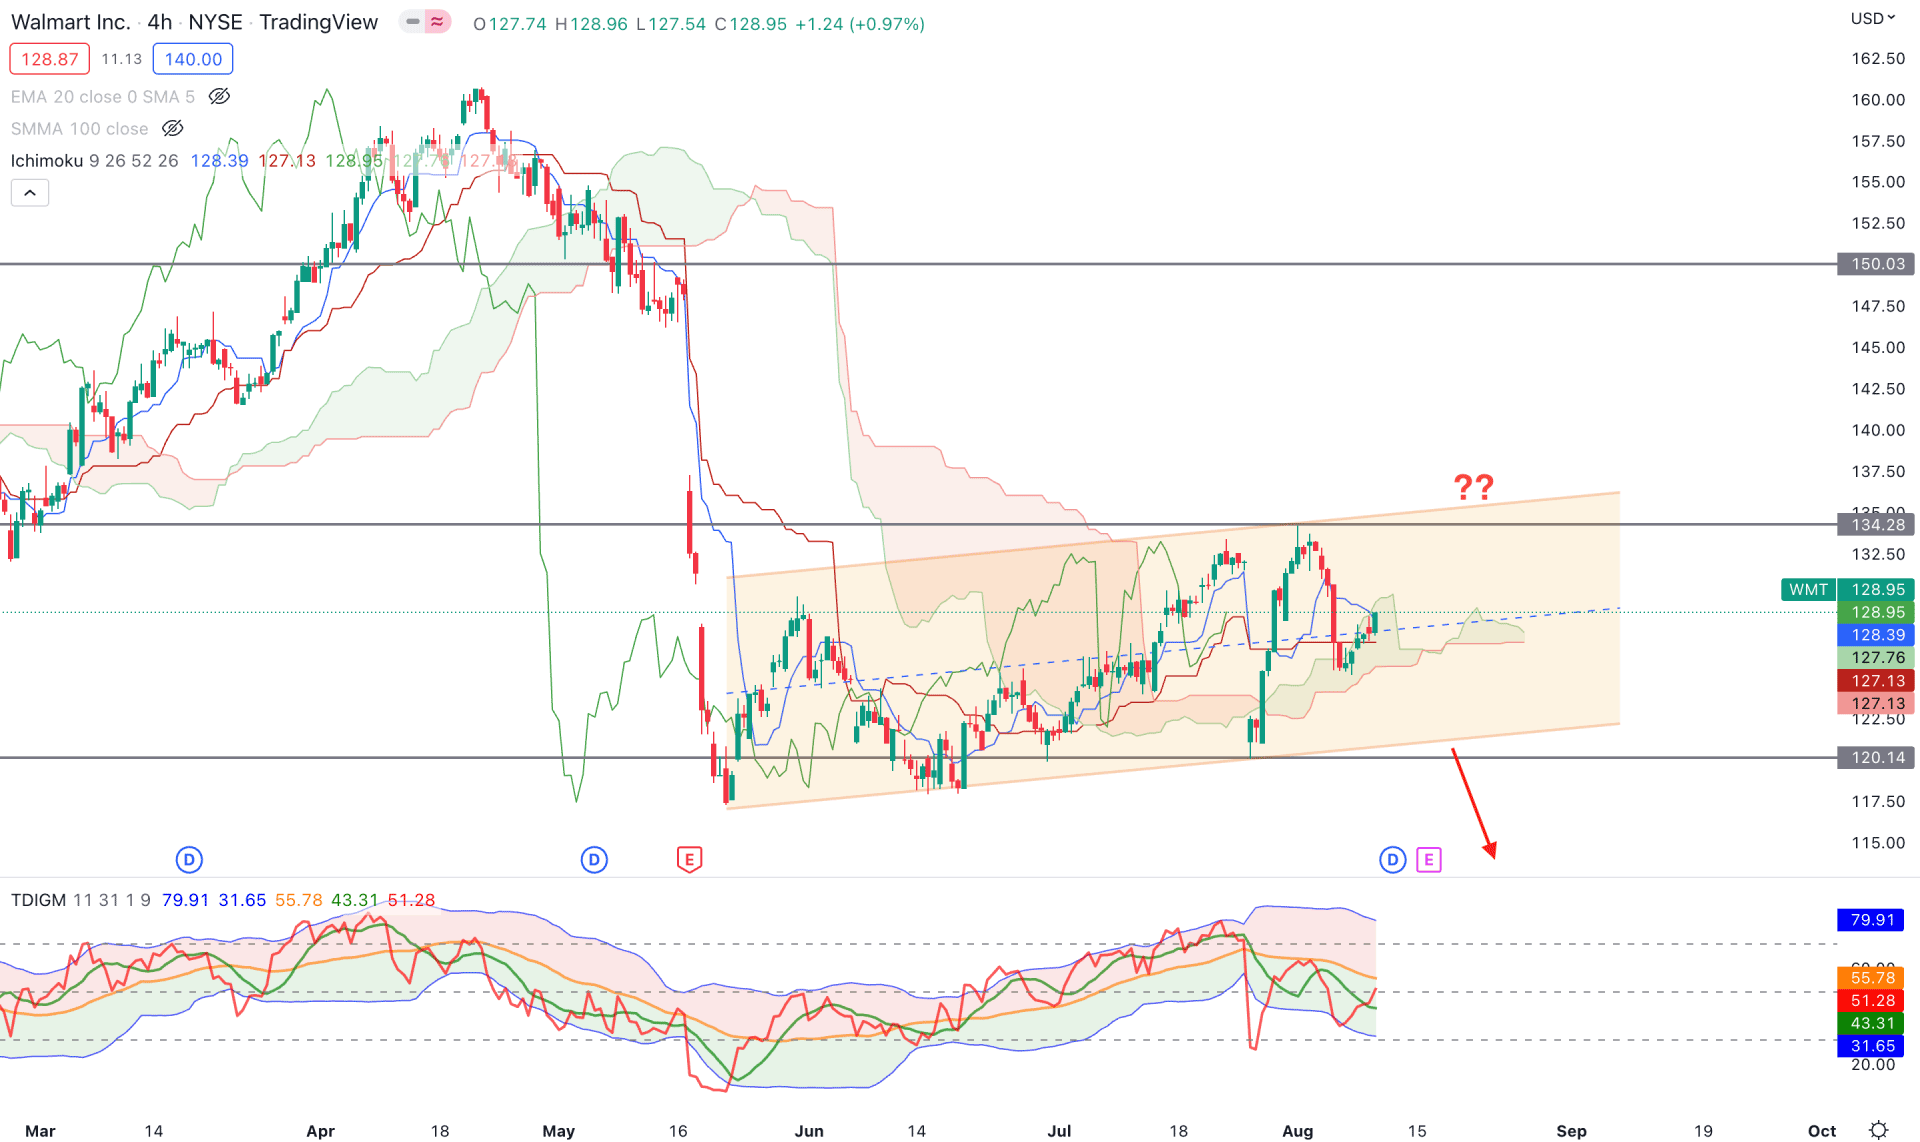
In the H4 timeframe, WMT shows a selling pressure from the ascending channel where any bearish rejection from the channel resistance would be a sell signal.
On the other hand, the Ichimoku Cloud shows a different story where the Senkou Span A is above the Senkou Span B in the future cloud. The current price is also trading in the cloud area, where the position of the dynamic Kijun Sen is corrective.
In the Traders Dynamic Index, the TDI line is at the 50% level after showing buying pressure from the lower band. The dynamic Kijun Sen is flat, while the Tenkan Sen is at the price level.
Based on the H4 price action, the buying pressure may resume if an H4 close appears above the Tenkan Sen level. In that case, the bullish momentum may extend towards the 150.00 area. On the other hand, failure to hold the price above the cloud support with a bearish H4 candle below the channel support could lower the price towards the 100.00 area.
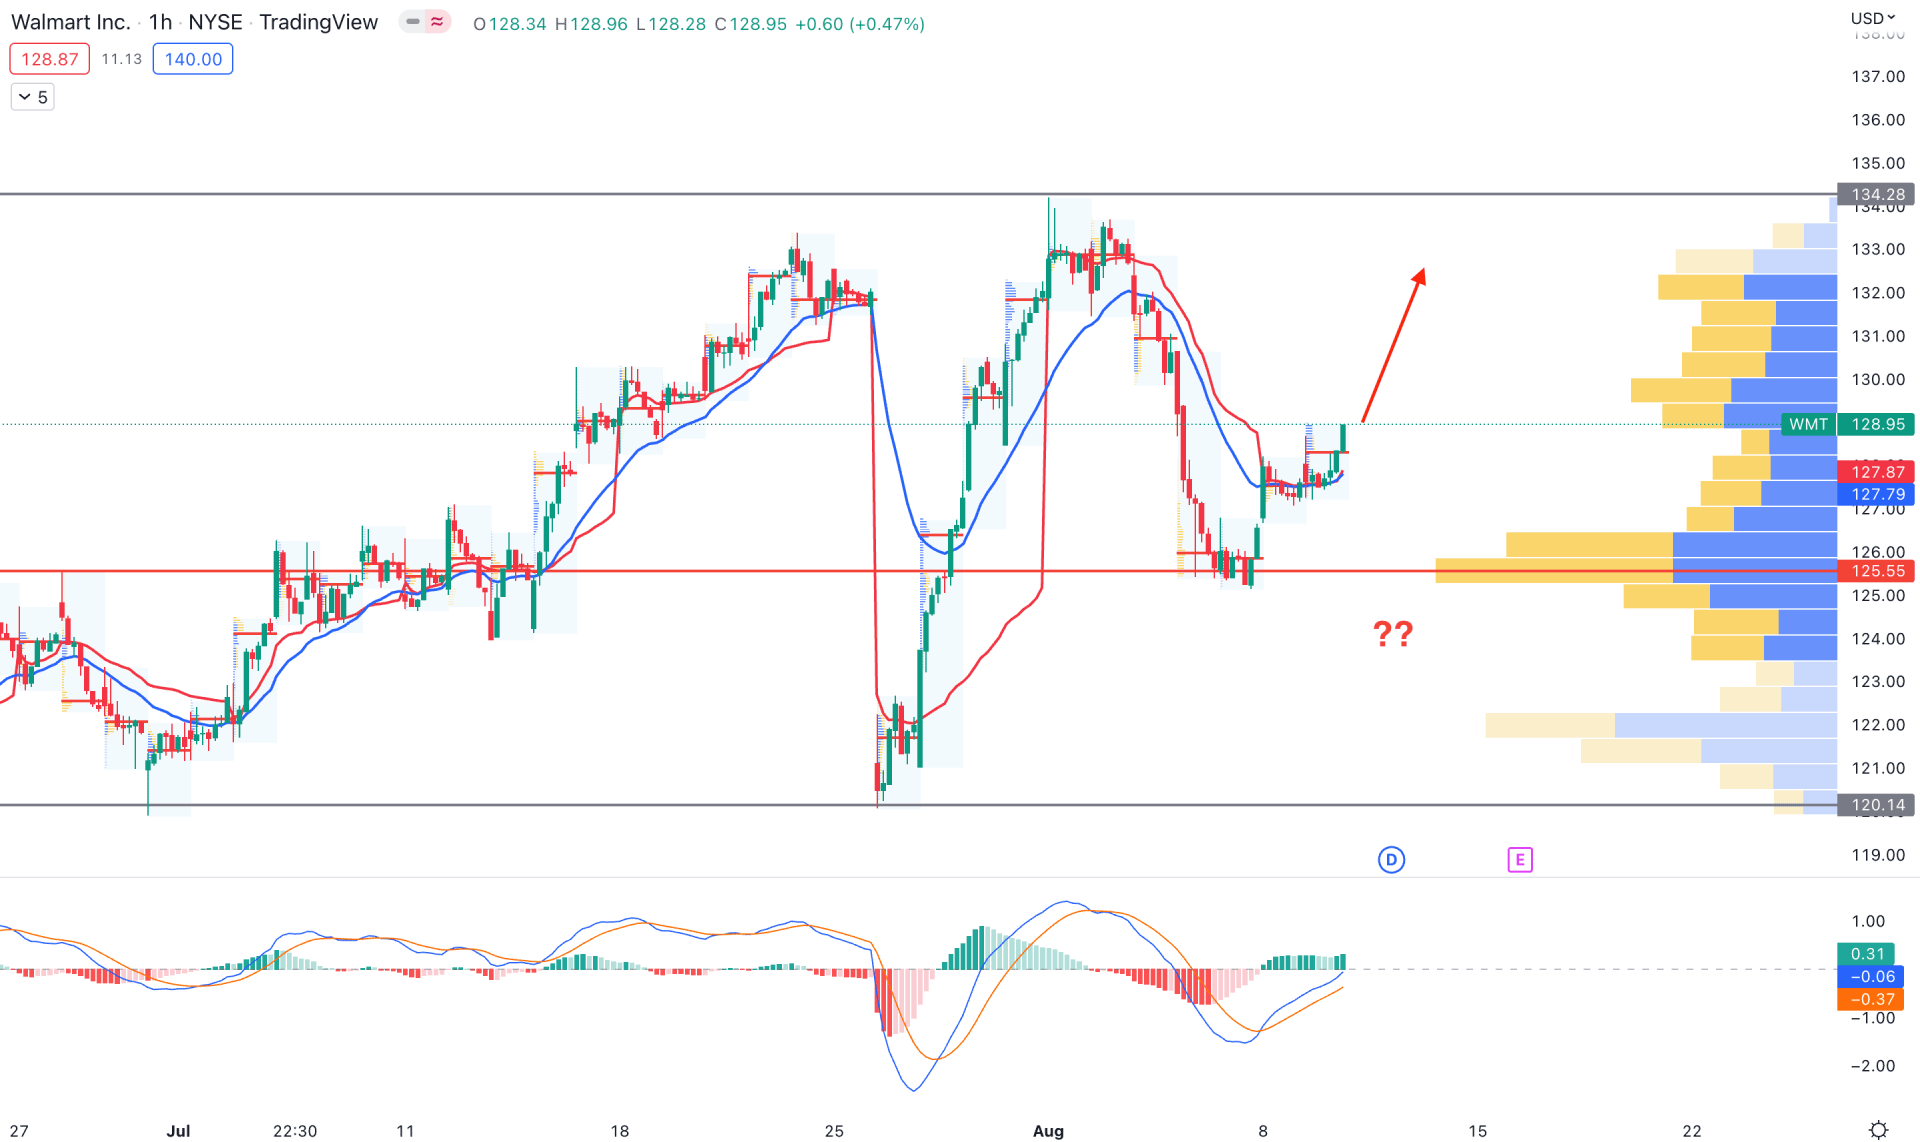
WMT shows a buy signal in the intraday price as it trades above the 125.55 visible range high volume level. Moreover, the current price is above the dynamic 20 EMA and weekly VWAP, indicating a short-term bullish pressure.
The MACD Histogram is bullish, where further new highs could be a bullish signal for this instrument. Based on this structure, a bullish H1 candle above the 130.00 level could extend the price towards the 150.00 level.
On the other hand, if the price comes below the 125.55 high volume level, it may invalidate the buying pressure and move lower towards the 120.00 level.
Based on the current multi-timeframe analysis, Walmart Stock is trading with an upside potential where a bullish daily candle above the 134.28 resistance level would be a conservative buying approach.


