Published: July 13th, 2023
Vital Energy Inc., a highly regarded independent energy company, recently reported its quarterly earnings for the period ending on May 9th. The financial results revealed that the company earned $4.50 per share, $0.19 less than the consensus estimate.
Vital Energy displayed a return on equity of 34.78 percent, demonstrating its capacity to generate profits from shareholder investments. In addition, the company accomplished a remarkable net margin of 48.36%, indicating a profitable and healthy operation.
Vital Energy specializes in acquiring, exploring, and exploiting oil and natural gas properties in the West Texas's Permian Basin. The company changed from Laredo Petroleum to Vital Energy Inc. in January 2023.
Regarding liquidity and financial health, Vital Energy has a quick and current ratio of 0.59, indicating that the company may have difficulty meeting its short-term obligations. However, this is counterbalanced by a debt-to-equity ratio of 0.95, which indicates responsible leverage.
Despite Vital Energy's recent earnings report falling short of expectations and revenue falling year-over-year, its strong return on equity and net margin demonstrate its underlying profitability and growth potential.
Investors should closely monitor Vital Energy as it navigates market volatility and capitalizes on hydrocarbon and natural gas industry opportunities. Positive long-term prospects and a commitment to developing assets in the Permian Basin position the company favorably for success in the dynamic energy industry.
Let’s see the upcoming price direction of this stock from the VTLE technical analysis

VTLE shows strong downside pressure recently, but the price has gone sideways since May 2023, which is a sign of less seller's interest in the market.
In the higher timeframe price action, a bullish recovery is clear in the weekly chart, supported by a bullish two-bar reversal in the monthly time frame.
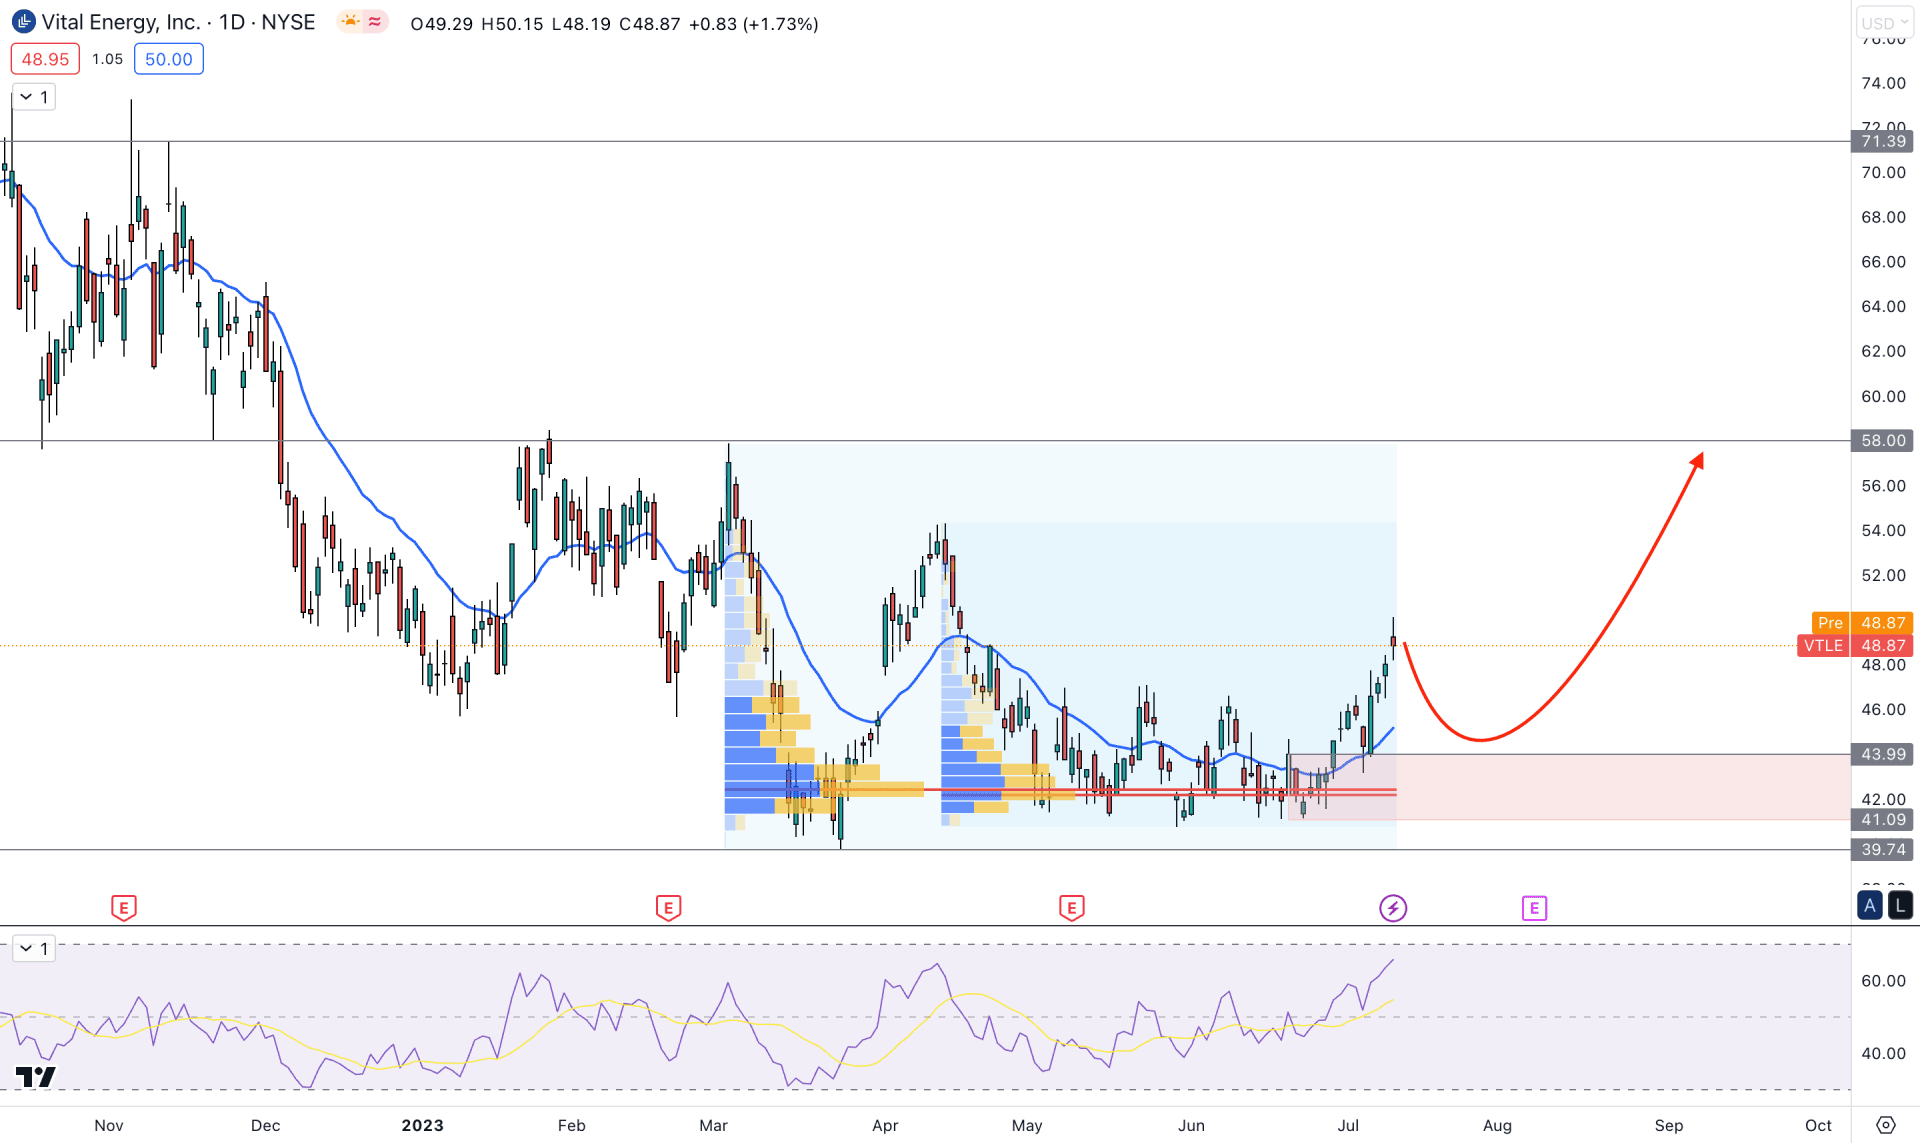
In the volume structure, the highest trading volume level since 03 March 2023 is spotted at the 42.11 level, below the current price. Another high volume level from 17 April 2023 high is also at 42.11 level. It is a sign that investors are very aggressive to the buyer's side with larger orders, which may result in a trend reversal.
The current daily price of VTLE trades above the dynamic 20-day Exponential Moving Average with a strong bullish rejection at the 43.99 to 41.09 demand zone. As the current price is trading above the dynamic 20 EMA with strong buying pressure, we may expect the upward momentum to continue in the near future.
In the indicator window, the current Relative Strength Index (RSI) shows sellers'/buyers' momentum in the market. As per the current reading, the RSI trades above the neutral 50.00 line, possibly reaching above the 70.00 overbought level.
Based on the daily outlook of VTLE, bulls have a higher possibility of taking control of the wheel. Therefore, the buying opportunity is valid if the price traders exceed the 39.74 key support level. The primary target of the bull run is to test the 58.00 resistance level before approaching the 71.39 level.
On the bearish side, investors should closely monitor how the price trades at the 43.99 to 41.09 demand zone. Breaking below this area could eliminate the current buying opportunity and lower the price toward the 30.00 psychological level.

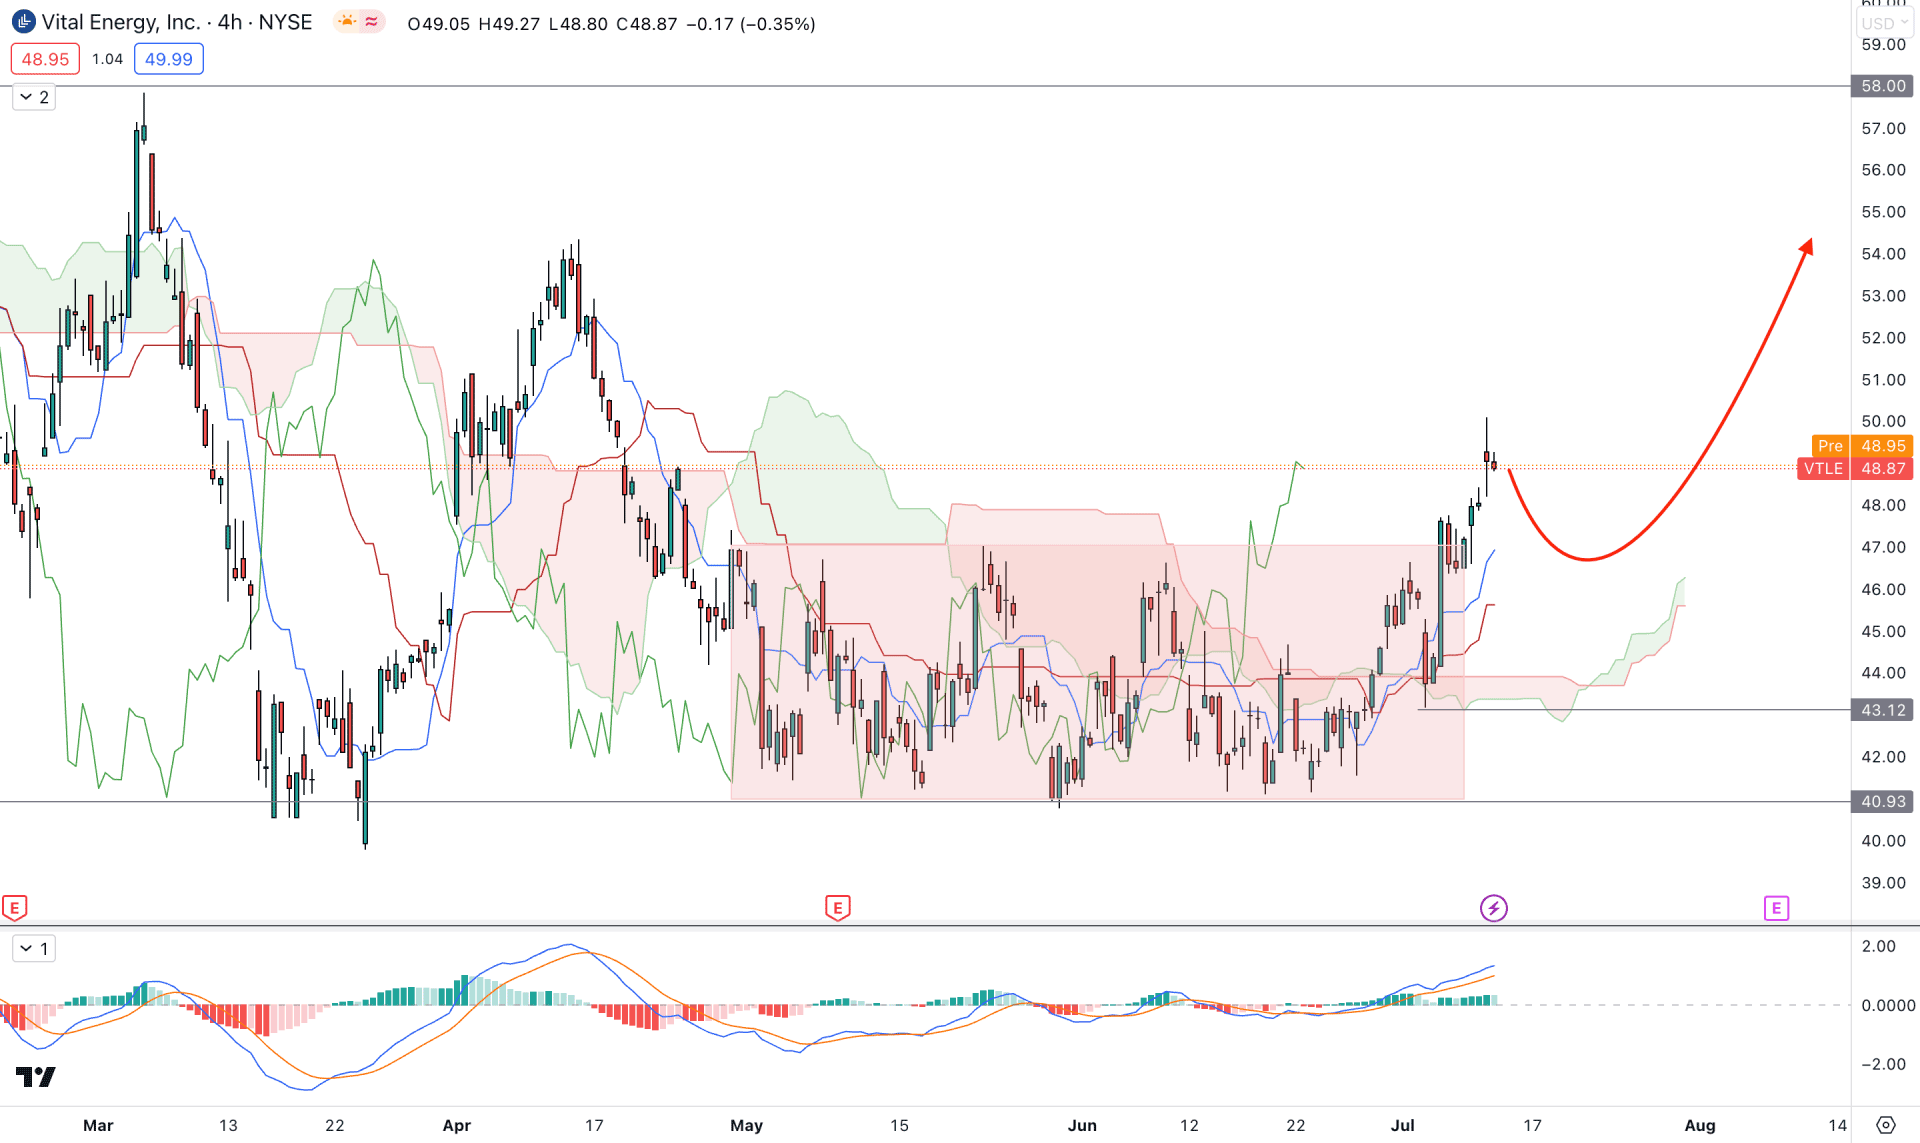
In the H4 timeframe, the bullish price action is visible from the rectangle pattern breakout, which has a strong consolidation. Moreover, buying pressure is visible from the bullish Ichimoku Cloud breakout.
In the future cloud, the Senkou Span A remains above the B, while the current Lagging Span is above the range. It is a sign that bulls are active in the market and can extend the upward pressure from the dynamic support level.
The current MACD Histogram remains above the neutral line, while the current MACD EMA’s are at the upper boundary.
Based on the H4 outlook, we may consider the current price momentum as bullish, but a minor bearish rejection is pending. Any bullish rejection from the 45.00 to 40.93 area could open a long opportunity, where the main aim is to test the 58.00 resistance level.
The alternative approach is to look for short opportunities after breaking below the 40.00 level with a bearish H4 close.

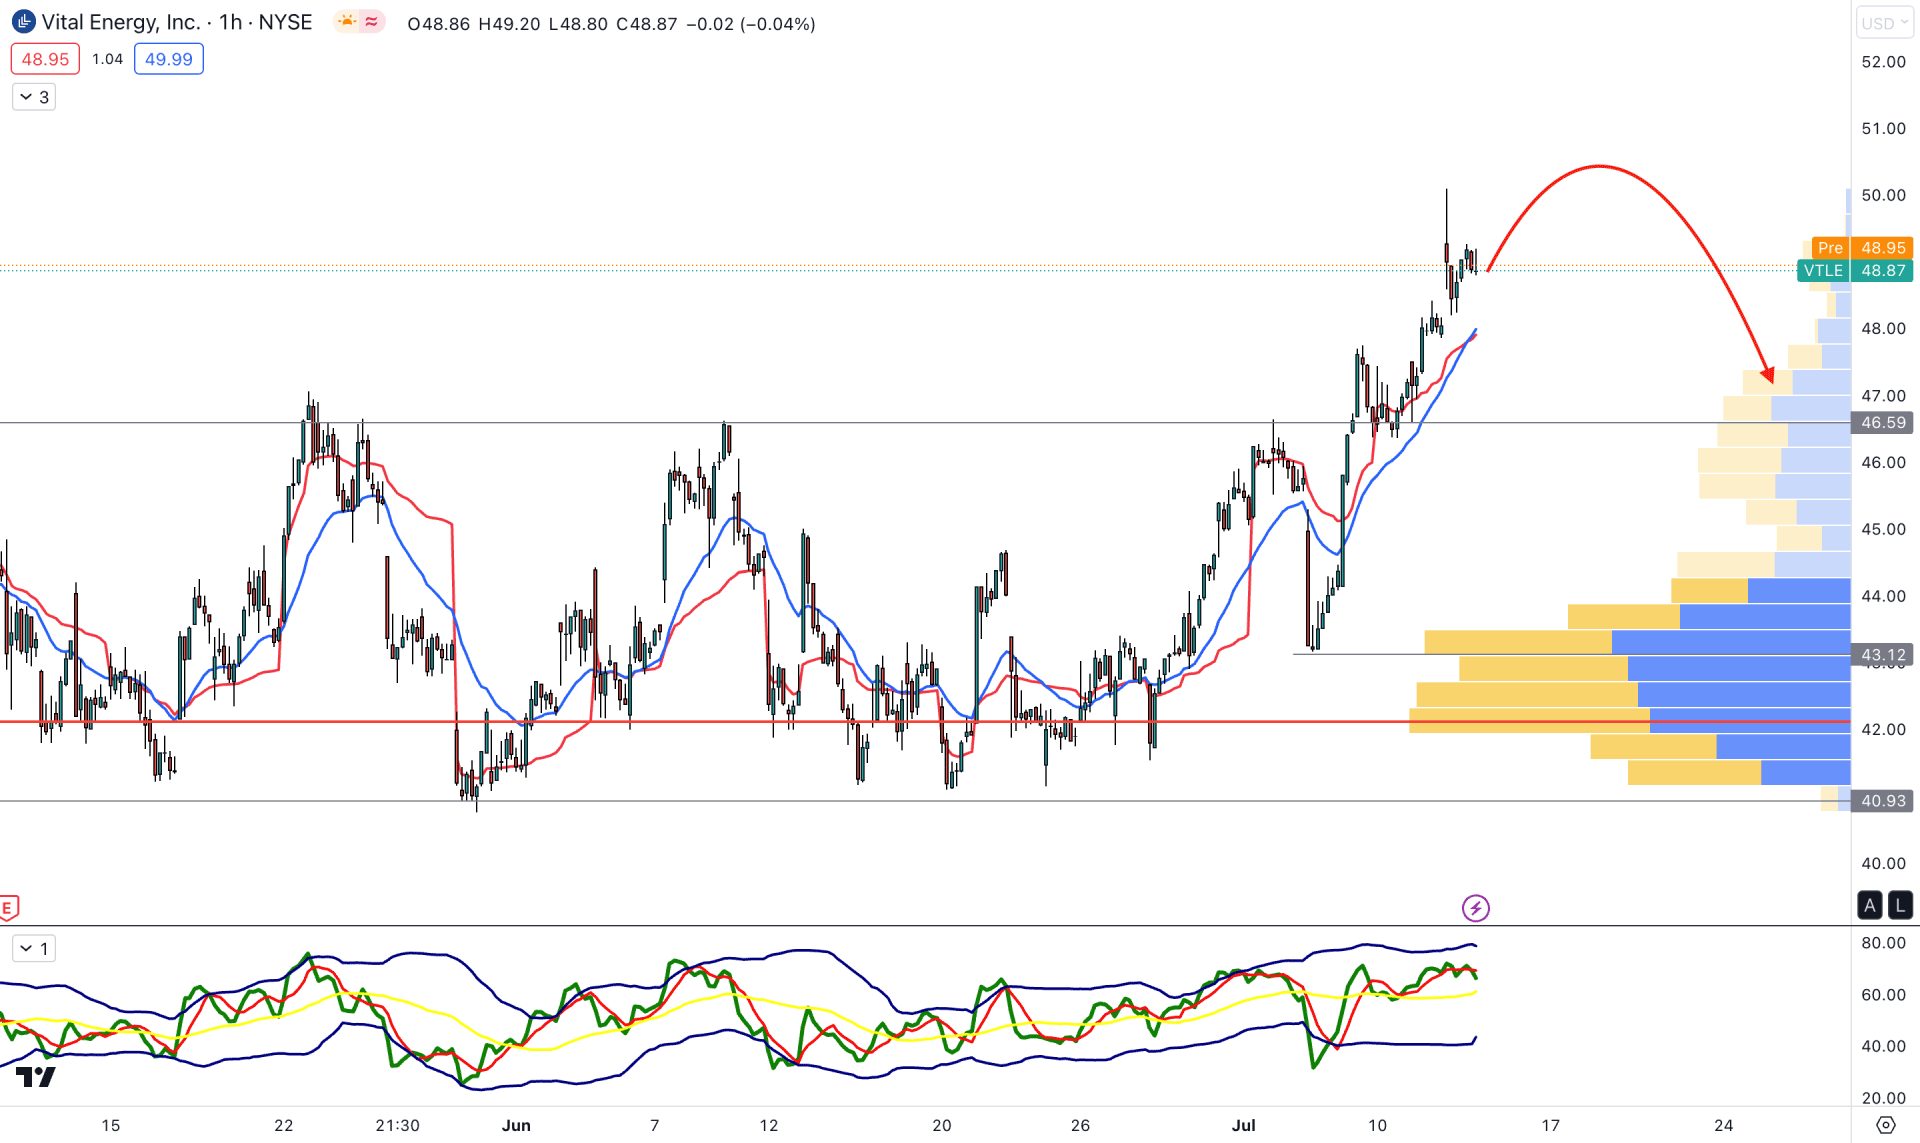
Despite the strong bullish outlook in the higher timeframe, the H1 chart shows a possible bearish pressure. The visible range high volume level is still below the current price, while a strong gap with the high volume zone indicates a possible mean reversion.
Moreover, the price moved above the dynamic 20 EMA and weekly VWAP and created a strong gap, which is also an indication of a possible bearish correction.
The current TDI indicator shows an overbought price while the current level is still above the 50.00 area.
Based on the current H1 outlook, downward pressure may come in the VTLE price, where the current aim is to test the 43.12 support level.
The alternative trading approach is to look for a bullish rejection from the 45.00 to 43.00 area before aiming for the 51.00 level.
Based on the current market outlook, VTLE could move higher in the coming days, and investors might find an early buying opportunity from the lower timeframe price action.