
Published: July 3rd, 2024
In the first half of 2024, Vistra's stock value has increased by an extraordinary 125%, placing it in the top three of the S&P 500, just behind Nvidia and Super Micro Computer.
Vistra, the largest competitive power generator in the US, has made significant investments in nuclear and other alternative energy sources that are anticipated to be significant contributors to future energy production. The company's revenue and earnings growth projections are robust, and recent EPS estimates suggest even more potential for bottom-line growth.
Additionally, Vistra's recent stock price decline presents an appealing entry point for investors.
Although artificial intelligence has received much attention this year, three of the top seven S&P 500 performers in the first half of 2024 were new-age energy companies, including Vistra.
Leading financial institutions, such as Goldman Sachs, regard the global energy transition as an essential component of the future of the U.S. economy.
Alternative energy accounts for approximately 80% of the global energy investment growth, and the International Energy Agency anticipates that $2 trillion will be allocated to renewable energy technologies and infrastructure in 2024. This investment will encompass the electricity grid, nuclear, energy storage, wind, and solar technologies.
Vistra's zero-carbon generation capacity was significantly improved by the completion of its acquisition of Energy Harbor in March. Vistra became a premier integrated zero-carbon generation and retail electricity company as a result of this acquisition, which included a 4,000-megawatt nuclear generation fleet and approximately 1 million retail customers.
Four nuclear generation facilities are owned by Vistra, which generates an adequate amount of zero-carbon baseload electricity to supply electricity to 3.2 million homeowners in the United States. It boasts the nation's second-largest competitive nuclear fleet and energy storage capacity, including one of the world's largest battery energy storage facilities. Additionally, Vistra is broadening its solar asset portfolio.
Let's see the further aspect of this stock from the Vistra (VST) technical analysis:
The Vistra stock trades sideways within a rectangular pattern in the broader market structure, from where a potential range breakout could signal a trend formation.
In the higher timeframe, the monthly close in June became bearish as an inside bar, while the long-term market trend remains bullish. In that case, investors should closely monitor how the price trades above the May 2024 low, as a bearish pressure below this line could signal a potential trend reversal. Moreover, the weekly price has remained sideways for the last four weeks, suggesting indecision after a massive bearish candle. In that case, the ongoing downside pressure is active from where sellers' failure is needed before anticipating the long-term bull run.
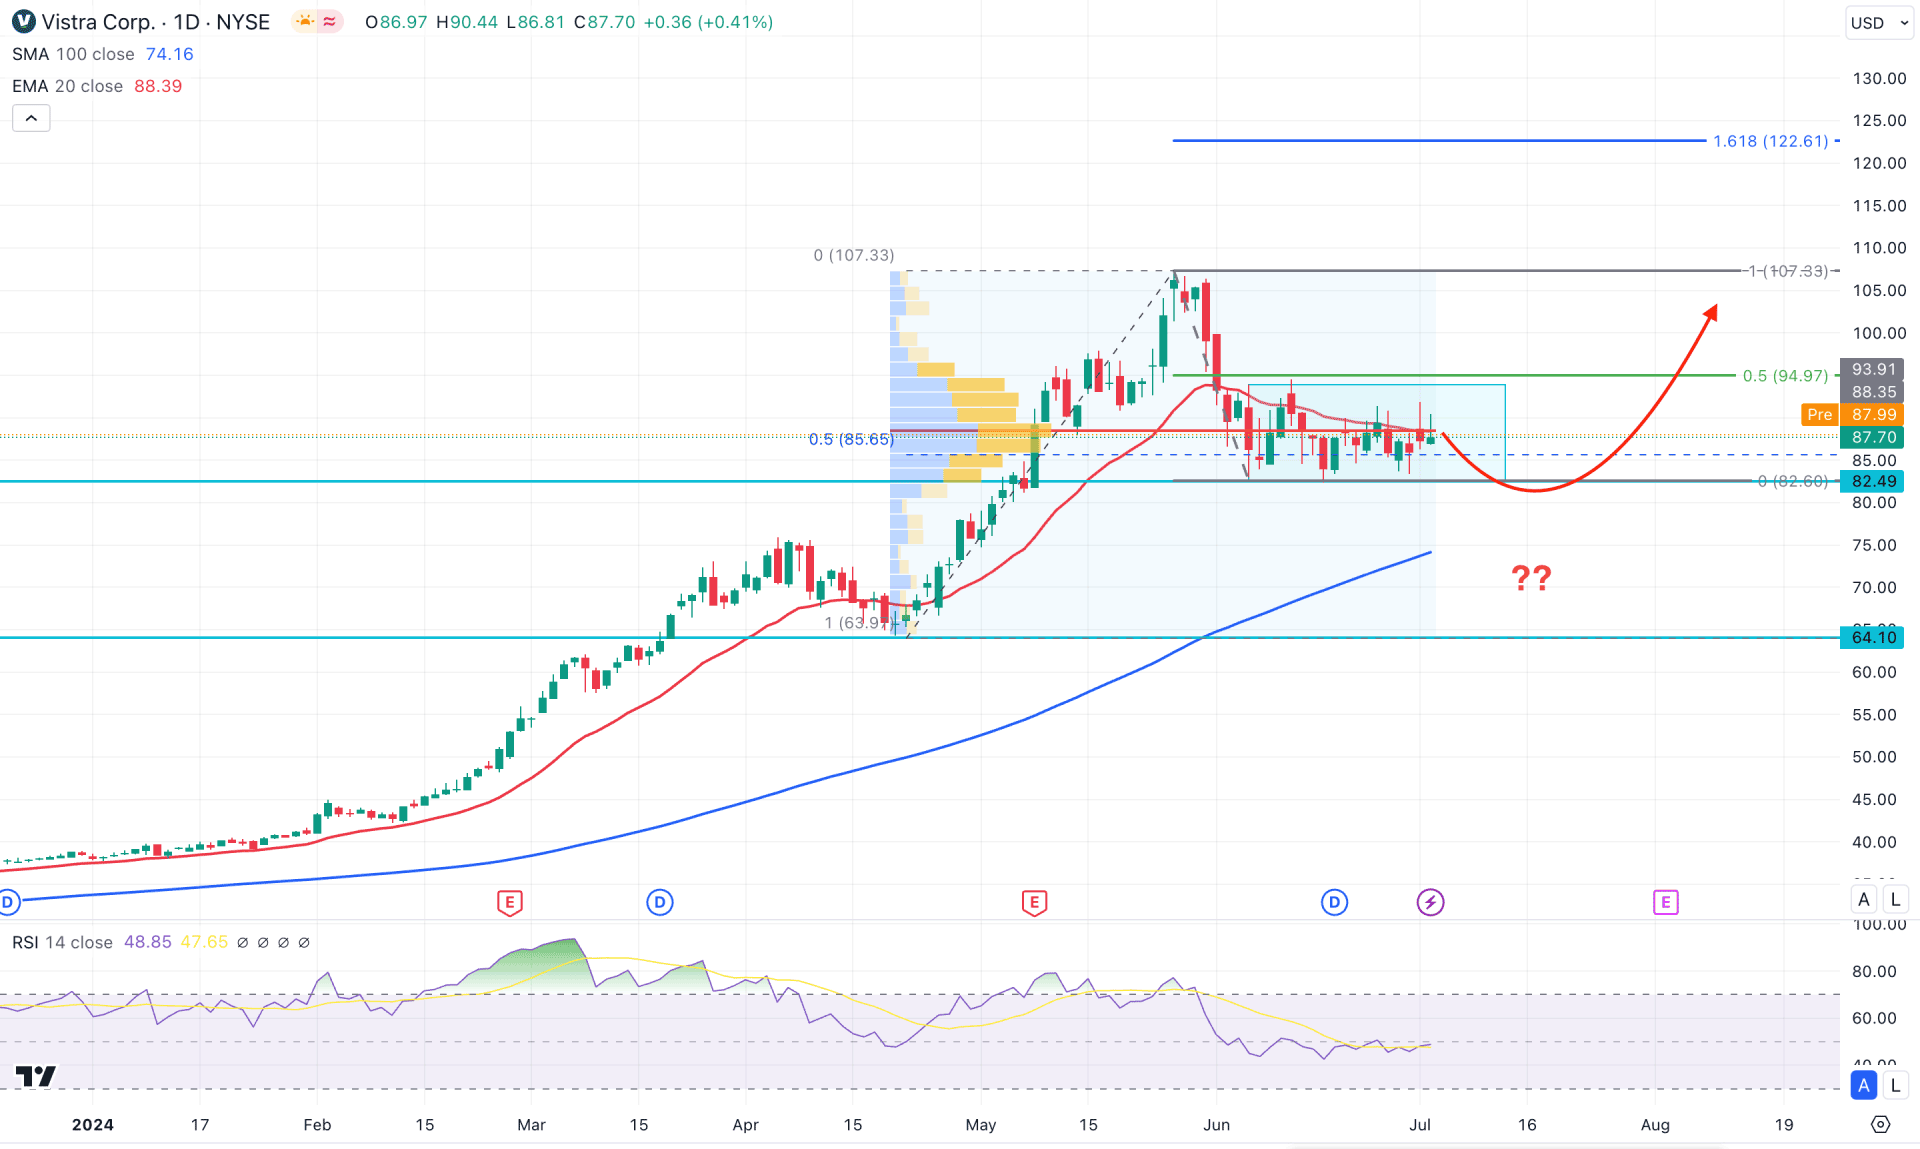
In the volume structure, bulls are still on the positive side, where the current largest activity level since 15 April 2024 is at 88.35 level, which is closer to the current price. In that case, a bullish trend continuation might come once the price overcomes the high volume line with a valid daily close.
In the main chart, the ongoing range bound market suggests an indecisive momentum, where the 100-day Simple Moving Average is the major support. However, multiple violations are seen at the 20-day Exponential Moving Average area, suggesting a need for a breakout.
The indicator window shows the same story, where the Relative Strength Index (RSI) hovers at the 50.00 line.
Based on the ongoing price structure, VST is more likely to extend the buying pressure, where the main aim is to test the 122.61 Fibonacci Extension level. As the ongoing price action is corrective, a downside pressure with a sell-side liquidity sweep from the rectangle support could be a potential long opportunity. Moreover, any immediate buying pressure with a daily close above the 93.91 level could signal a trend continuation without having a retest.
On the bearish side, a failure to hold the price above the dynamic 20-day EMA with a bearish daily candle below the 80.00 psychological level could signal a downward correction towards the 64.10 support level.
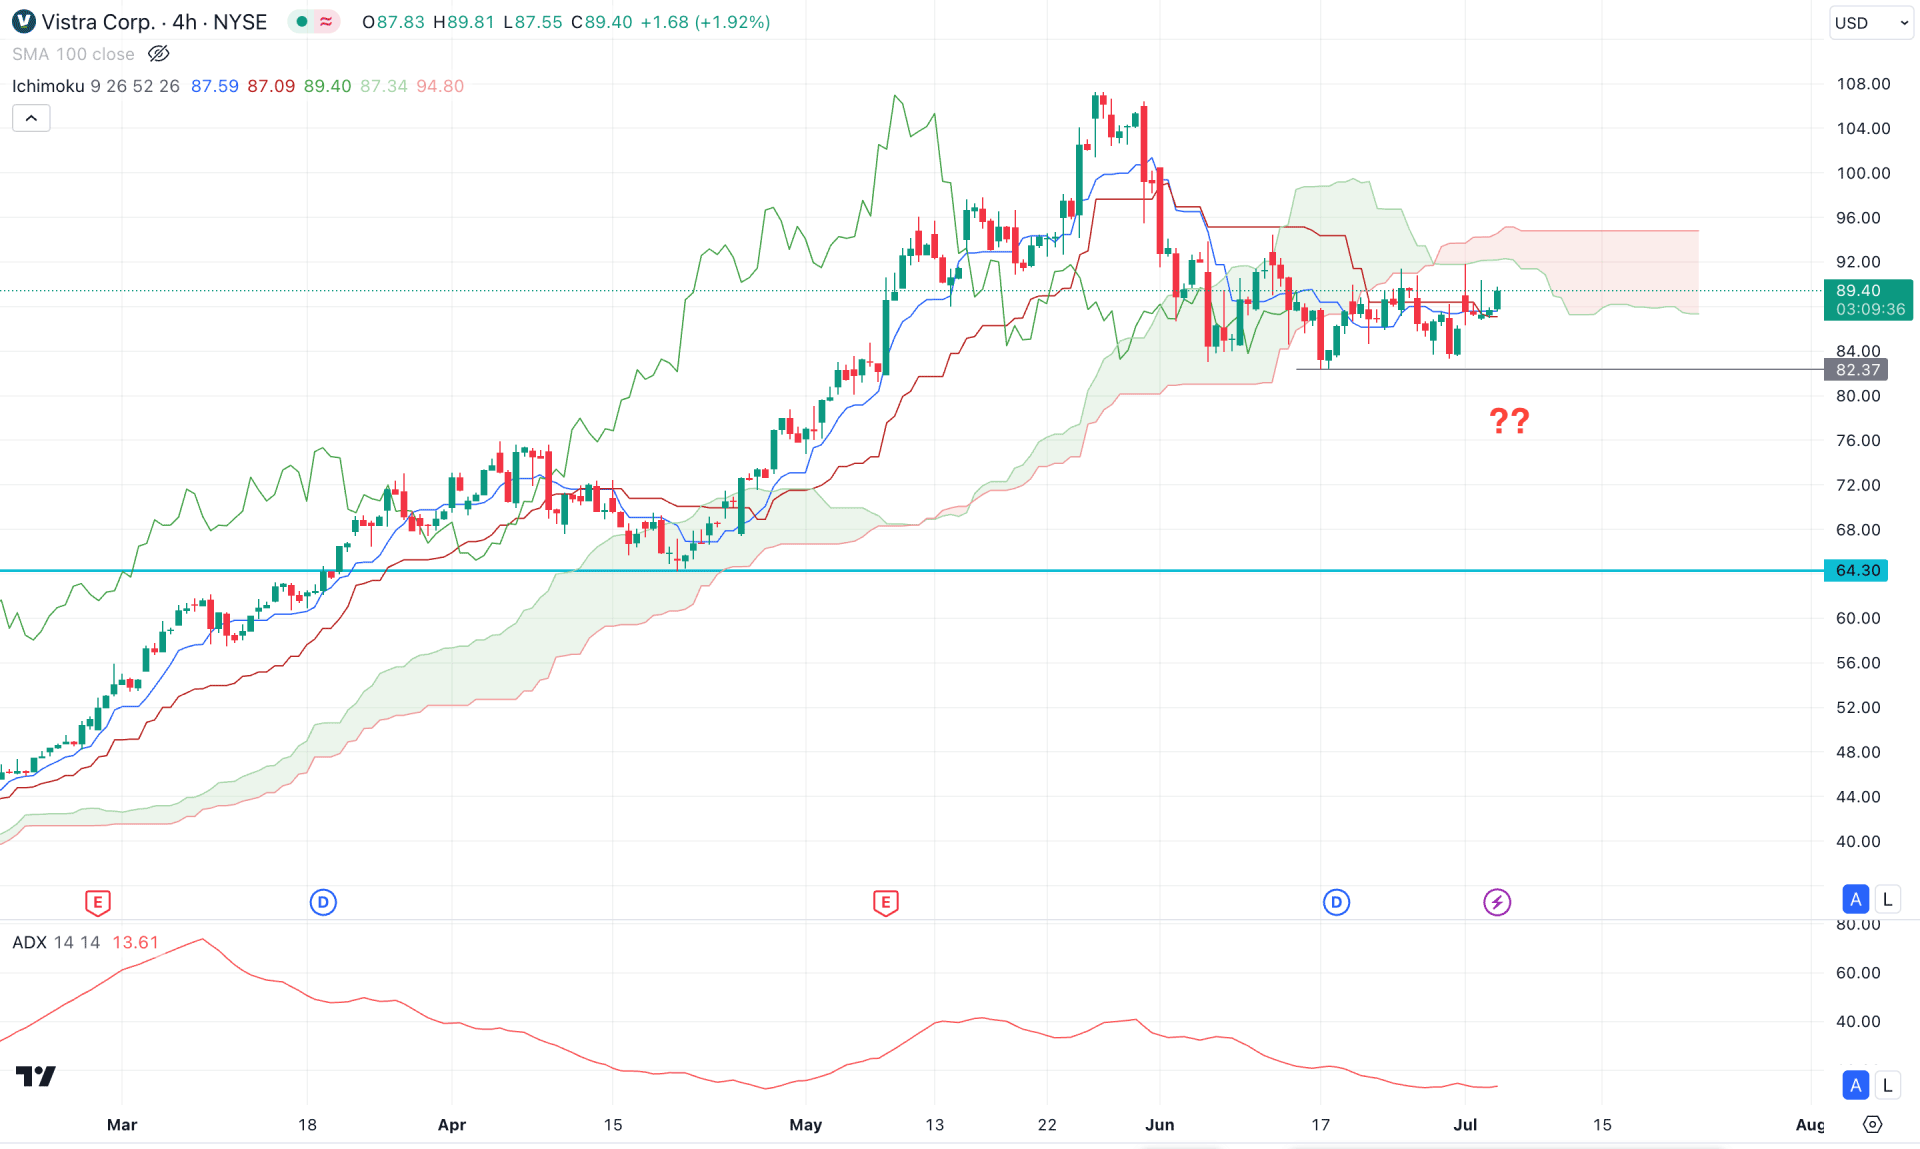
In the H4 timeframe, the recent price shows a corrective pressure below the dynamic Ichimoku Cloud zone, while the future cloud looks bearish.
Moreover, the dynamic Tenkan Sen and Kijun Sen are closer to the current price, suggesting a potential range breakout. Moreover, the Average Directional Index (ADX) moved below the 20.00 satisfactory level, indicating a weaker trend formation.
Based on the H4 structure, a potential Ichimoku Cloud breakout with a stable market above the cloud high could be a bullish continuation signal. In that case, an H4 candle above the 94.00 level could open the possibility of extending the market pressure towards the 108.00 psychological line.
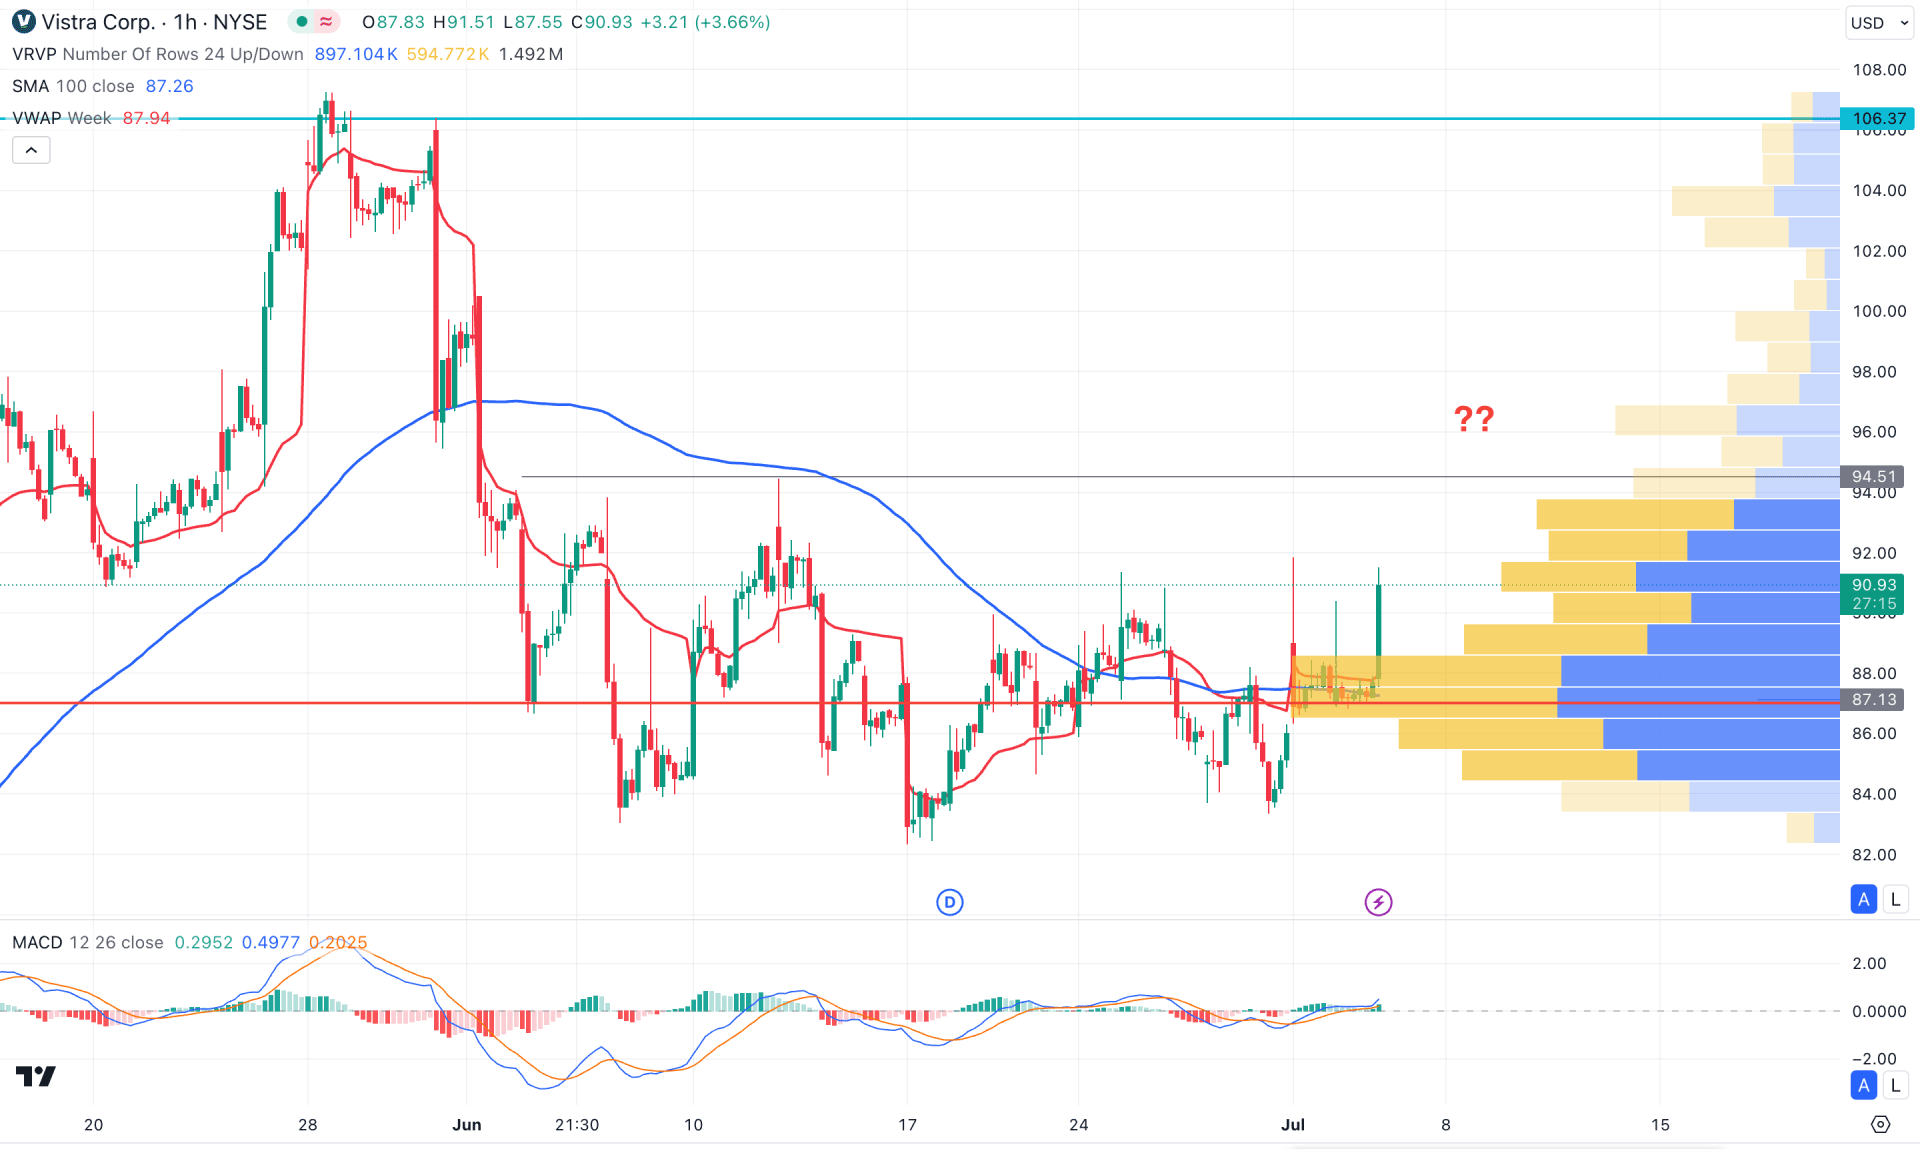
In the hourly chart, the current price trades volatile, with the visible range high volume level below it. Moreover, the dynamic 100 Simple Moving Average moved below the current price, suggesting a potential bullish trend continuation on a medium-term basis.
In the indication window, the current MACD histogram is above the neutral point, while the current histogram is closer.
Based on the current price prediction, the recent price might continue moving higher once a daily candle comes above the near-term resistance level. In that case, the price might extend higher towards the 100.00 psychological level.
On the other hand, a downside continuation is valid as long as the current price trades at the high volume line. A bearish H1 candle below the 84.00 level might take the price down towards the 76.00 zone.
Based on the ongoing price action, VST is more likely to extend the buying pressure once a rectangle breakout appears on the bullish side. Investors should closely monitor the H4 price action from where a bullish range breakout could be an early buying opportunity.


