

Published: July 28th, 2026
Visa stock (V), a global payments processing business, will release its earnings this week, and investors are keen to see how the price reacts from the premium zone.
Visa reported $11.23 billion in sales last quarter, growing 17.1% year over year, exceeding analysts' revenue projections. The company had a very successful quarter, beating both analysts' EPS and EBITDA projections.
The market anticipates that Visa's revenue will increase 11.9% year over year this quarter, which is less than the 14.3% growth it saw in the same period last year.
Over the past 30 days, analysts tracking the company have largely reaffirmed their projections, indicating that they believe the company will continue on its current path going into results.
Some of Visa's competitors in the credit card market have already released their Q2 numbers. Bread Financial exceeded analysts' projections by 3.5% with year-over-year sales growth of 6.9%, and Capital One reported a 25.8% increase in revenues.
Let's see the full outlook from Visa Stock (V) technical analysis:
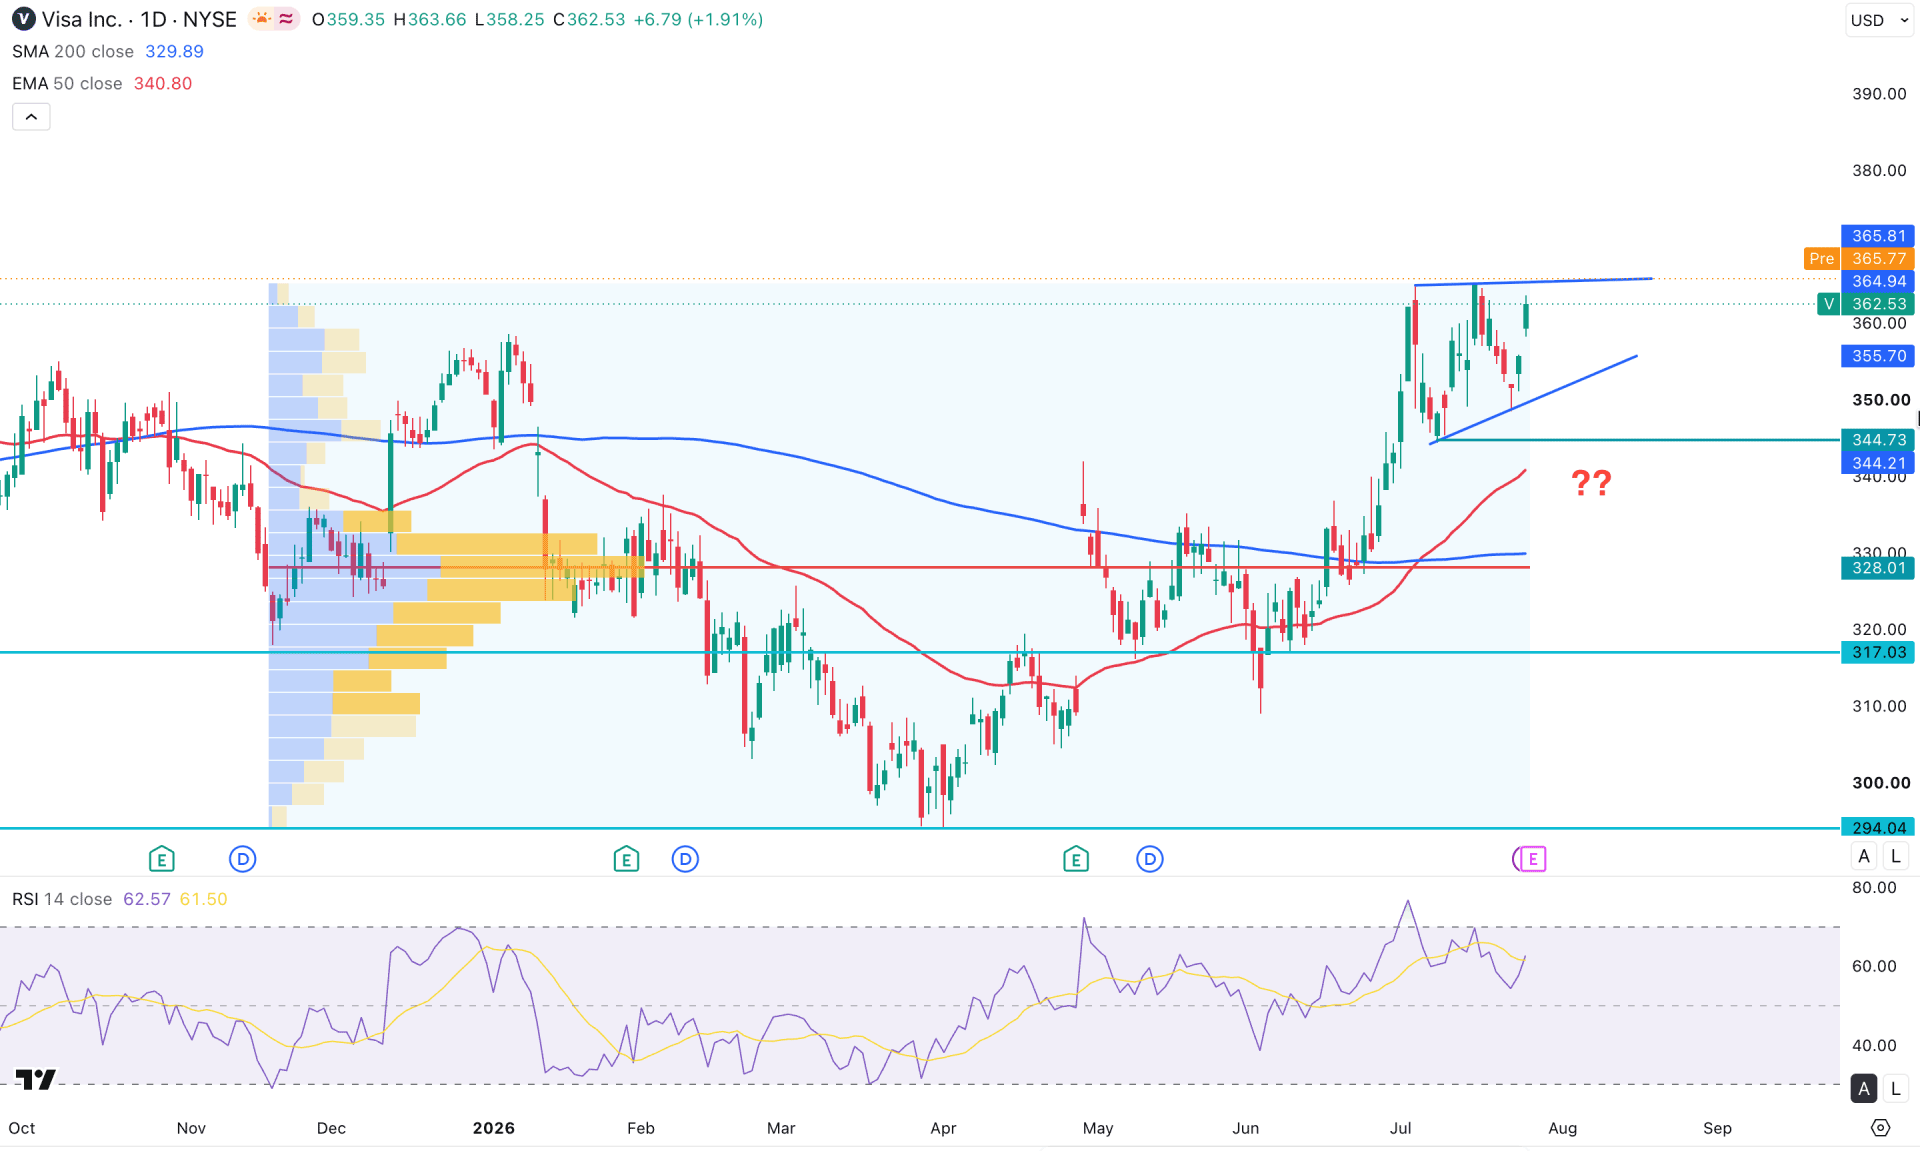
In the daily chart of Visa Stock (V), the ongoing market momentum is bullish as the price has been rising since March 2026 bottom. The current price is trading in the premium zone, from where no significant selling pressure is visible. Primarily, it is a sign of active bullish momentum, from where more bullish pressure could come.
Looking at the higher timeframe, the monthly candle suggests fresh bullish momentum within an impulsive pattern, from where more bullish pressure is possible. The weekly chart shows the same story, as a V-shaped bullish recovery is visible, creating a new swing high. However, the price is trading in the premium zone, from where a moderate bearish correction is possible.
In terms of the volume structure, the most active level since November 2025 is marked at the 328.01 level, which is below the current price. As the existing momentum is above the high-volume line, a minor correction is possible even if the market momentum remains bullish.
A bullish crossover is clear, where the 50-day EMA is moving above the 200-day SMA, creating a Golden Cross formation. Moreover, the entire price action is above these dynamic lines, signaling bullish momentum.
In the indicator window, the Relative Strength Index reached above the 70.00 level and then moved lower. However, the current line is still above the 50.00 neutral level, which signals bullish momentum.
Based on the overall market structure, Visa stock is trading in the premium zone, from where a decent correction is pending. The immediate support level is at 344.73, which is a crucial area to watch. As long as the price remains above this level, there is a higher possibility of breaking the existing all-time high and moving beyond the 400.00 psychological level.
On the other hand, multiple barriers are present below the current price, which might make the bullish recovery challenging. A break below the 344.73 level could be the first sign of a possible downside move, which could be tested at the 317.03 support level. However, breaking below these two levels could be an alarming sign for buyers and may create a new swing low below the 294.04 support level.
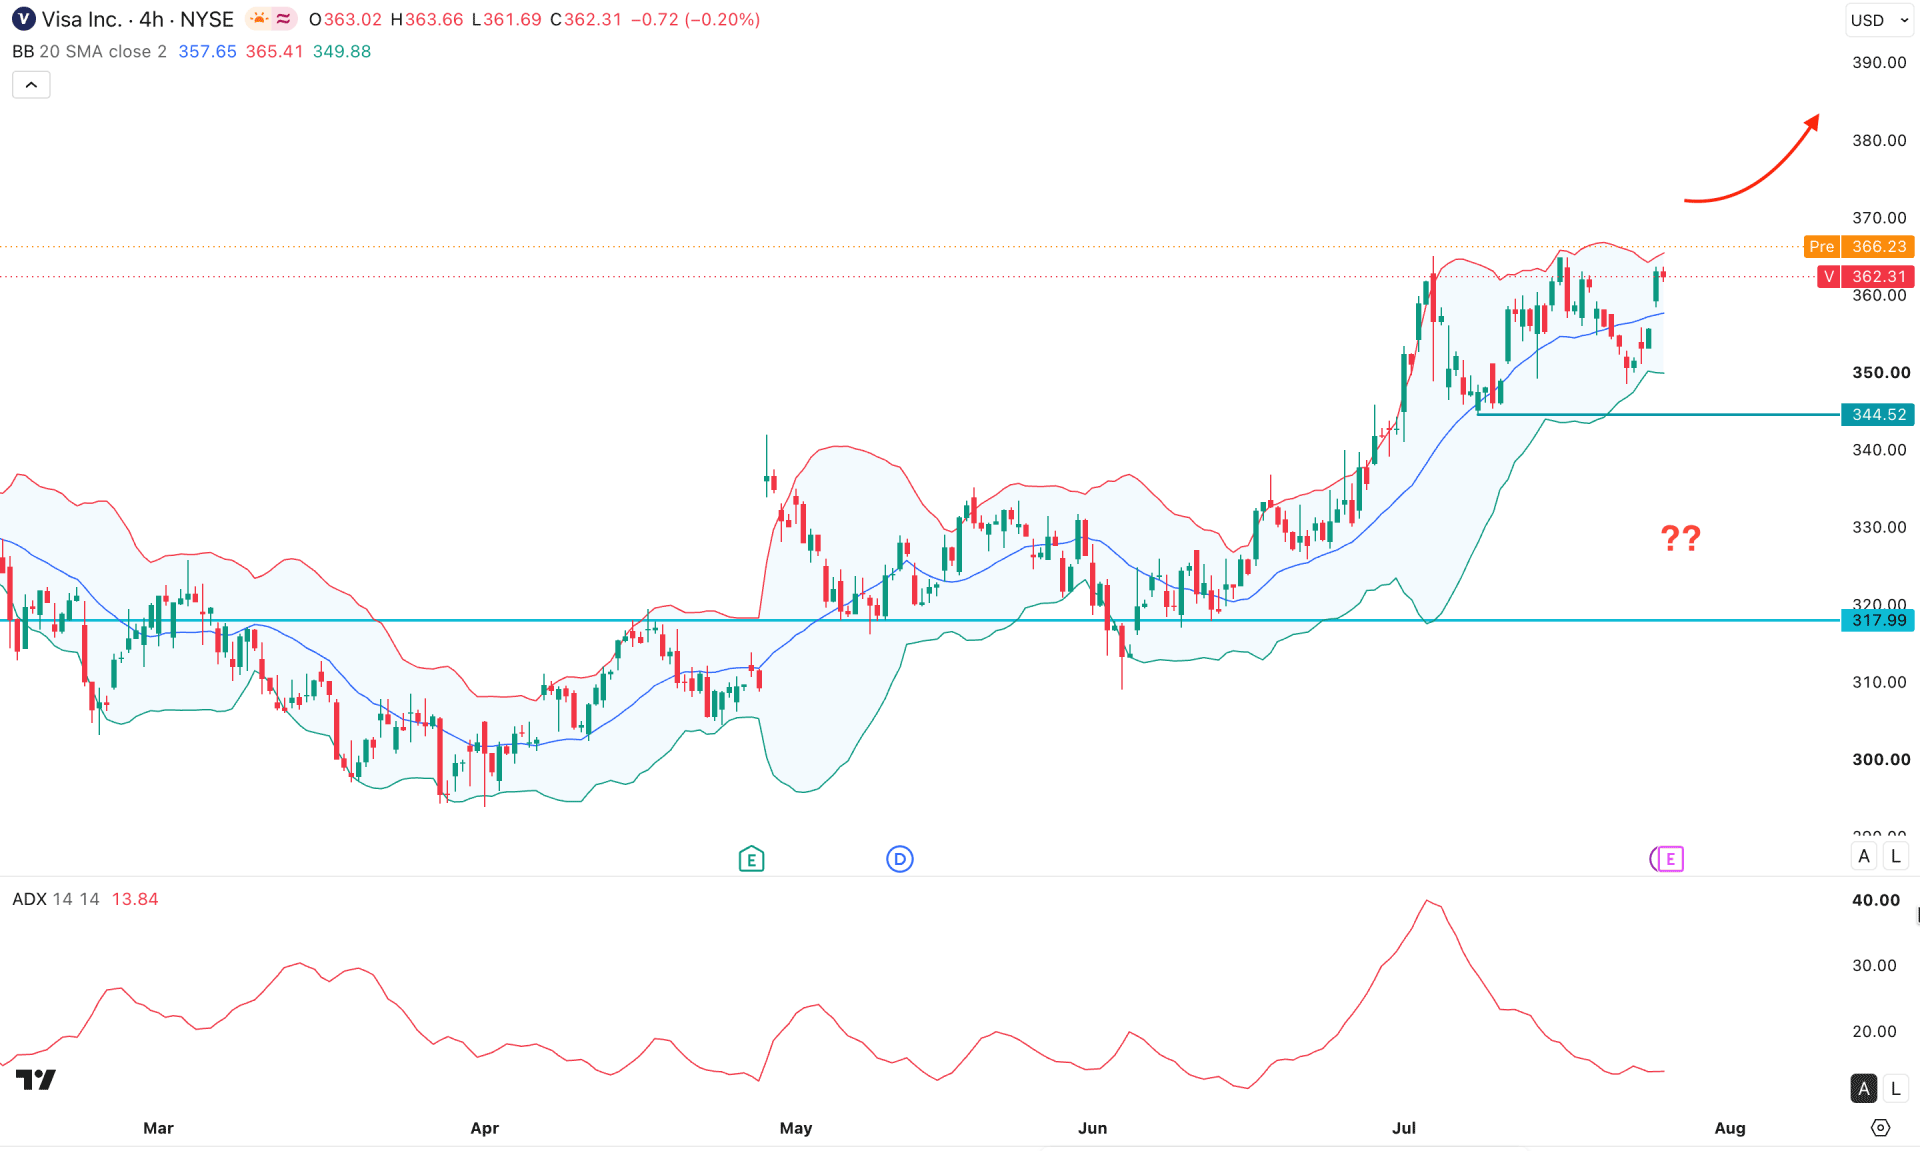
In the four-hour timeframe, the recent price is trading sideways after creating a peak at the 364.96 level. The current price action is bullish, with a valid rebound from the mid Bollinger Band support, which signals further bullish continuation.
In the main price chart, a valid recovery is visible, where the Bollinger Bands act as a crucial resistance to watch. As the price has open space above the existing swing high, a valid breakout could resume the existing trend at any time.
On the other hand, the indicator window shows a different story, where the Average Directional Index is below the 20.00 threshold. It is a sign of corrective market momentum, and a rebound above the 20.00 level is needed before anticipating a trend trading opportunity.
Based on the current market outlook, a bullish continuation is possible as long as the price remains above the 344.52 key support level. Overcoming the immediate resistance at 364.96 could open the room for reaching 390.00.
On the other hand, an immediate break below the 344.52 level could grab liquidity from the 340.00 area and extend toward the 317.99 area. From there, a recovery above the mid Bollinger reference line could offer another long signal.
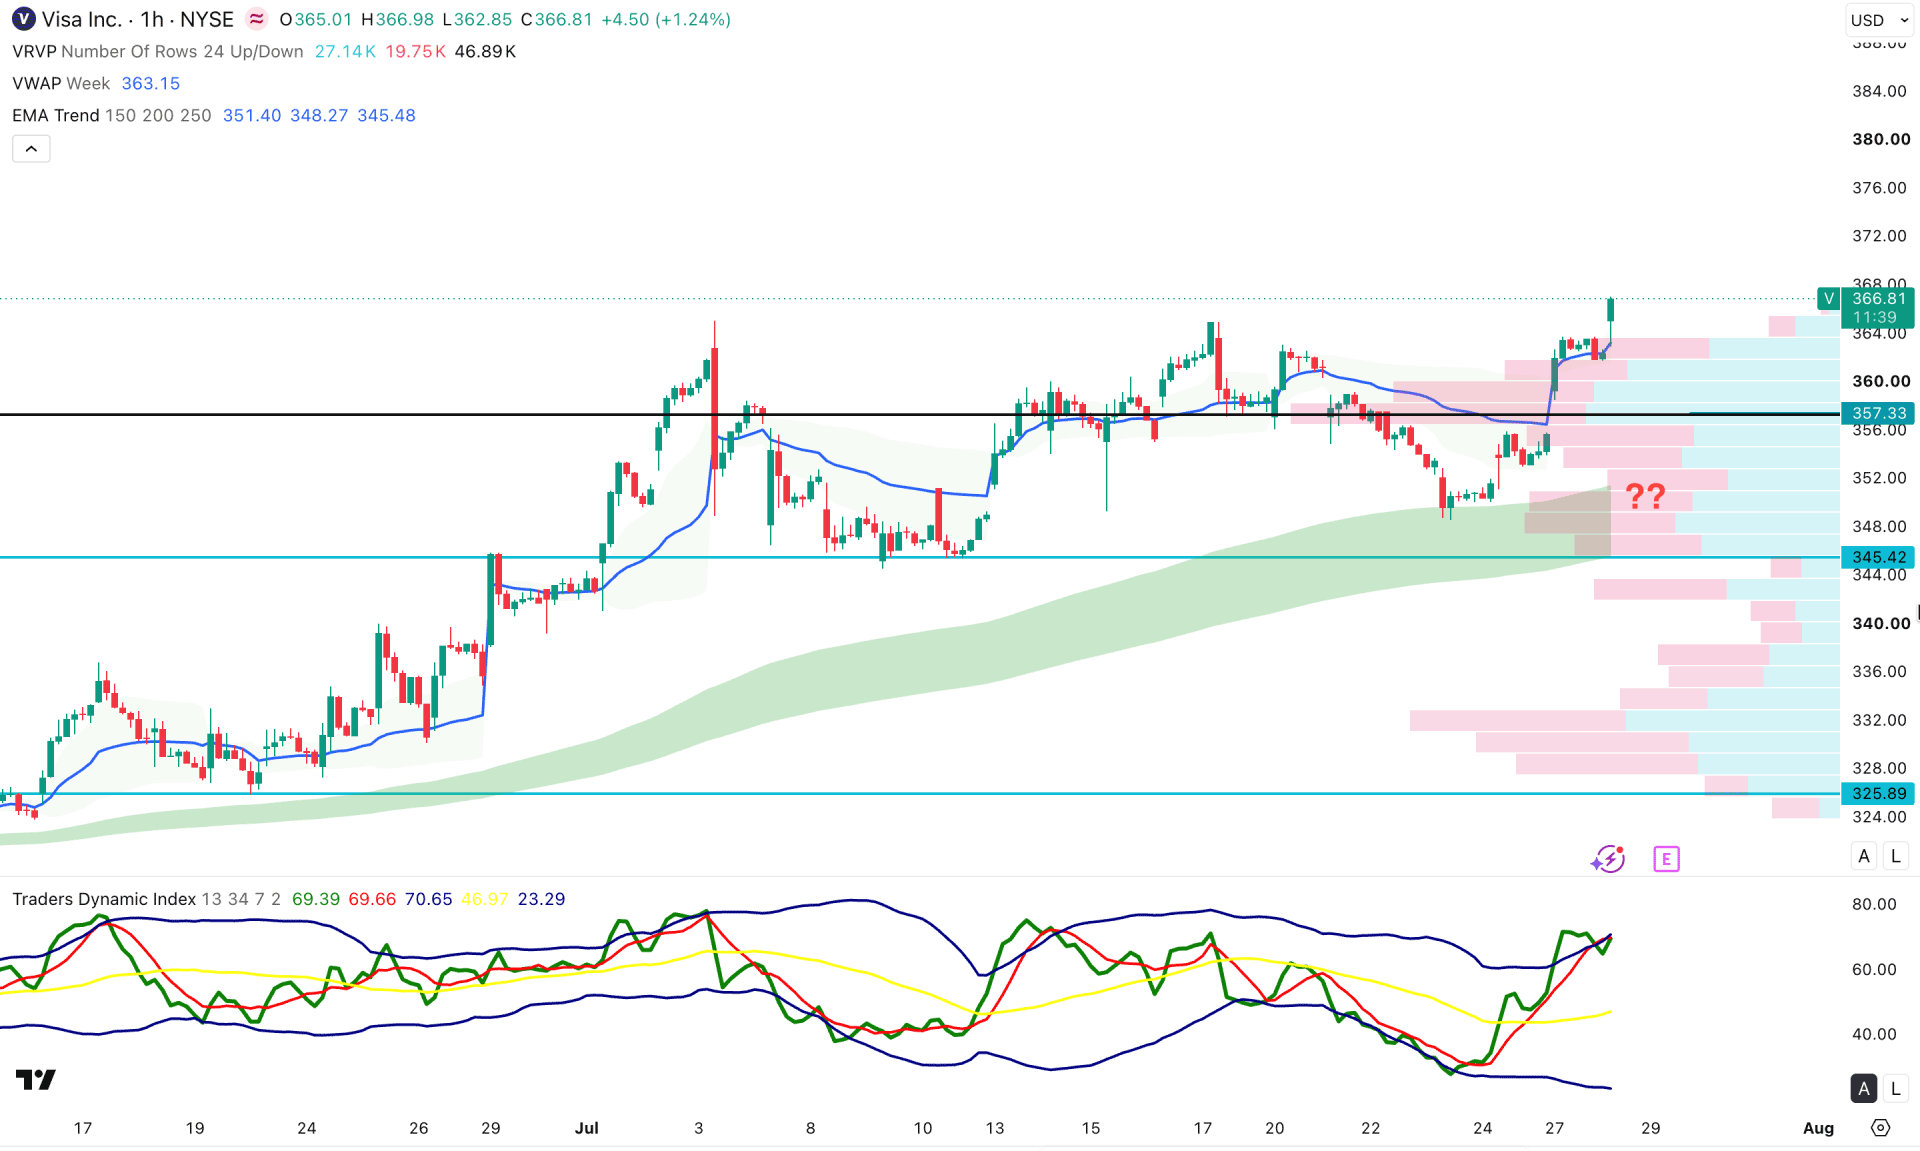
In the hourly timeframe, Visa stock is trading higher following a sharp recovery to the EMA wave area. A bullish rebound is evident, as the current price is hovering above the weekly VWAP support level.
The volume structure shows that buying pressure is holding, as the most active level is at 357.33, which is below the current price.
The indicator window shows a similar story, with the current price near the overbought level, suggesting that a decent downside correction is possible. The Traders Dynamic Index is positioned at the upper peak area, which signals an extreme bullish condition. However, the buying pressure remains valid as long as the TDI level stays above the 50.00 neutral area.
Based on the overall market structure, Visa stock is trading with bullish momentum, and continuation is highly possible. Investors should closely monitor how the price retraces lower, as a valid rebound from the near-term support area could signal trend continuation.
Based on the overall market structure, Visa stock is trading in the premium zone, where further upside pressure may require additional confirmation from fundamental releases. The earnings projection is strong, and a better-than-expected result could create a bullish range breakout to validate long-term trend continuation.


