
Published: October 17th, 2023
In anticipation of Visa’s earnings report, Visa stock (V) intends to highlight its robust performance. The anticipated financial results demonstrate a significant 15.54% rise in earnings per share to $2.23 for the corresponding quarter from the previous year.
Analysts forecast an annual revenue of $32.59 billion and earnings per share of $8.65, considering the organization as a whole. The estimates above indicate annual growth of 15.33% and 11.2%, in contrast to the preceding year.
It is advisable for investors to closely monitor recent modifications in analyst projections for Visa, as these revisions offer valuable insights into the fluidity of immediate business trends. Positive estimate revisions may be perceived as a positive indication regarding the organization's business prospects.
Visa is currently valued at 27.17 forward price to earnings (P/E), which signifies a premium compared to the industry average of 13.68 P/E for forward pricing.
In addition, Visa's PEG ratio, which incorporates the anticipated earnings growth rate alongside the conventional P/E ratio, is currently 1.77. On the contrary, the Financial Transaction Services industry upheld a mean PEG ratio of 1.19 as of yesterday's close of trading.
Should you buy the Visa Stock (V) now? Let’s see the complete outlook from the Visa technical analysis:
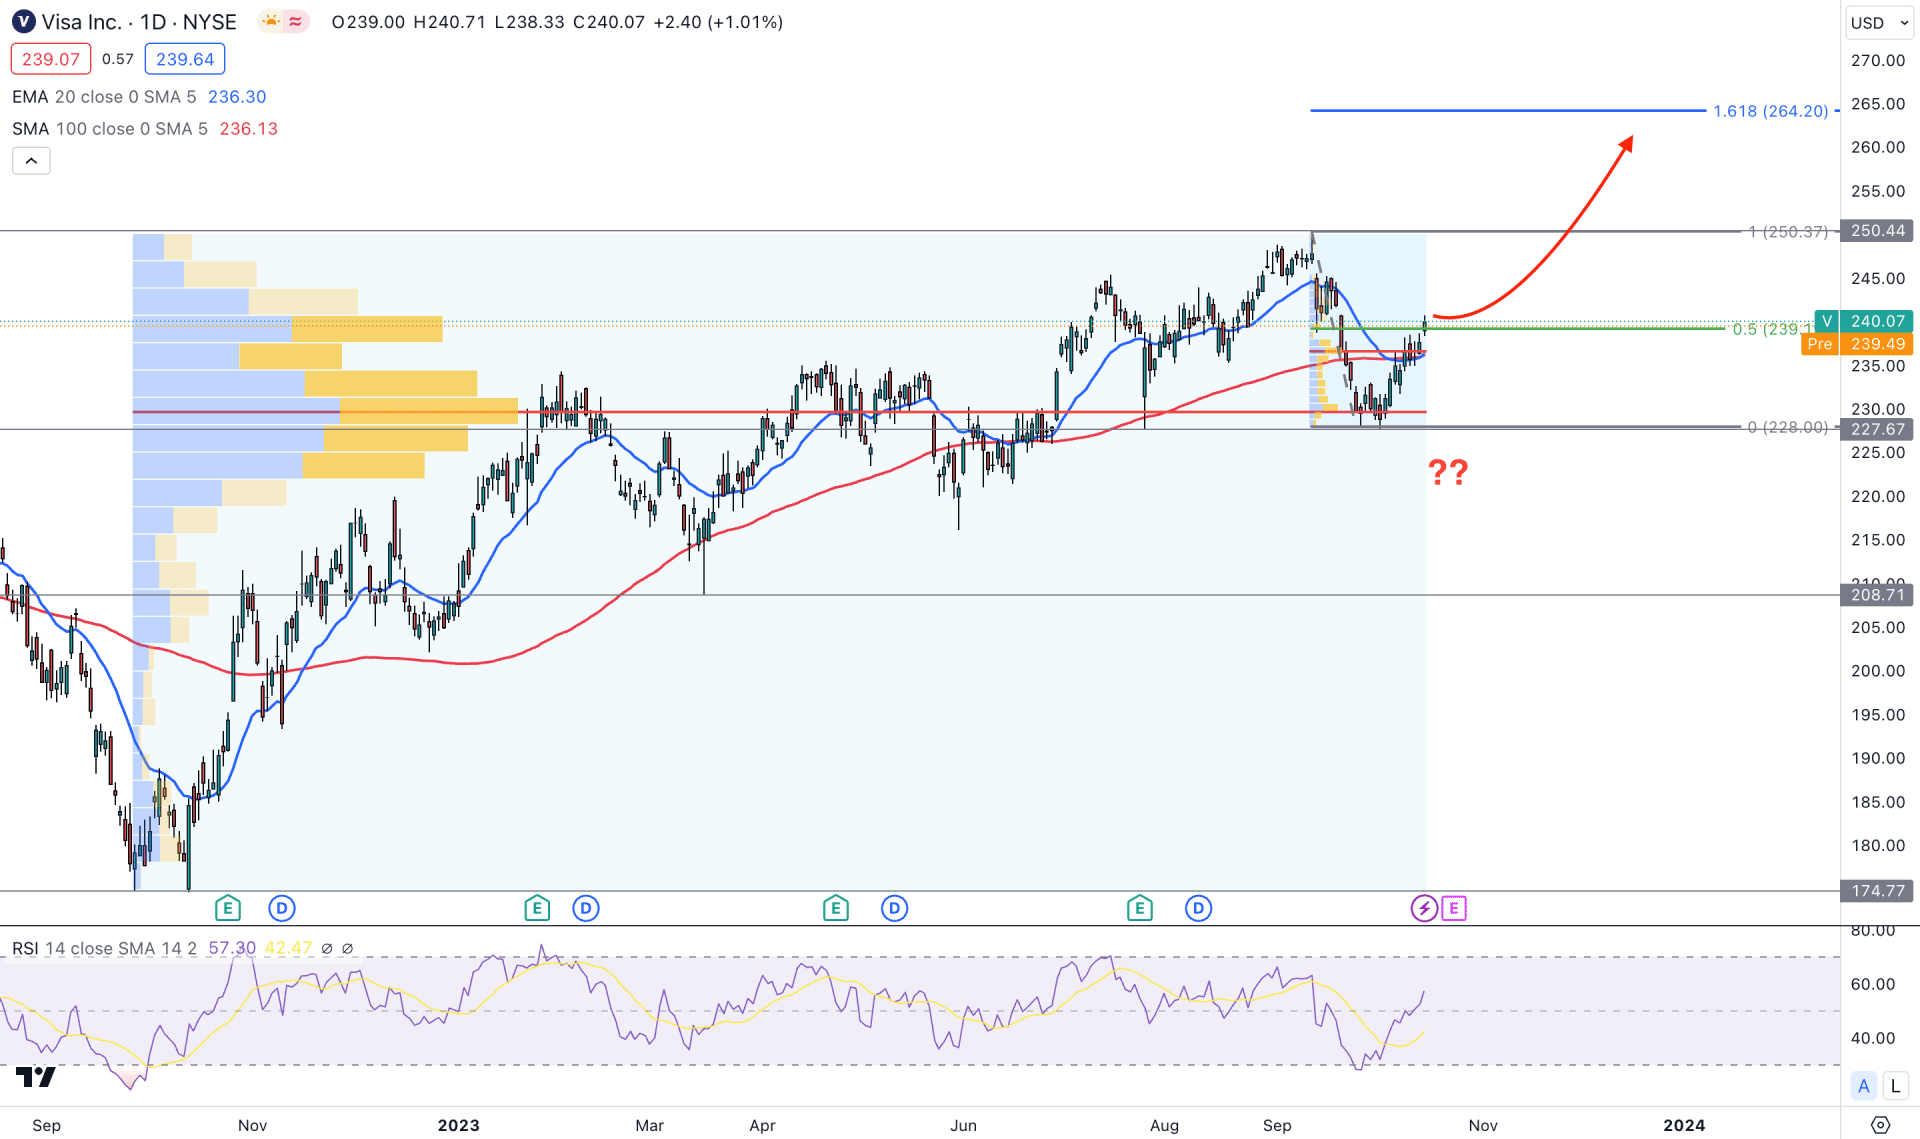
In the Visa stock (V) daily chart, the broader market direction is bullish as the recent price shows new higher high formations. However, the earnings report is set to be released in the next week, where a fundamental push could make a new high above the 250.44 resistance level.
In the higher timeframe, the current bullish pressure is questionable from the recent bearish monthly close, where the current price is just above the 50% level. A bullish two-bar reversal from a significant static level in the weekly chart backs the current weekly candle. Overall, the weekly outlook relies on the bullish side.
In the daily chart, the 100-day Simple Moving Average is the major support, where the current price remains stable above it. Moreover, the dynamic 20-day EMA reaches the 100 SMA level with a daily candle above it, a sign of a bullish trend continuation.
In the volume structure, the highest trading volume level since the September 2022 low is at 229.55 level, which is just below the current price. Another high volume level from the 11 September 2023 high is below the current price, indicating an active buying pressure in the market.
In the secondary window, the 14-day RSI shows a bullish continuation possibility, which can extend towards the 70.00 line.
In the daily price outlook, the current bullish continuation is solid as the price trades above critical high volume levels. In that case, the upward pressure is more likely to extend toward the 161.8% Fibonacci Extension level at the 264.20 area. On the other hand, a bearish selling pressure with a daily candle below the 227.00 level could extend the bearish pressure toward the 208.71 support level.
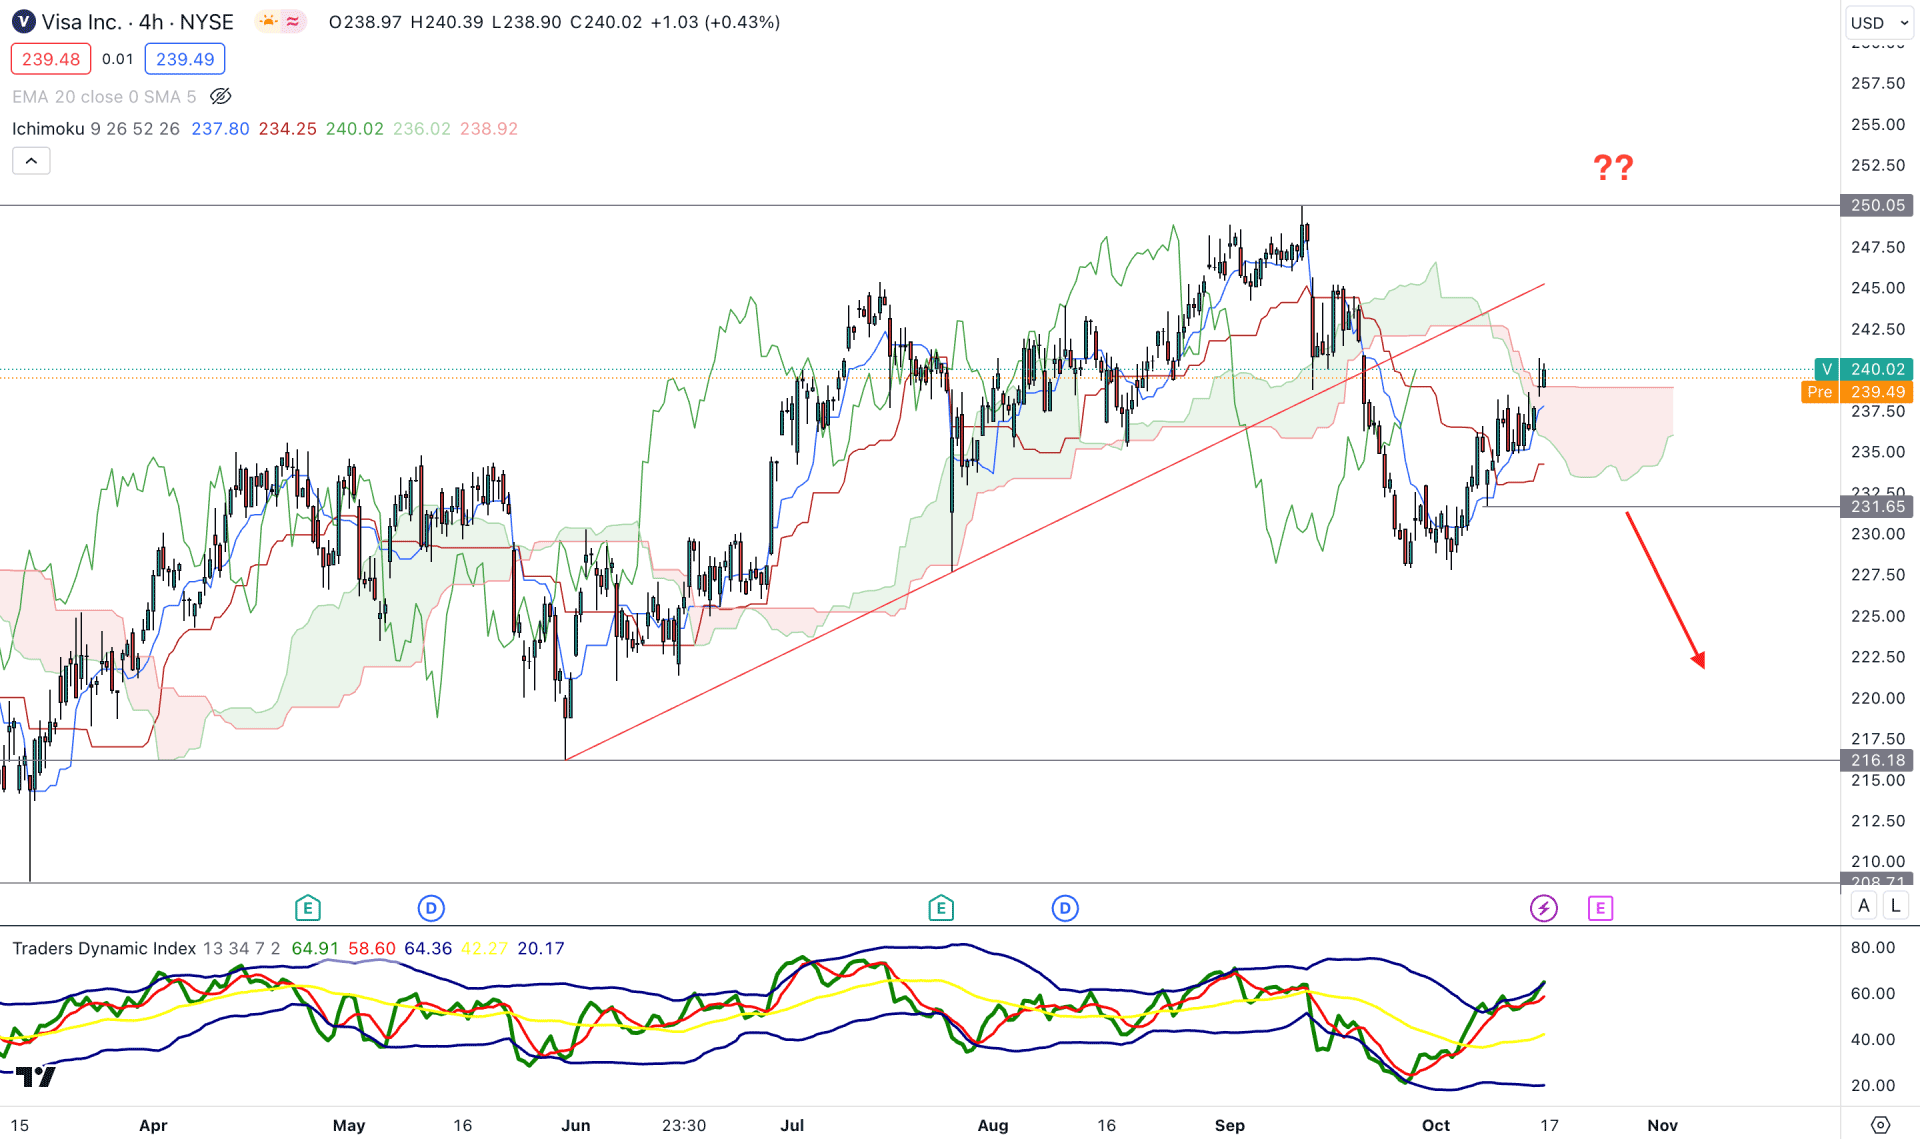
In the H4 timeframe, the current price trades at the Ichimoku cloud area, which came after a strong selling pressure below the trend line support. Moreover, the existing market trend is bullish, which could end up with a strong bullish reversal at any time.
In the secondary window, the current Traders Dynamic Index (TDI) reaches the overbought area, which indicates a short-term bearish opportunity.
Based on the overall market outlook, a strong bullish reversal with an H4 candle above the 250.00 level could be a strong bullish opportunity targeting the 300.00 level.
On the other hand, a bearish price action below the 231.00 level could indicate a bearish continuation, targeting the 216.18 support level.
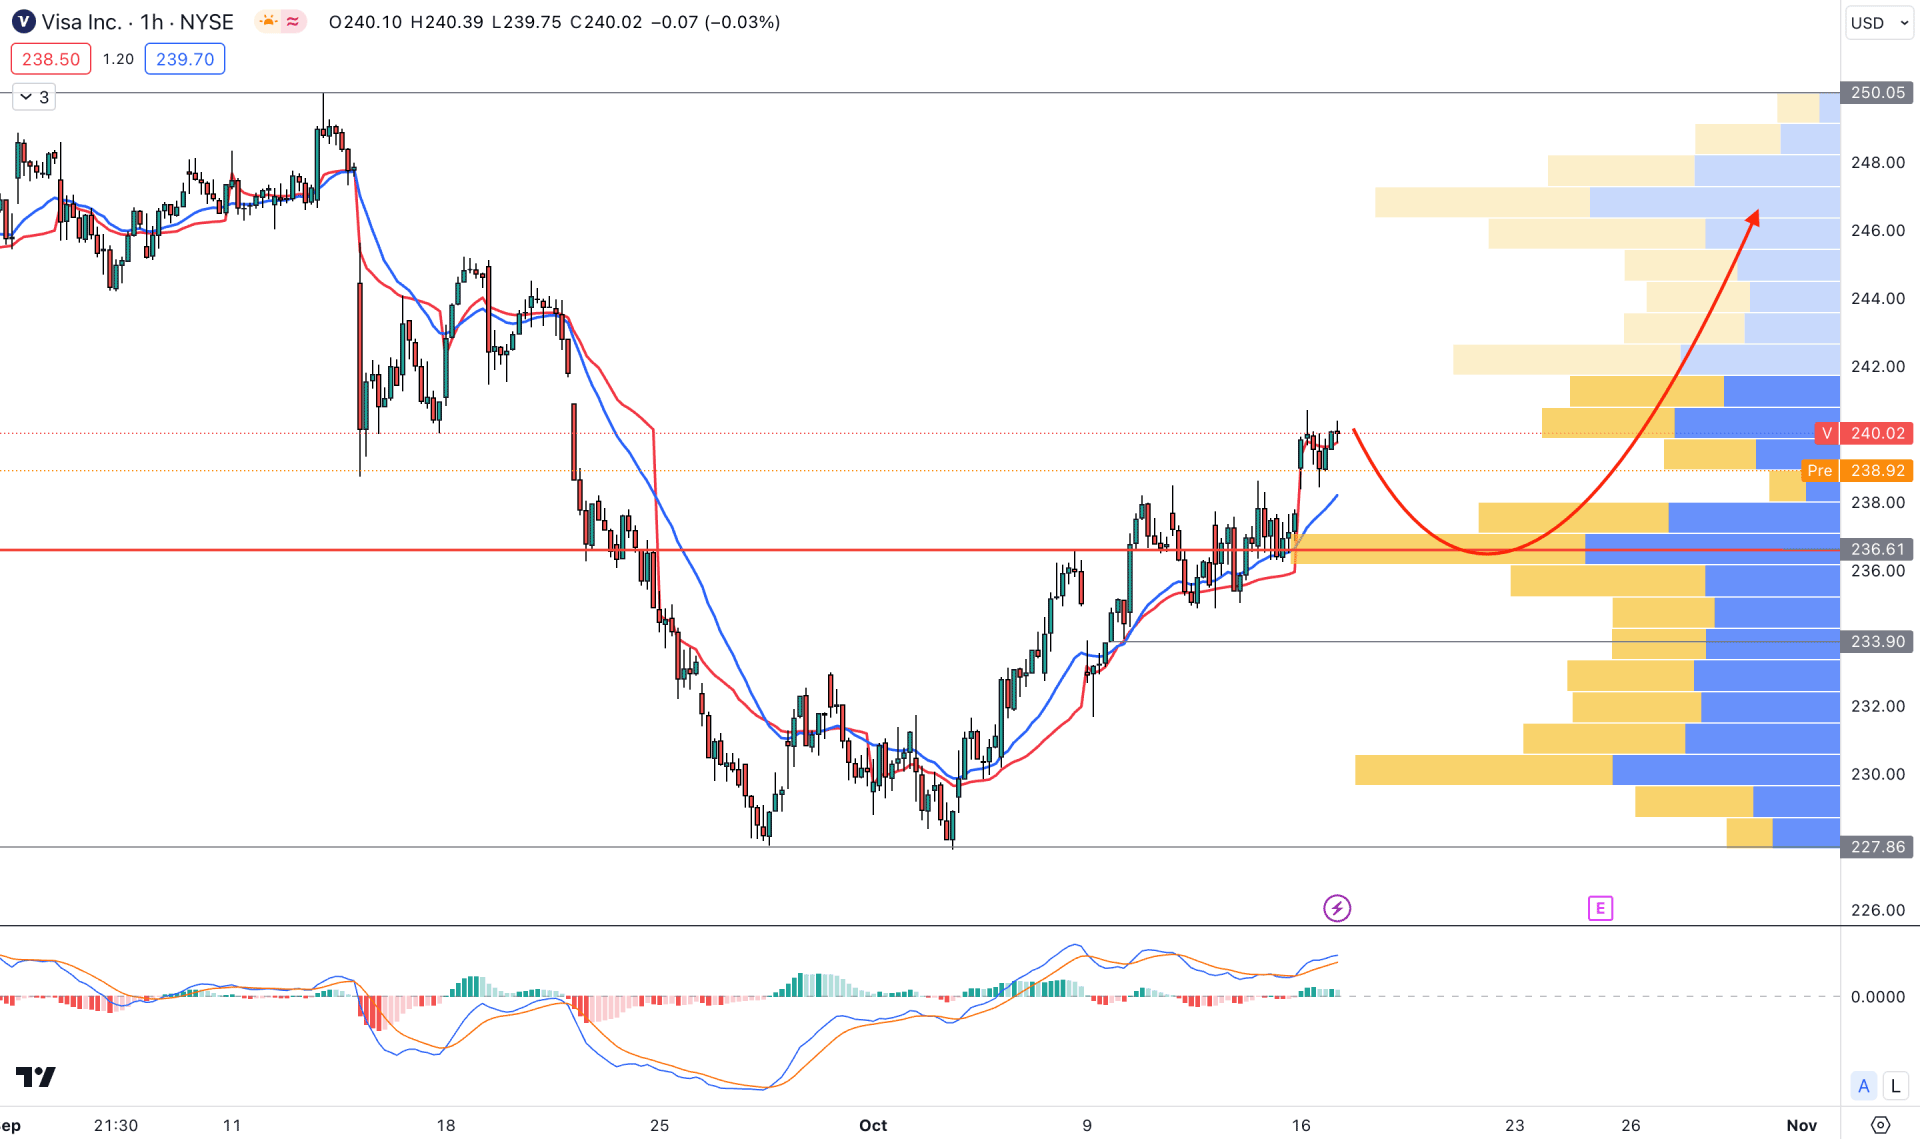
In the H1 timeframe, the overall market pressure is bullish as the visible range high volume level is below the current price.
In the secondary window, the current, MACD signal line is above the neutral level with a positive Histogram. It is a sign that the overall market pressure is bullish, which can extend the momentum in the coming days.
Based on the H1 structure, a bearish pressure with a bullish reversal from the dynamic support level could be a long opportunity, targeting the 250.00 resistance level. On the other hand, a deeper discount is possible towards the 233.90 support level but a bearish H1 candle below the 227.86 level could be a short opportunity for this stock.
Based on the current market outlook, the overall momentum is bullish where a bullish reversal from the intraday support level could offer a high probable trading opportunity. However, a strong bearish reversal in the intraday H1 candle could be a short opportunity for this stock.


