

Published: July 23rd, 2026
Venice Token (VVV) has discovered a new catalyst following weeks of profit-taking. Following Venice's announcement of a new revenue-backed repurchase architecture that explicitly links API membership growth to recurrent token burns, the token saw a more than 12% increase. The development, with positive price action has caused the market to once again focus on whether the VVV coin is getting ready for another bullish rise.
The most recent upgrade represents one of the biggest tokenomics modifications since the project's inception. The new mechanism scales with company activity, enabling token demand to increase in tandem with API usage.
Venice acknowledged that a specialised burn dashboard will be used to monitor API-funded burning in order to increase transparency. To accommodate ecosystem growth while upholding its updated value-accrual methodology, the protocol additionally increased the SDIEM production limit from 38,000 to 40,000 tokens. The modifications improve the relationship between token economics and Venice's commercial expansion.
Moreover, the next stage of VVV will depend on whether the market recognises the protocol's updated value-accrual model or not. The recovery story would be validated with a verified breakout from the current price pattern.
Let's see the full outlook from the VVV/USDT price analysis:
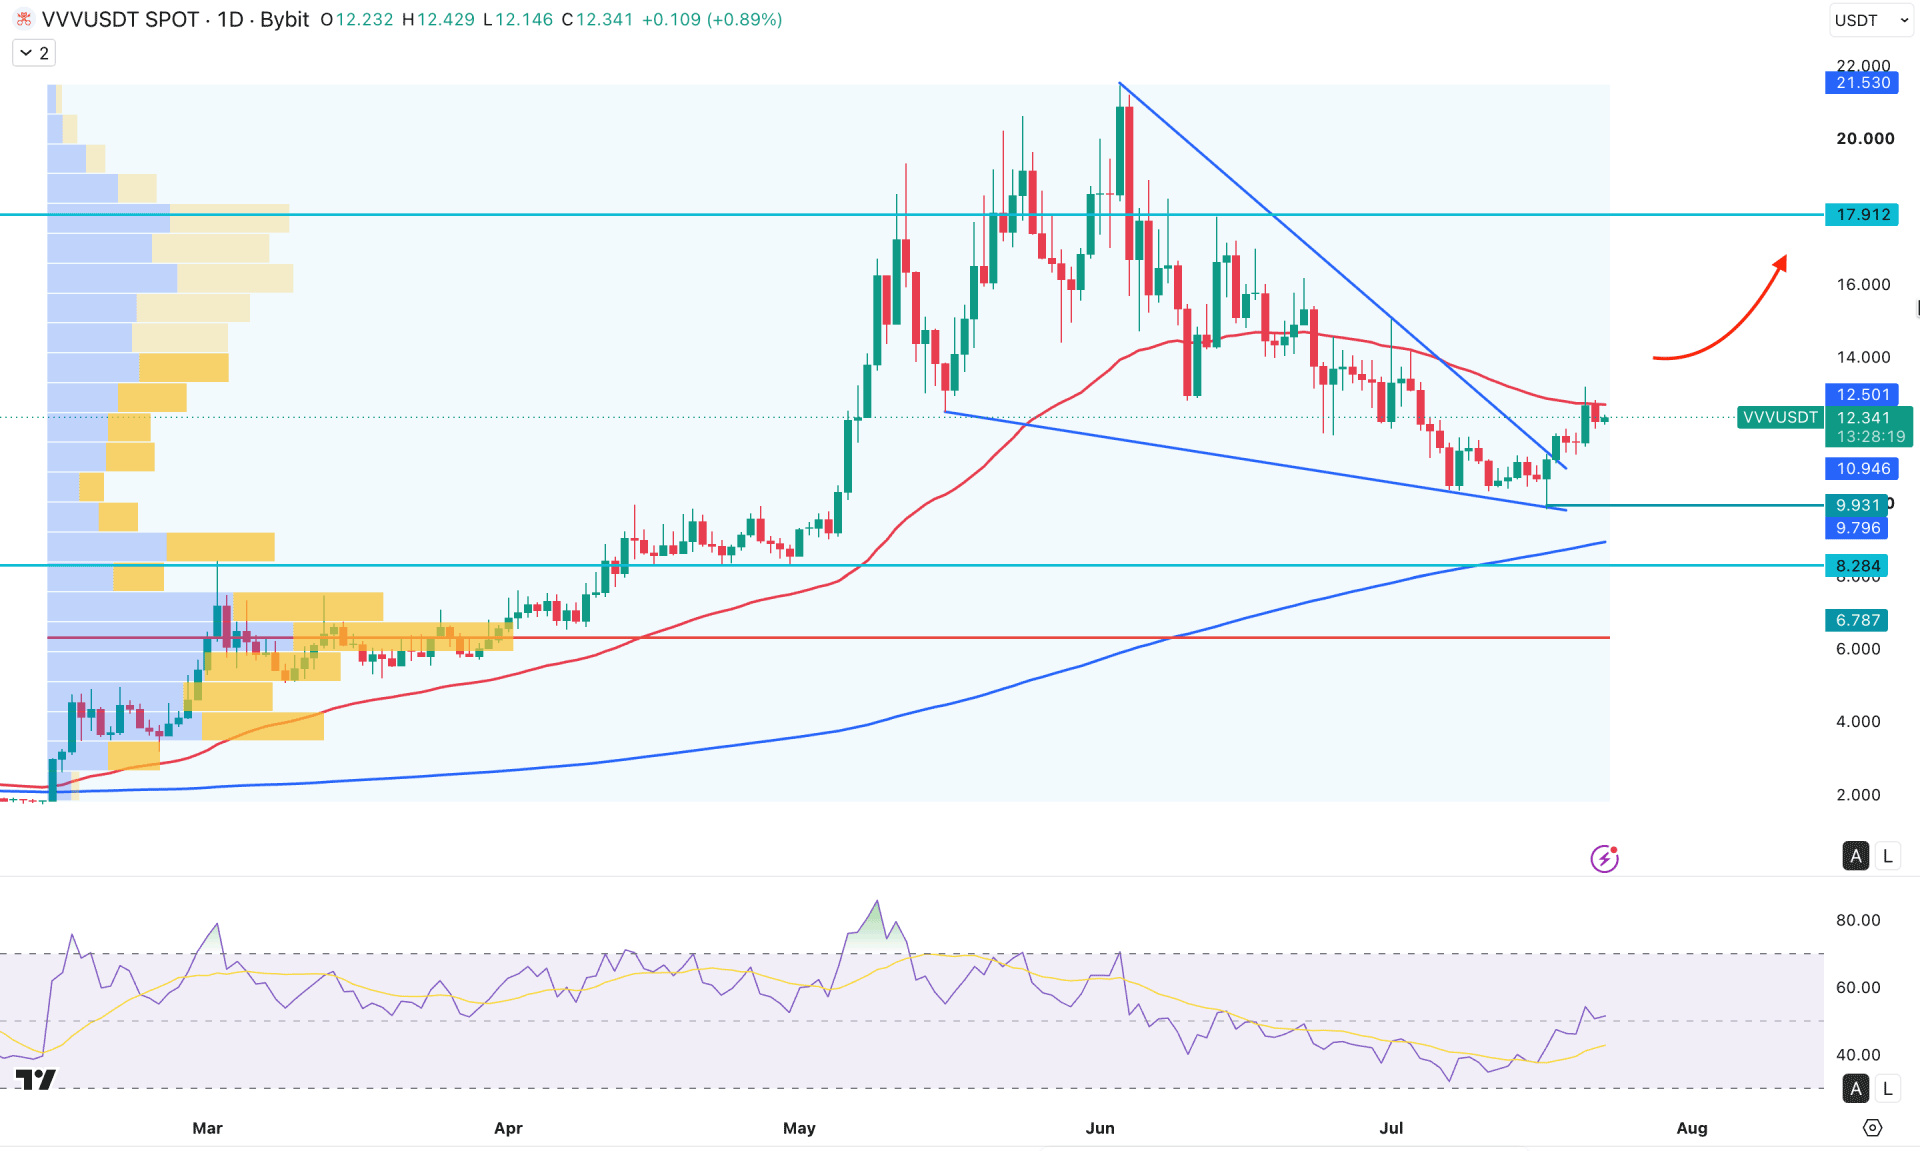
In the daily chart, VVV/USDT is trading bearish after forming a bullish wave, creating an all-time high level at 21.5311. An extended downside correction is visible from the top but that momentum is fading, and a bullish rebound is highly possible.
The monthly timeframe suggests a clear pump and dump, even if the existing monthly candle remains an inside bar. The massive gain with a rebound sweeping the liquidity above the previous high is a clear sign of a potential reversal, which needs confirmation from the lower timeframe. The weekly timeframe shows four consecutive bearish weeks followed by two consecutive recovery. As the price moves lower with corrective momentum, investors should monitor the speed of the rebound from the current price area.
In terms of volume structure, the price is still supportive of buyers, even though downside pressure is visible from the all-time high. Considering the volume activity since February 2025, no significant high-volume selling pressure is seen compared to the high-volume buying pressure at the 6.787 area. It is a sign of active buying interest in the market that can resume the existing bullish trend at any time.
In the main price action, the 200-day SMA is below the current price and is working as a major support above the 9.796 level. As long as the entire structure remains above this crucial dynamic support, the main bias would be for long trades only.
On the other hand, the medium-term market momentum is bearish, where the 50 day EMA is closer to the current price and is working as immediate resistance. After forming a bearish rebound from the 50-day EMA, the price is testing this line for the second time in a row.
The Relative Strength Index shows a corrective structure, where a rebound from the 30.00 oversold level is clear, with more room for upward movement.
Based on the current market outlook, a bullish recovery above the 50-day EMA could offer a decent long opportunity, targeting the 17.91 resistance level.
On the other hand, a deeper correction is possible as a retest from the bullish pennant breakout is pending. In that case, the price may test the 9.931 support level before forming a bullish rebound. However, a failure to hold above the 200-day SMA could resume the ongoing selling pressure and test the 6.000 psychological level.
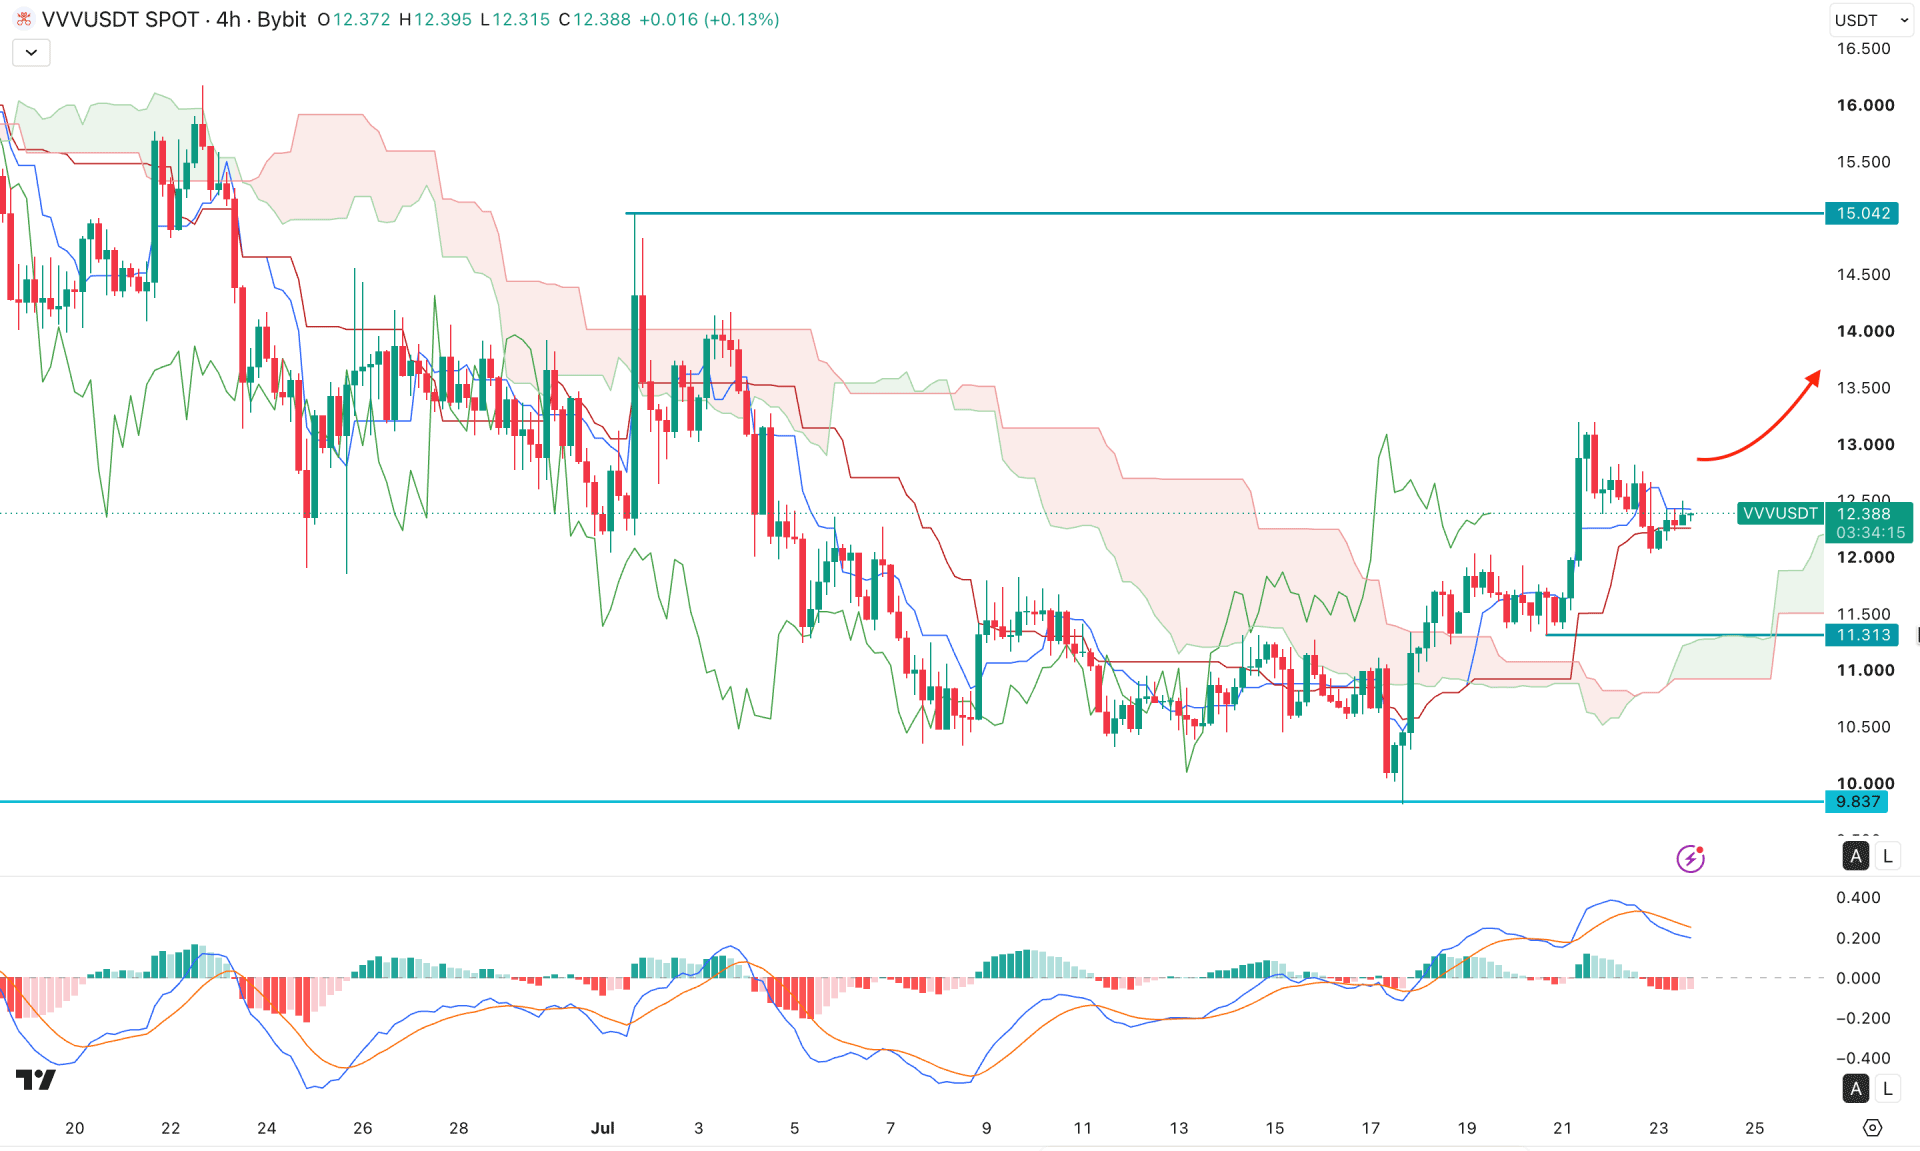
In the four-hour timeframe, the recent VVV/USDT price is showing a bullish rebound followed by a strong recovery. The price has rebounded above the Ichimoku cloud with sufficient bullish pressure, signalling a potential bullish continuation. In the future cloud, both lines are pointing upward, which is working as a confluence signal.
In the secondary indicator window, the MACD histogram has started to lose its bearish momentum, as the recent bars are approaching the neutral area. However, the signal line is still in the positive zone with a bullish crossover.
Based on the four-hour market outlook, the ongoing buying pressure remains valid as long as the price stays above the cloud support. In that case, the price is likely to extend toward the 15.042 resistance level.
An alternative trading approach is to look for a valid bearish break below the cloud support followed by consolidation. In that case, the price may decline toward the 9.837 key support level.
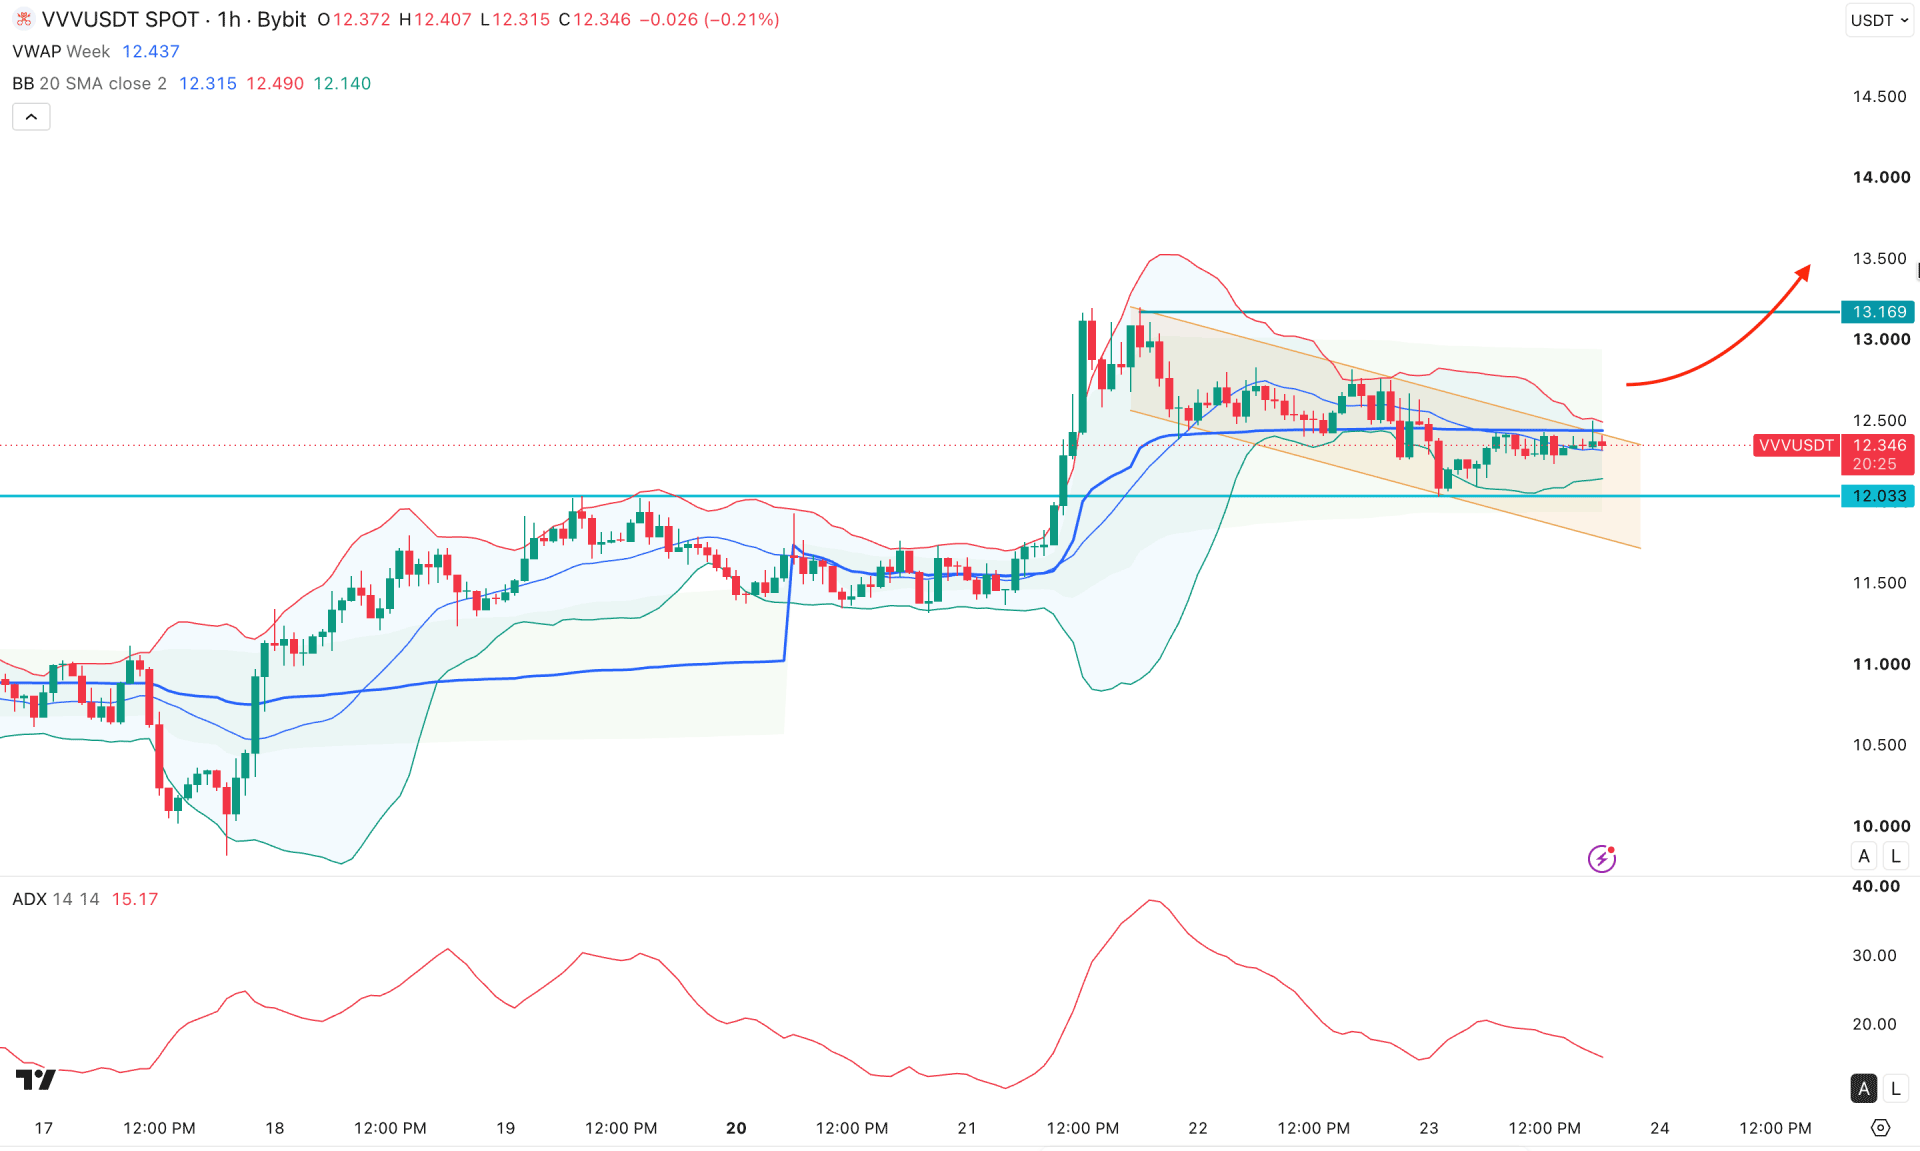
Based on the overall market is structure, BBBBUSDT is trading within a collective phase from where the bully bond is highly possible followed by a trained continuation momentum. The current price is trading at the near term resistance area from valid breakout is pending before validating the bull run.In the hourly timeframe, the recent price is trading sideways, although the overall momentum remains bullish. The weekly VWAP line is flat and just above the current price, which signals extreme consolidation. A short squeeze setup is visible from the Bollinger Bands, as the upper and lower bands are becoming narrower. This indicates a corrective market phase where a breakout is possible.
On the other hand, the indicator window shows a different picture, where the current ADX line is below the 20.00 level, signalling weak trend momentum.
Based on this outlook, a bullish rebound from the descending channel, with the ADX moving above the 20.00 level, could be a potential opportunity on the hourly chart.
The immediate resistance to watch is the 13.169 level, which needs to be broken before moving toward the 14.50 area.
On the other hand, a deeper correction is possible toward the 12.033 level, but a break below this level could extend the decline toward the 11.000 area.
Based on the overall market structure, VVV/USDT is trading within a corrective phase, from which a bullish rebound is highly possible, followed by trend continuation momentum. The current price is near a short-term resistance area, and a breakout is required to validate the pennant pattern.


