

Published: August 19th, 2026
Velvet (VELVET) rose with impulsive pressure this week but ended up with an immediate rebound. Additionally, the bears appear to be in control as they watch the impending resistance at $1.75, even though the VELVET tokens are above their major EMAs.
According to the most recent data, the network's Open Interest (OI) increased by 32% to $23.8 million in a day, indicating that traders are expanding their holdings in response to the token's growing price.
The observation that the OI based on VELVET is climbing during a 24% price gain suggests that new money is moving into the market.
Not only that, but there is a significant disparity between positive and negative holdings in the derivatives market. The $202,400 in short liquidations was almost 4 times the $59,100 in long liquidations.
The differential suggests that as VELVET keeps rising, bearish bets are being squeezed, which could increase purchasing pressure on the rally.
Let's see the complete price projection from the VELVET/USDT price analysis:
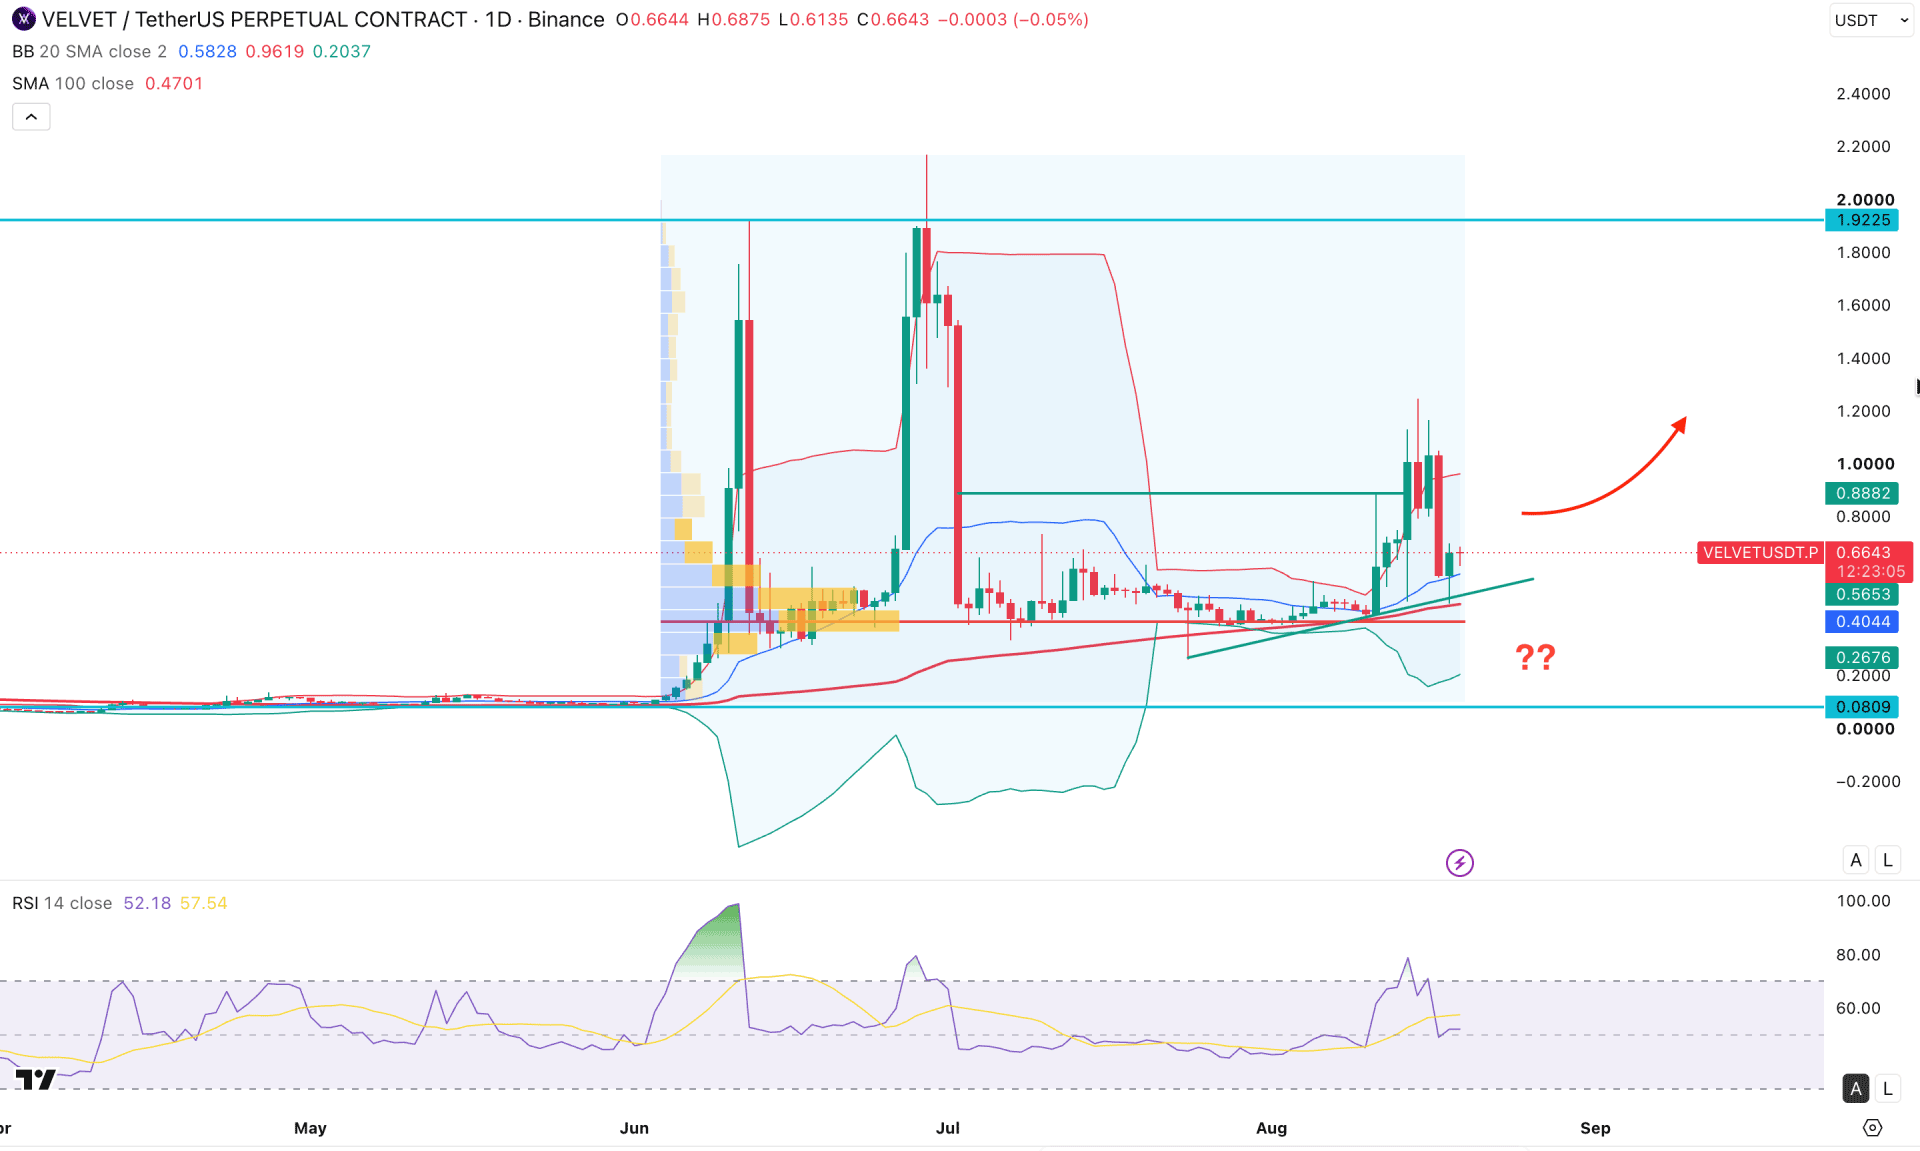
On the daily chart of VELVET/USDT, the most recent price action signals a minor pump-and-dump move following the broader corrective structure. Price action became volatile after a massive bullish breakout in June 2026, followed by multiple pump-and-dump formations. As the current price holds momentum near the near-term support level, proper confirmation could offer a long opportunity at any time.
On the higher timeframe, the monthly price action remains volatile, with the current price trading as an inside bar after massive selling pressure in July 2026. However, the monthly support level remains protected. Therefore, the main focus for this pair would be to look for long trades only. On the weekly timeframe, a similar structure is visible, where a bullish breakout from a five-week range signaled positive bullish price action.
Looking at the volume structure, the recent surge in trading activity formed a high-volume level at 0.4044, which remains below the current price. Moreover, the most active level since June 2025 is working as a crucial support, and the price may rebound at any time as long as buyers hold momentum above this line.
In the main price area, the 100-day SMA is working as a major support, as it remains below the current price. Moreover, the most recent daily candle touched the 100 SMA before closing bullish from the demand zone.
On the other hand, the price is trading above the middle Bollinger Band, with room to move toward the upper Bollinger Band resistance level. The recent bullish flip from the middle Bollinger Band signals buyer interest in the market, which is also supported by a trendline support.
In the indicator window, the Relative Strength Index shows a different story, where a bearish recovery from the overbought area is visible. As the current RSI line is struggling around the 50.00 neutral level, proper confirmation is needed before considering a rebound.
Based on this market structure, we may anticipate bullish continuation as long as the price remains above the high-volume support level. The immediate resistance to watch is the 1.2000 level, which needs to be breached before moving beyond the 1.9225 level.
On the other hand, the recent pump-and-dump move could result in bearish continuation if the price fails to hold momentum from the trendline support. A break below the 0.4000 psychological level could increase the possibility of extended downside pressure and a test of the 0.0809 support level.
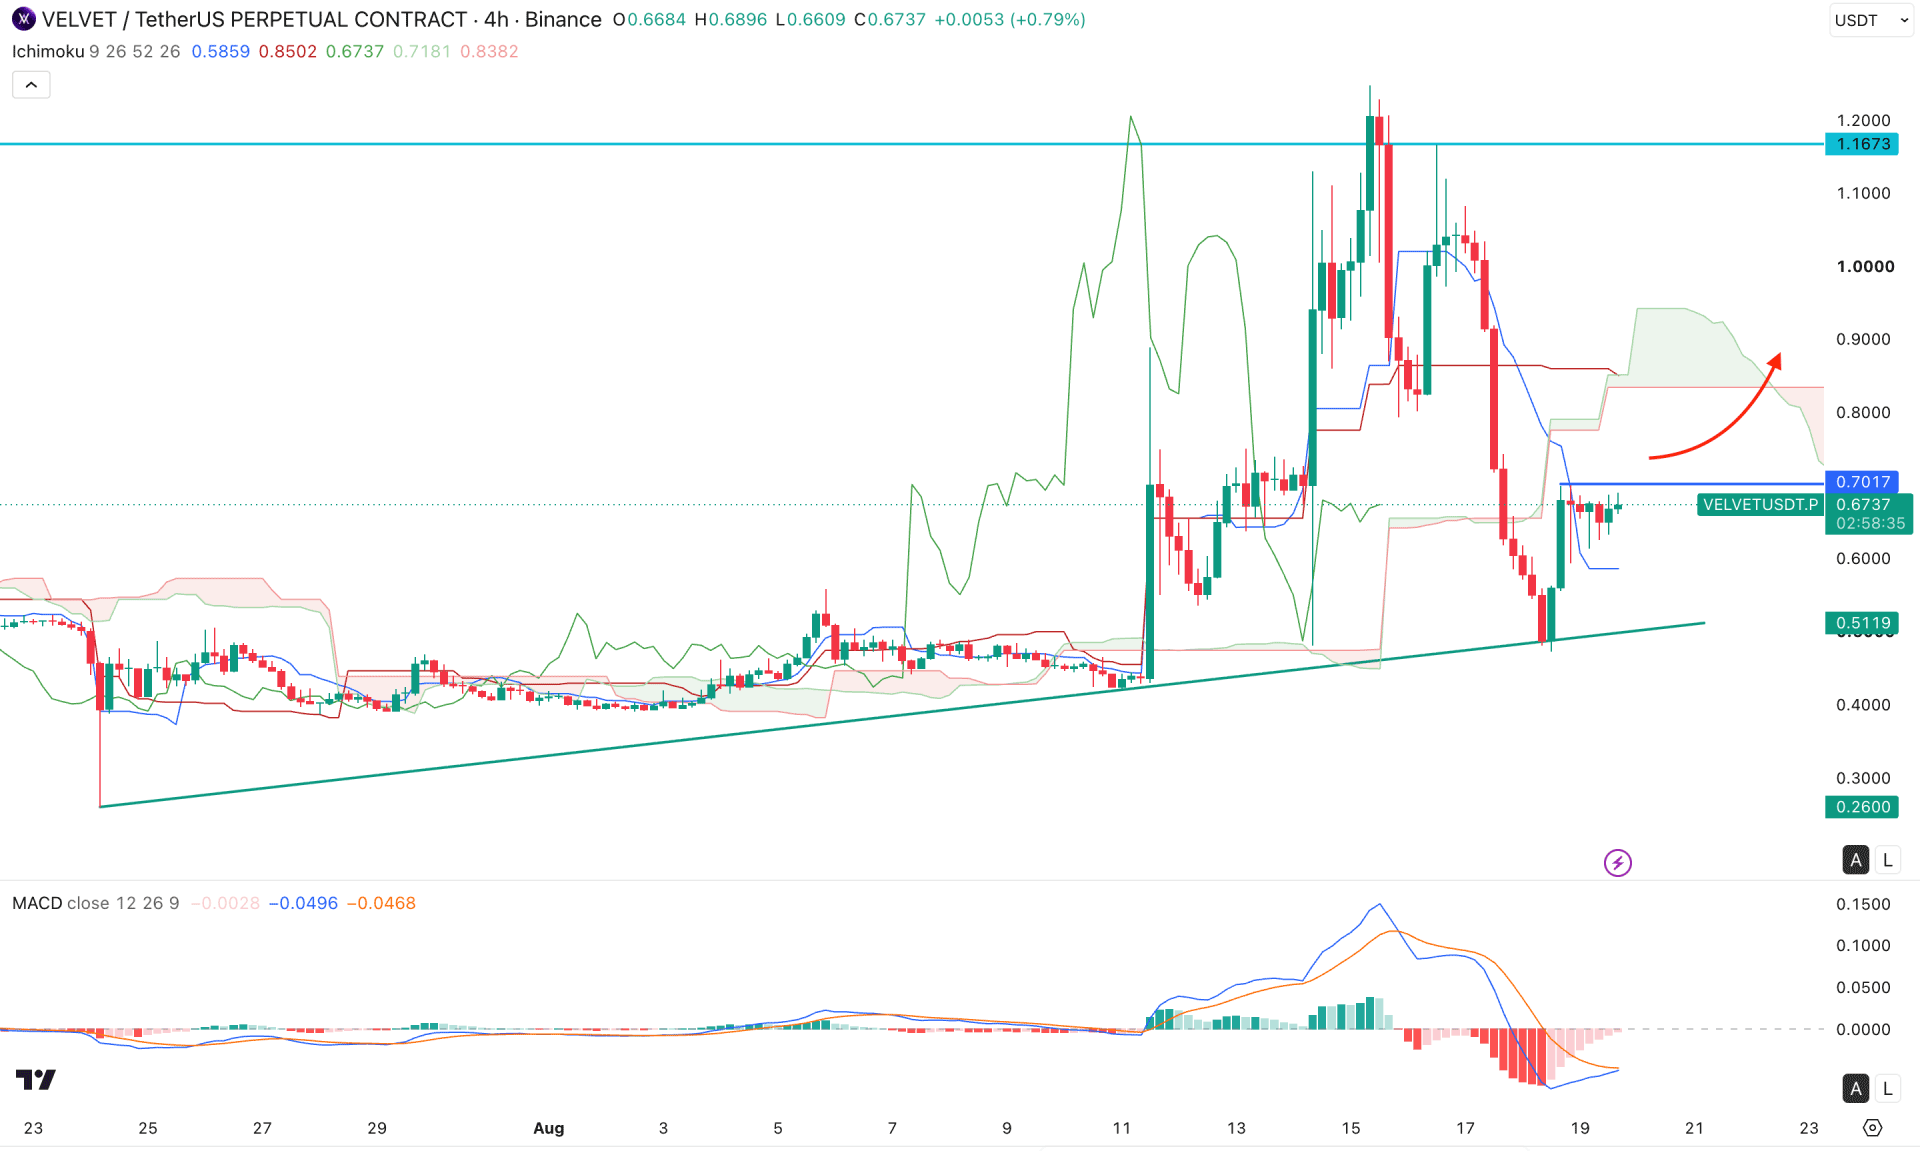
On the four-hour timeframe, VELVET/USDT is trading near a support area, where the rising trendline is working as an immediate support. However, the overall structure remains below the cloud resistance, which signals mixed market momentum.
In the future cloud, both lines are flat with a bearish flip, while the dynamic resistance level remains above the current price. However, a bullish rebound possibility is visible in the indicator window, where the histogram is rebounding from its lower position and rising toward the neutral level. The signal line is also showing a bullish crossover.
Based on this outlook, investors should closely monitor how the price holds momentum below the cloud resistance. A bullish break above the 0.9000 level could validate a cloud breakout and open room for a move beyond 1.2000.
On the other hand, the ongoing selling pressure remains valid. A trendline break could increase the possibility of testing the 0.2600 level at any time.
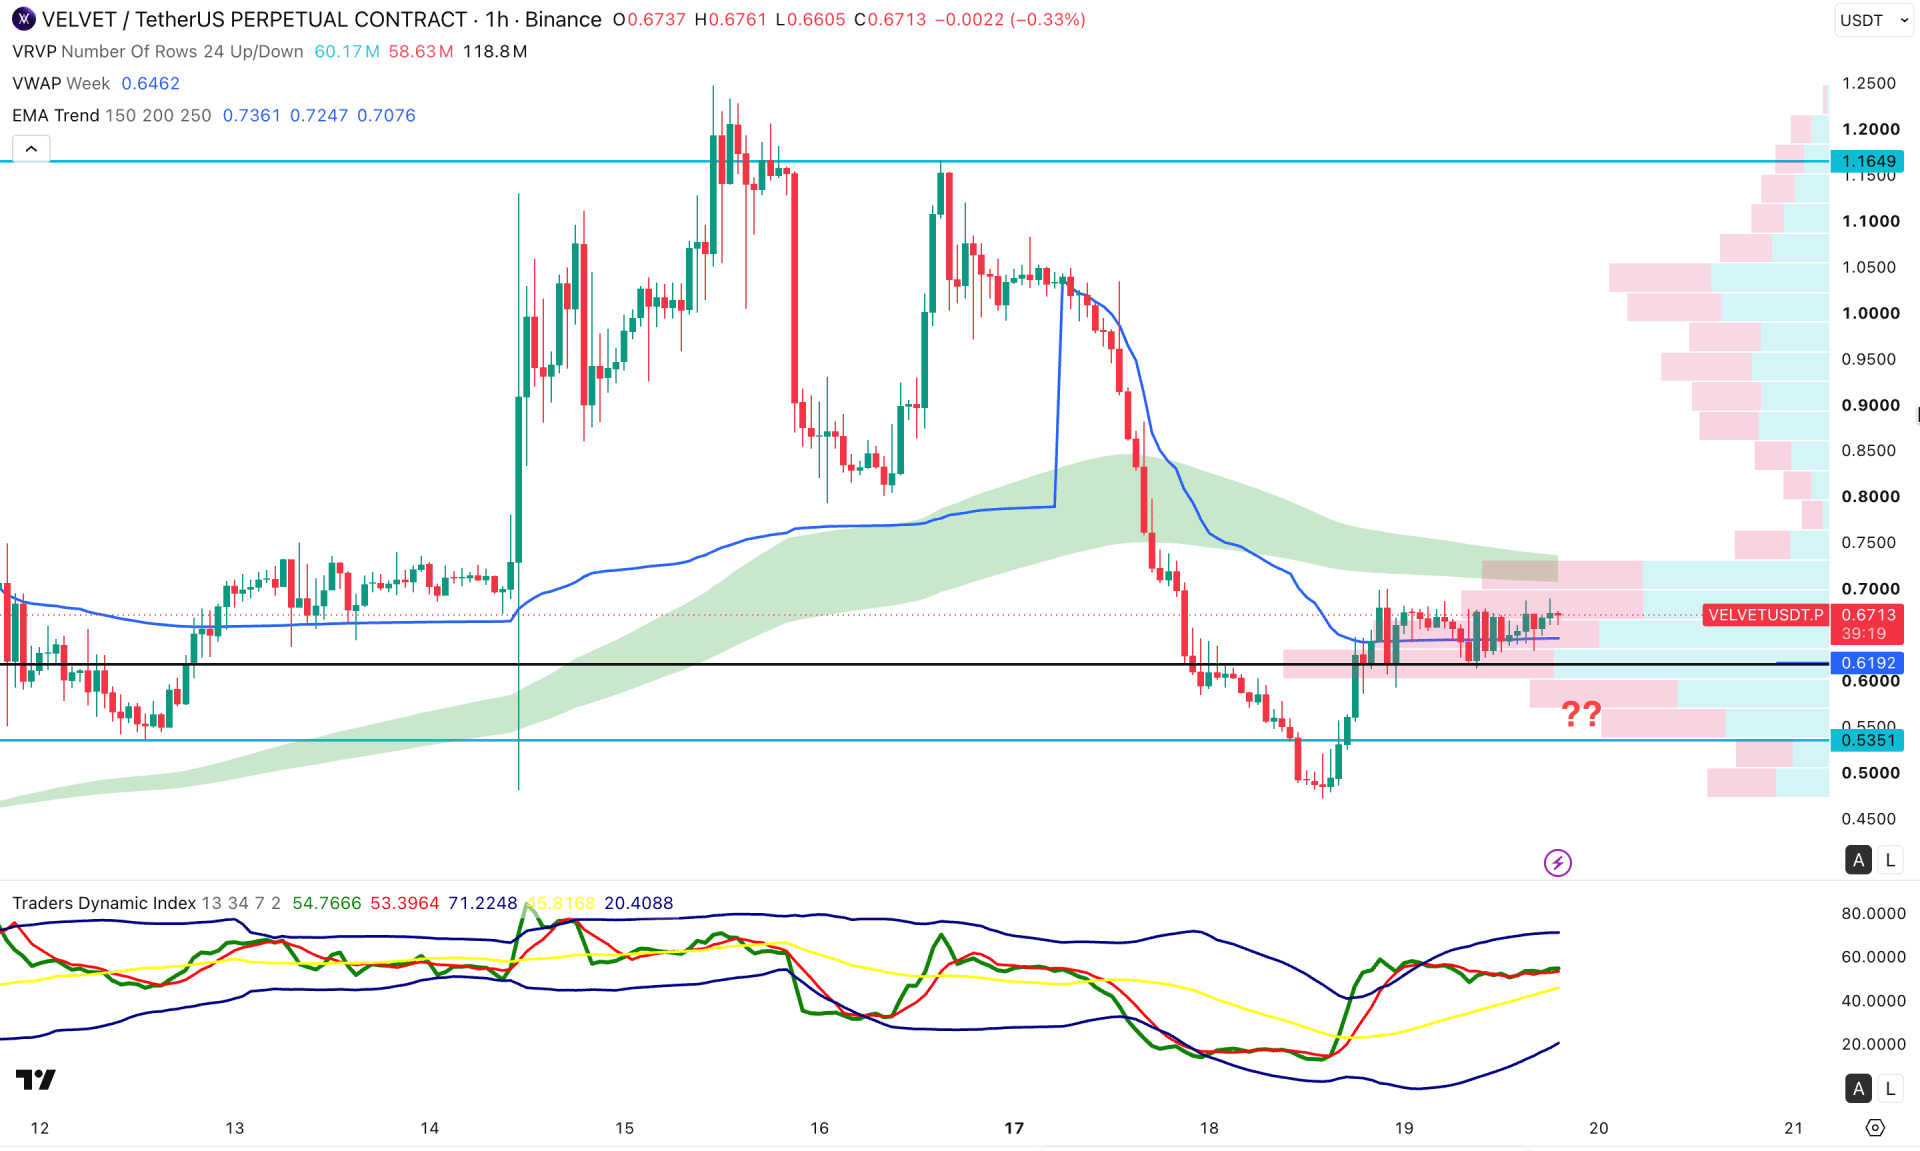
On the hourly timeframe, VELVET/USDT is trading sideways after forming a swing low at 0.4759. The price rebounded from the bottom and is currently hovering near the higher area. It may indicate an accumulation phase, from which a breakout is highly possible.
On the other hand, the weekly VWAP level remains flat near the current price, signaling a sideways market. The EMA is working as a major resistance.
Based on this outlook, a bullish breakout with a recovery above the EMA could open room to test the 1.0000 psychological level before moving beyond 1.1649.
On the other hand, bearish continuation is possible, where the immediate support is at the 0.5351 level before testing the 0.4000 area.
Based on the overall market structure, the price is trading within a pump-and-dump pattern, while the recent bearish recovery was unable to form a new swing low. This indicates that bulls are still interested in the market, and further bullish continuation remains possible. Investors should closely monitor the short-term daily support area, as any significant breach could invalidate the bullish possibility at any time.


