
Published: June 2nd, 2026
With the quick uptake of Vault Customer Relationship Management, its next-gen CRM platform, Veeva is further solidifying its position as a leader in life sciences software. Approximately 140 customers are currently live on Vault CRM, according to management during the final quarter of financial 2026 earnings call. This indicates excellent implementation across both big pharmaceutical businesses and smaller biotechs.
As clients move away from older platforms, the business anticipates that about 14 of the largest 20 pharmaceutical companies will eventually standardise on Vault CRM, strengthening its competitive position.
As more clients use its more recent clinical applications, Veeva's R&D business is also gaining traction. In addition to well-known products like eTMF, management emphasised the strong demand for RTSM, EDC, Safety, and LIMS, which are emerging as important growth drivers. A significant top-20 pharmaceutical company standardising on Veeva RTSM in the final quarter of fiscal 2026 was a notable milestone, underscoring the platform's growing importance in managing complex international clinical trials.
Let's see the complete price projection from the VEEV technical analysis:
In the daily timeframe, Veeva stock (VEEV) is trading at a crucial point from where a long-term bullish opportunity is valid from a discounted price. The recent price is trading below the multi-year low, where a strong sell-side liquidity sweep is visible before forming a bullish price pattern.
Looking at the higher timeframe, the monthly candle suggests a bullish rebound, followed by a bullish doji breakout, creating a new monthly swing high. The weekly structure follows the same story, where a rally breakout is clear, followed by a new swing high formation.
In terms of trading volume, the bullish activity is also valid, as the largest activity level since late 2025 is below the current price and in line with the breakout point.
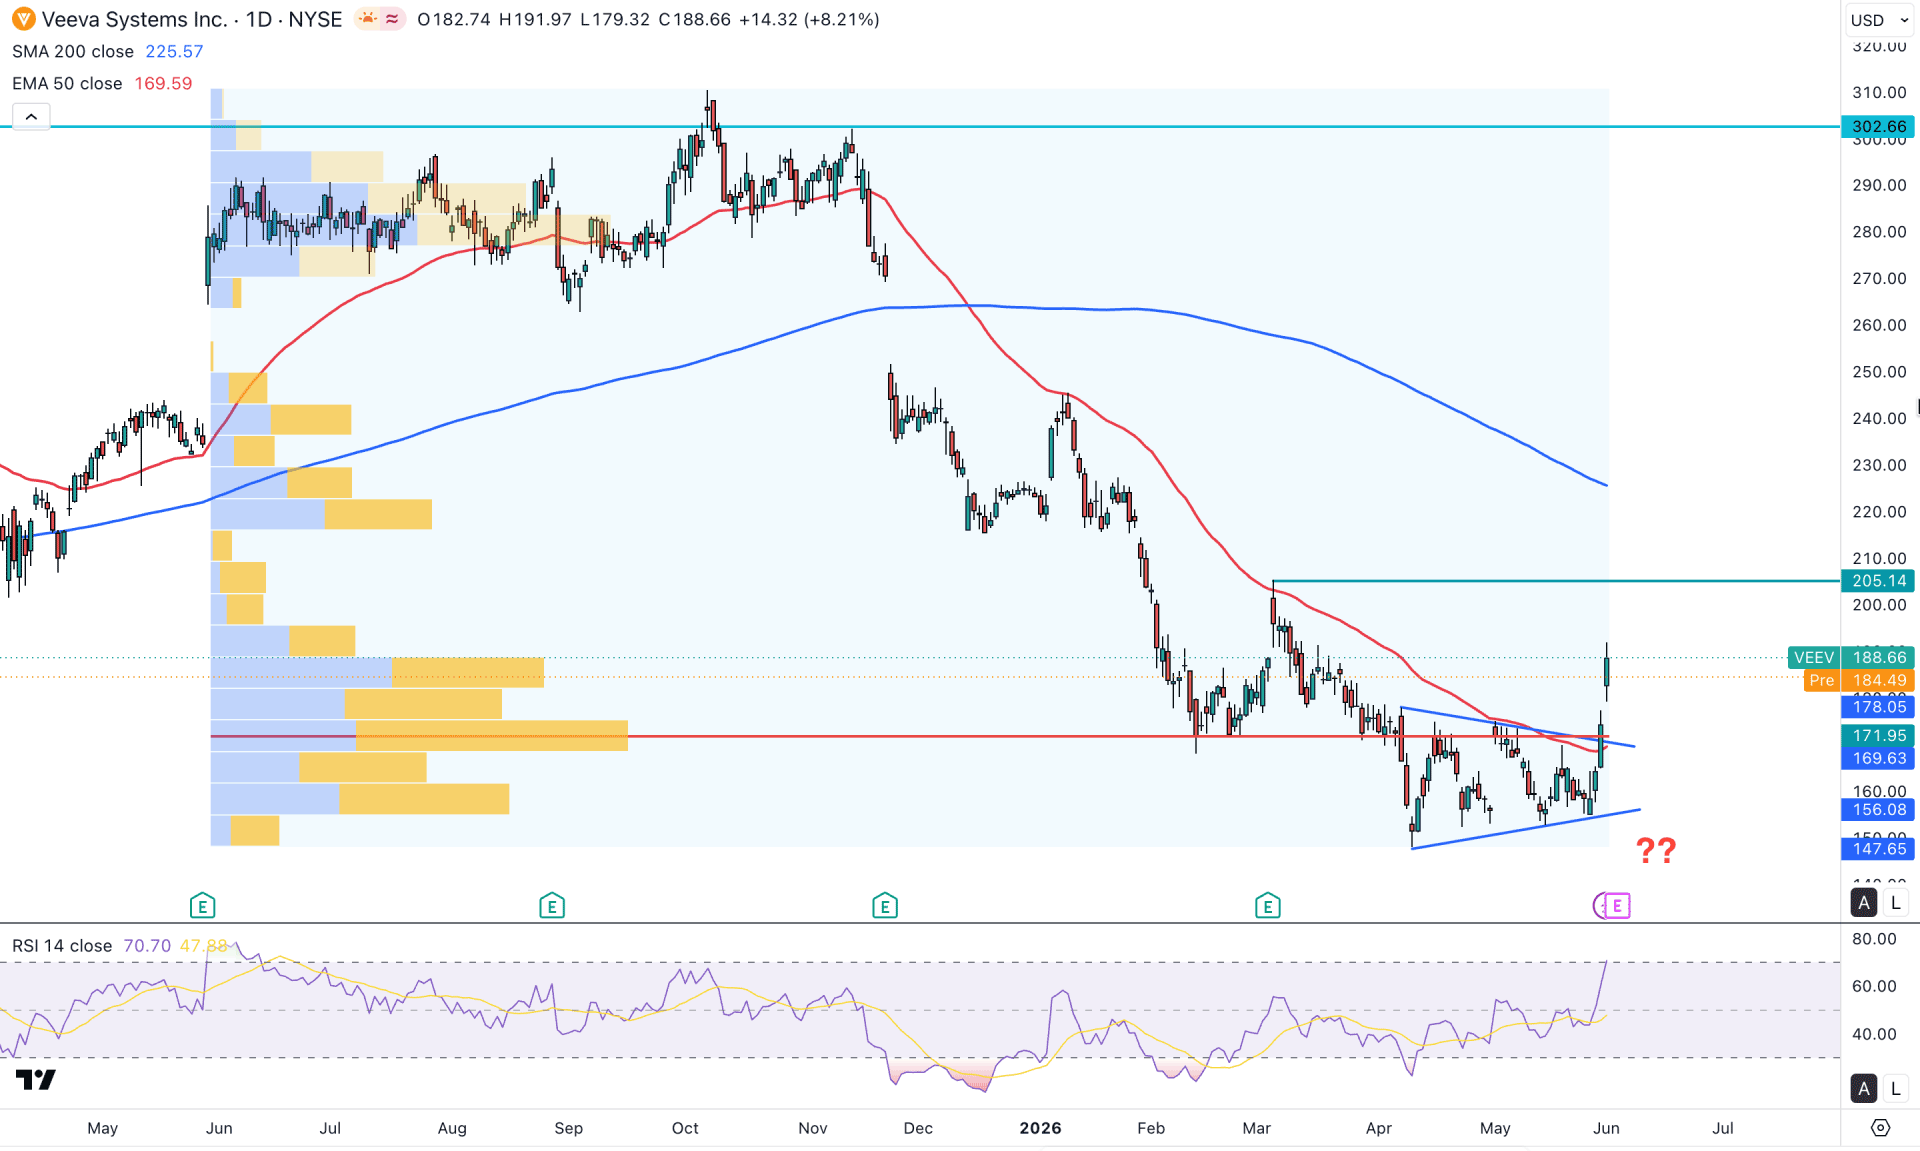
In the main price chart, a bullish recovery is visible above the 50-day EMA with a valid daily close. This is the first bullish breakout above the 50-day EMA in the last eight months. However, the 200 SMA is still above the current price and has a bearish slope, which could be a challenging factor for buyers.
An extended downside correction took the price below the five-year low, from where a triangle breakout is visible. As the current price is trading above the triangle high, a downside correction could appear to validate the breakout.
In the Relative Strength Index, the current line is in line with the 70.00 overbought level, signalling active buying pressure in the market.
Based on the overall market structure, the stock is trading in a discounted zone from where a bullish recovery is highly possible. The initial sign of buyers' presence is shown from a price pattern, but more confirmations are needed before opening a long position. The immediate resistance to look at is the 205.14 level, which could be tested, followed by the existing bullish pressure. However, investors should closely monitor how the price reacts at the 205.14 resistance line, as a valid break could open the room for reaching the 280.00 area.
On the other hand, any immediate bearish reversal is possible from the current price area. In that case, a failure to hold the price above the 171.95 high-volume line could be a challenging factor for bulls. A bearish daily close below the 50-day EMA could increase the possibility of creating a new swing low below the 147.00 area.
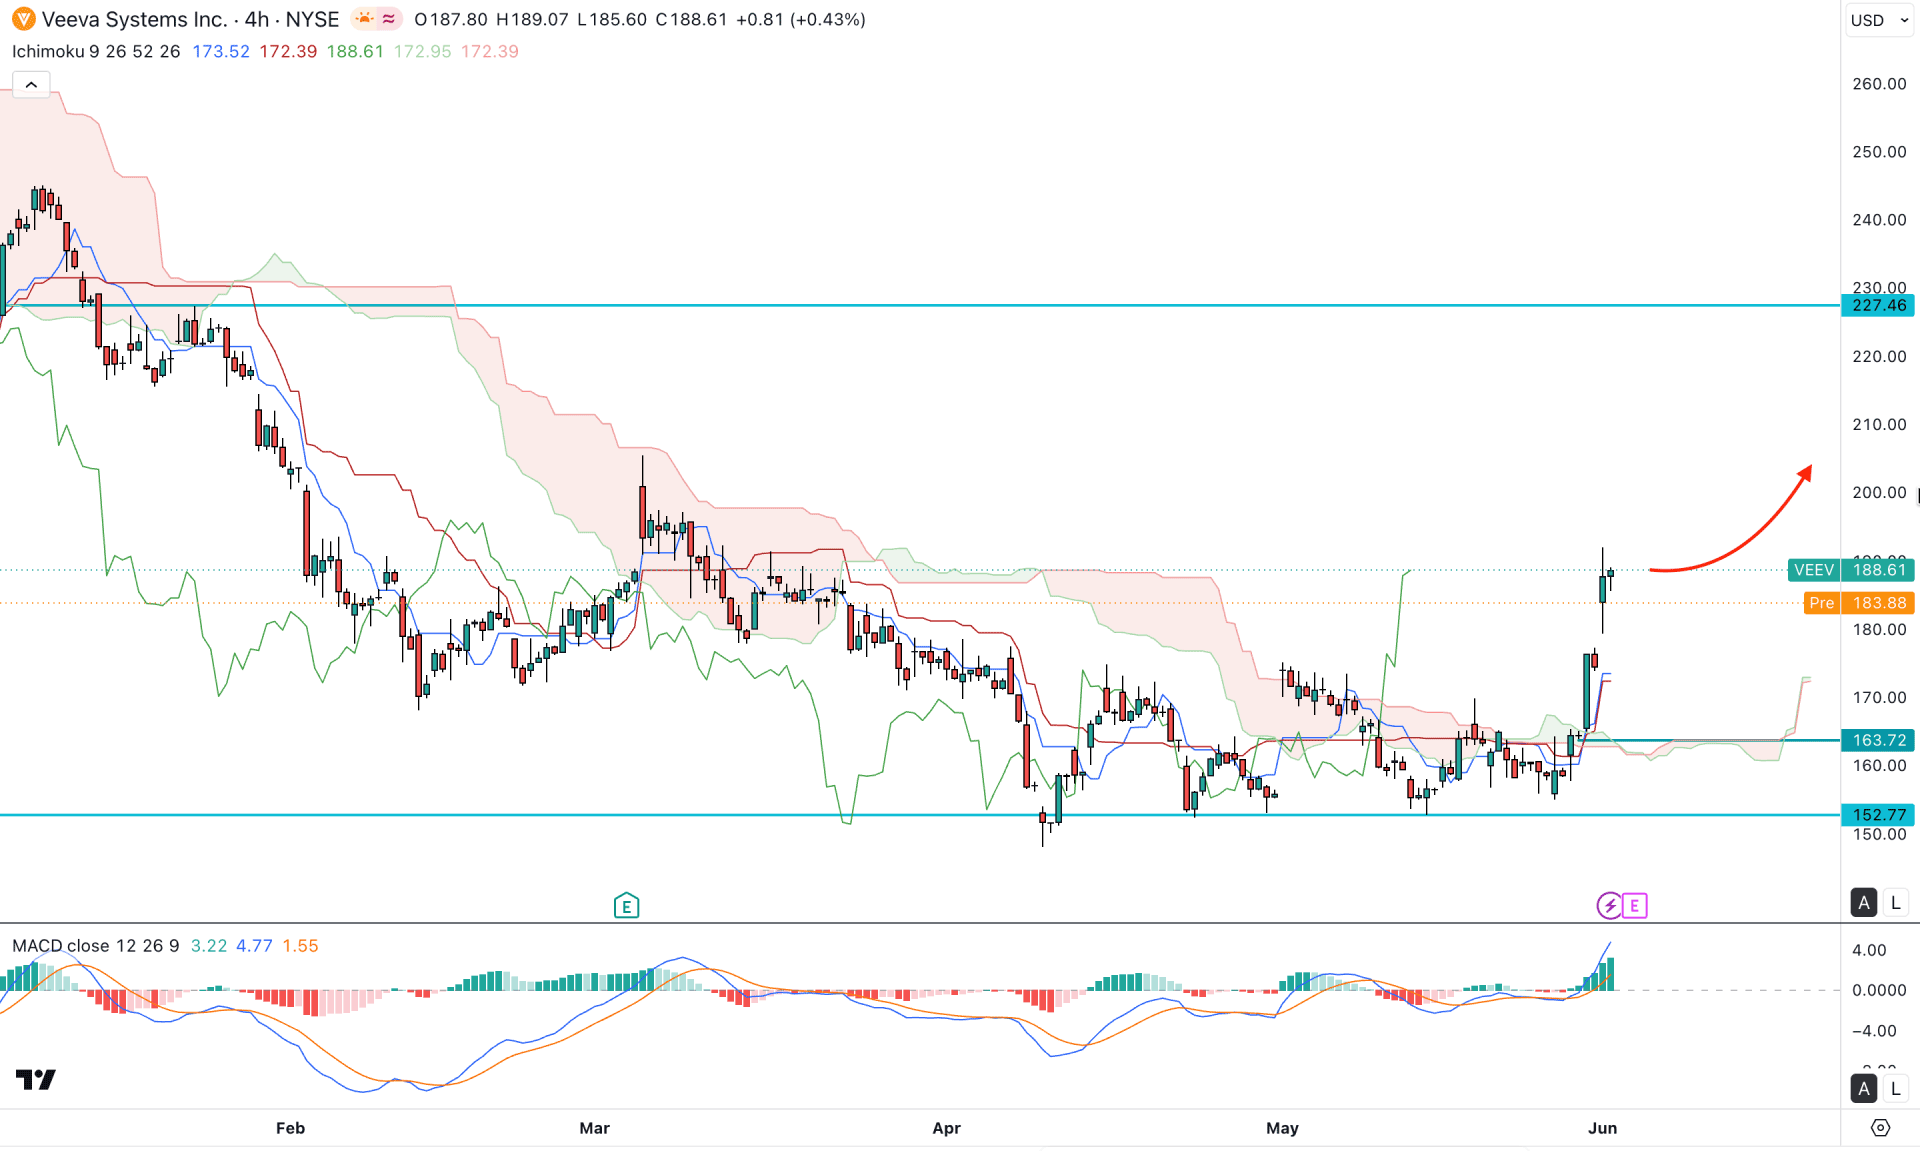
In the four-hour timeframe, the VEEV is trading within a bullish momentum as the recent price formed a valid breakout above the cloud area with an impulsive momentum. As a result, the future cloud has flipped its position higher. This similar structure is seen with the dynamic lines as they are below the current price with an upward slope.
The indicator window shows bullish activity, where the MACD histogram has maintained the pressure for a considerable time. Moreover, the signal line is following the momentum by moving at the highest level in the last six months.
Based on this outlook, the most recent bullish breakout above the cloud area is valid. In that case, the price has a higher possibility of creating a new swing high after a minor correction. The immediate support to look at is the 163.72 level, which is just below the dynamic support.
On the bullish side, a strong resistance is available at the 227.46 level, which needs to be overcome before moving down to the 250.00 area. However, any immediate rebound from the current price area with a bearish four-hour close below the 163.00 level could invalidate the bullish opportunity and open a short opportunity targeting the 120.00 level.
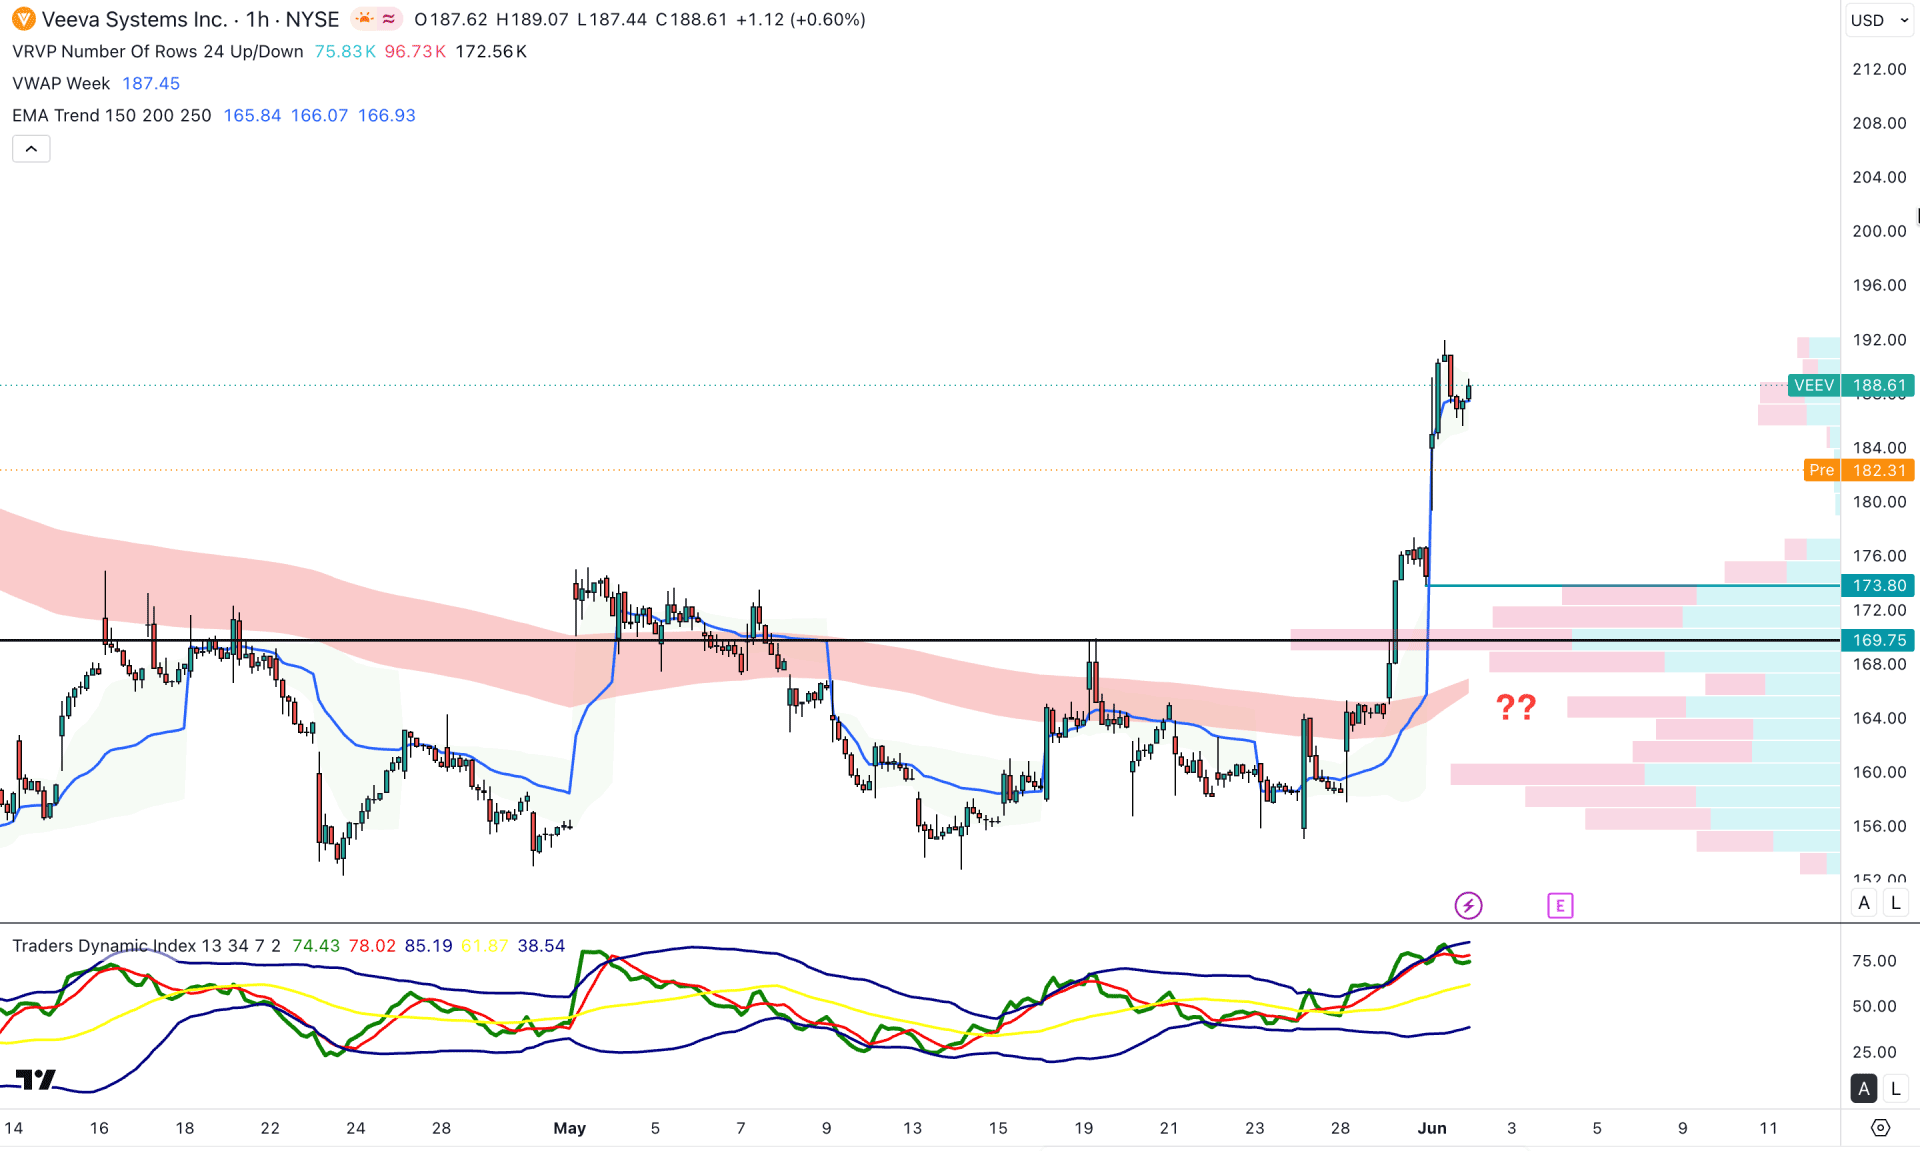
In the hourly timeframe, an extended buying pressure is visible as the current price is trading at the daily premium zone. In that case, the primary aim would be to look for a long trade only until a pump and dump pattern.
In the current chart, the weekly VWAP line is closer to the current price and working as an immediate support. Moreover, the high volume line is marked at the 169.75 level, which is below the current price.
The indicator window shows buying pressure as the Traders Dynamic Index is above the 50.00 line with no sign of a downside recovery.
Based on this outlook, a minor downside correction is pending while the immediate support is at 173.80. A bullish rebound from this area could increase the price beyond the 200.00 psychological line.
Based on the over market structure, the VEEV is trading at a multi-year low, where the recent downside recovery with consecutive four bullies daily candle is not sufficient to consider a trend change. Investors should closely monitor how the price trades here, as a bullish rebound from the daily high volume line could validate the bottom and open a foolish rebound opportunity.


