Published: February 8th, 2023
VeChain (VET) is a leading Blockchain as a Service (BaaS) platform that offers comprehensive enterprise blockchain solutions. It was the first public blockchain project dedicated to business and industrial applications and its main net was launched in 2018.
VeChain (VET) enables organizations to swiftly and effortlessly implement a blockchain solution without creating their own internal infrastructure. For instance, VeChain (VET) provides resources for traceability and supply chain management, enabling companies to keep track of products during the entire production process.
The recent surge in VeChain (VET) value can be attributed to the announcement of Samsung and DNV GL using VeChain (VET) for their shipments. With such reputable names utilizing the platform, investors are becoming more optimistic and are showing an increased interest in VeChain (VET).
Should you invest in VeChain (VET)? Let’s see the upcoming precise direction from the VET/USDT technical analysis:
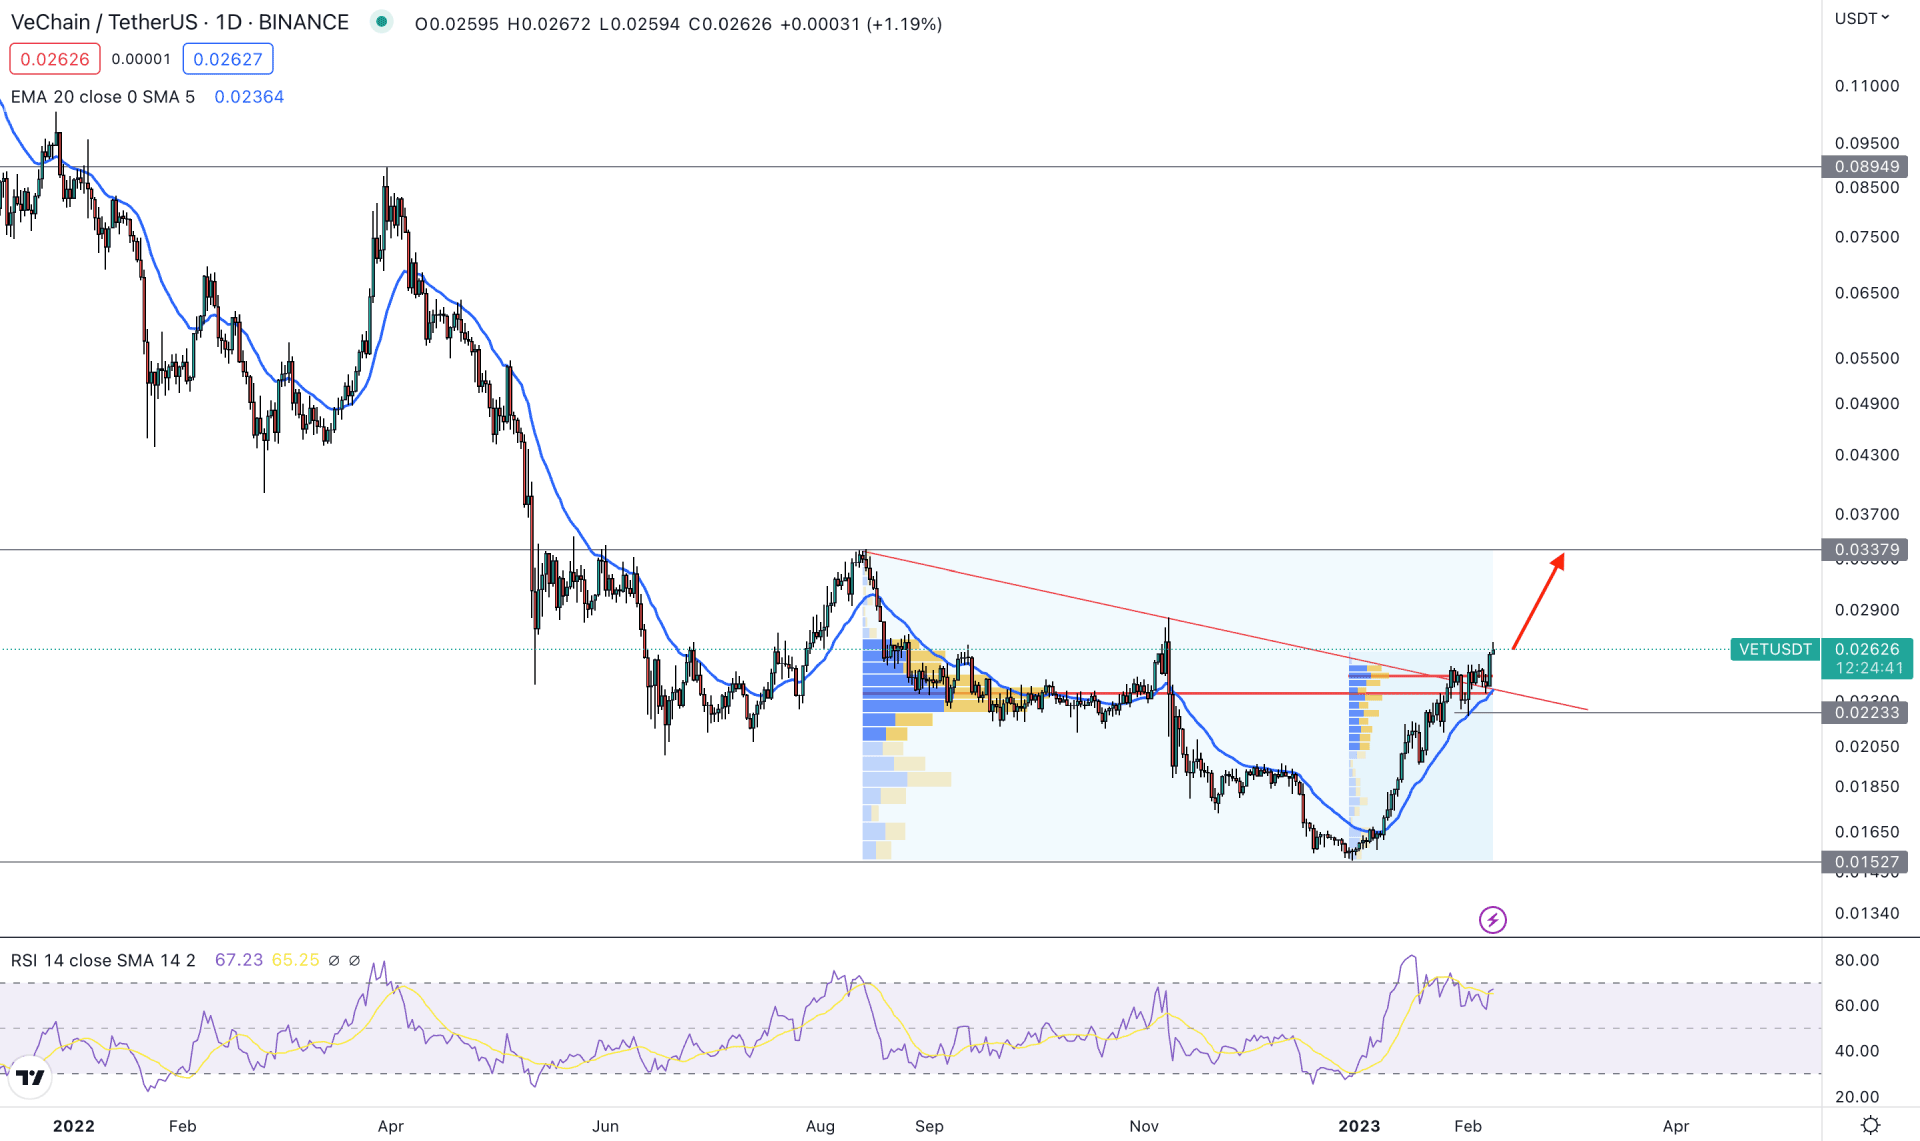
In the daily price of VeChain (VET), the overall market outlook is bullish at first sight, as the current price is trading higher with a trendline breakout.
The buying pressure at the trend line resistance is solid as the current high volume level from August to February is below the current price. Moreover, another high volume level from the December low to the February high is also below the current price and at the trendline area. In that case, we can consider the bullish breakout from the trendline to be solid, which can increase the price more in the coming days.
In the daily tradable range, a strong buying pressure is visible from the 0.0152 low, which will be the bottom of the current tradable range. On the upside, the immediate recovery from the 0.0894 level is significant, and we can consider it as a valid top. As the current price is trading at the discounted zone, we consider the buying pressure as potent.
The dynamic 20 Day EMA in the main chart is below the price, while the current RSI holds a strong momentum at the 60% area.
Based on the daily price outlook, any buying pressure from the trendline support would be a decent buying opportunity, where the main aim is to reach the 0.0800 level. On the bearish side, a downside pressure and a stable daily candle below the 0.0223 level could offer a bearish possibility, targeting the 0.0152 support level.
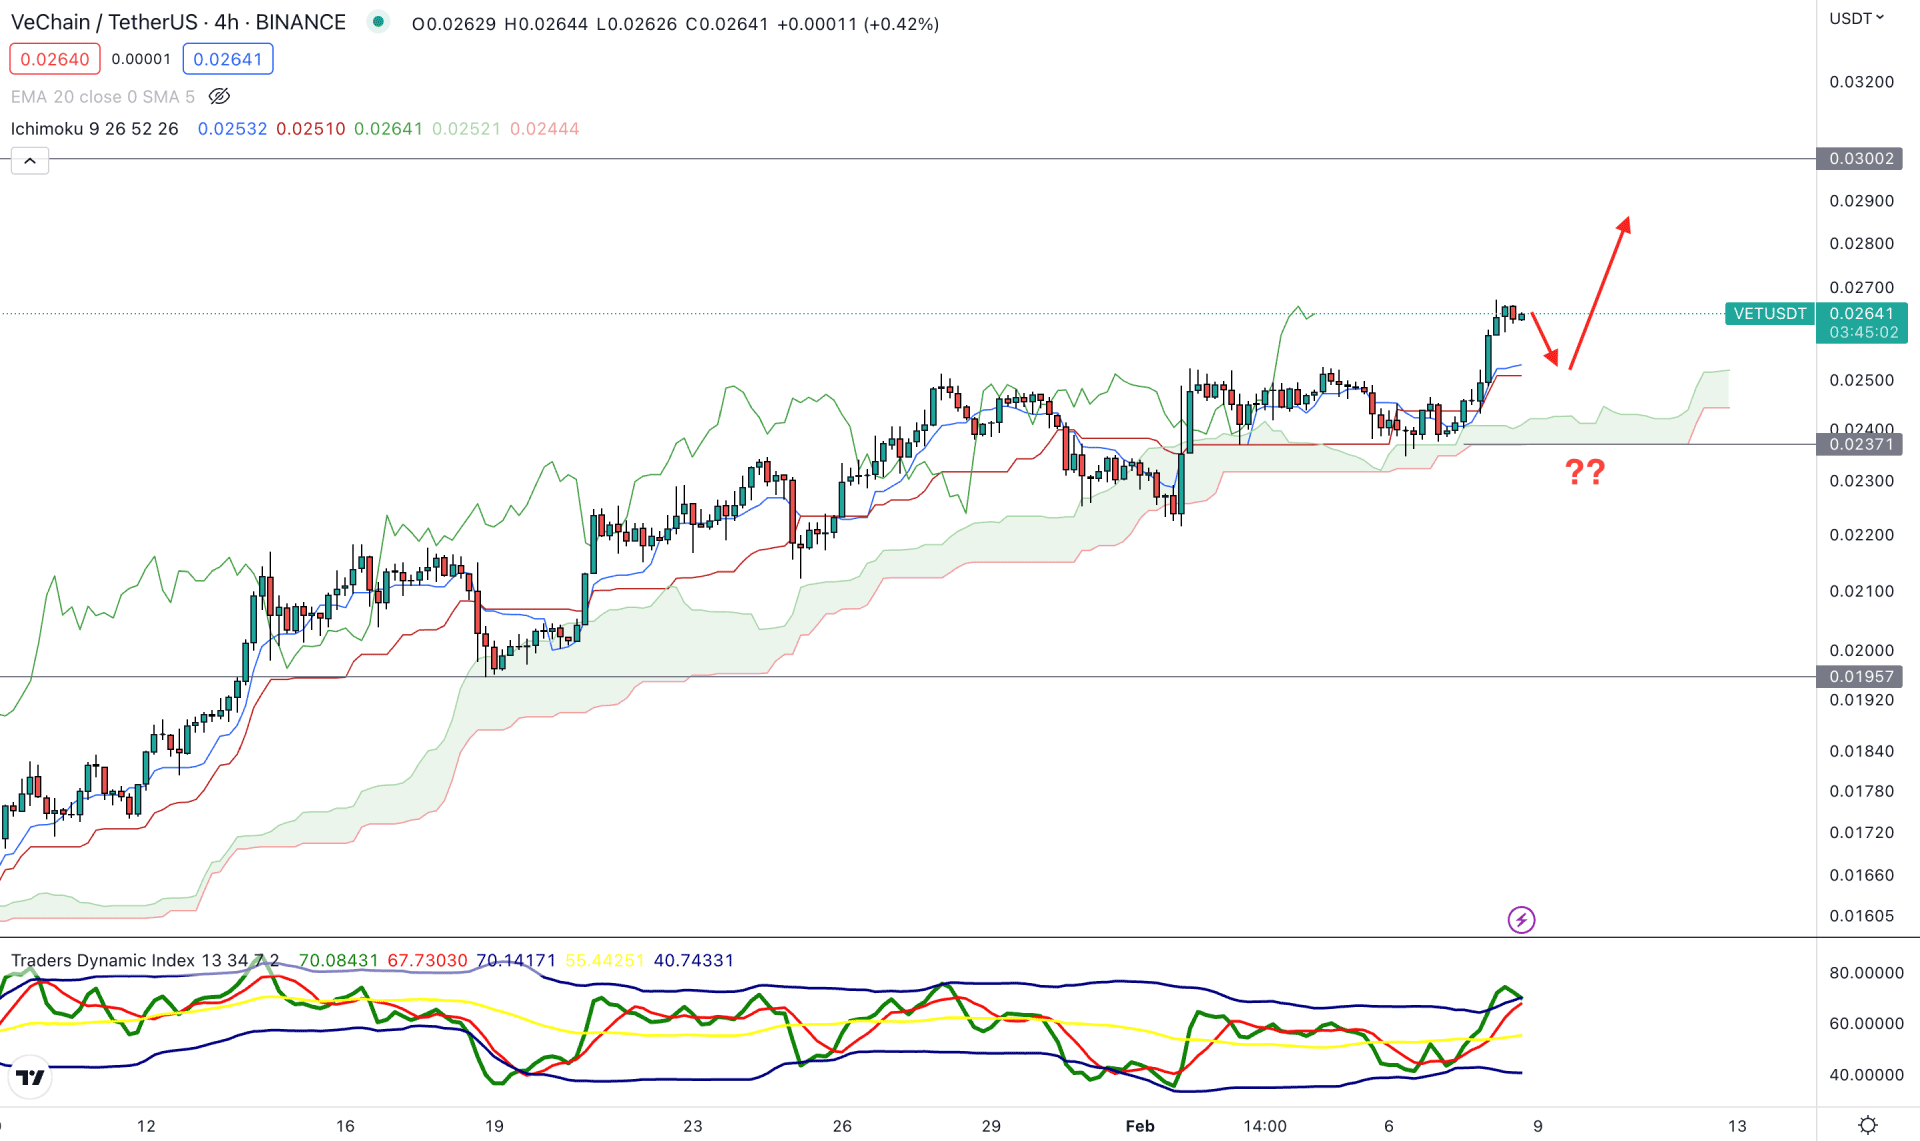
In the VET/USDT H4 chart, the overall market structure is bullish as the current price is solid above the dynamic Cloud support. Moreover, the future cloud’s structure is also solid for bulls as the Senkou Span A is aiming higher, above the Senkou Span B.
In the indicator window, the Traders Dynamic Index (TDI) showed an overextended price at the top. The TDI level reached the upside limit and showed a rebound, which is a sign that the buying pressure needs a correction before extending in the coming hours.
Based on the current H4 outlook, a downside correction and buying pressure from the dynamic Kijun Sen could offer a long opportunity in this pair, targeting the 0.0300 level. The buying pressure is valid as long as it trades above the 0.0237 support level. A break below the 0.0250 level could eliminate the buying possibility and lower the price toward the 0.0195 support level.
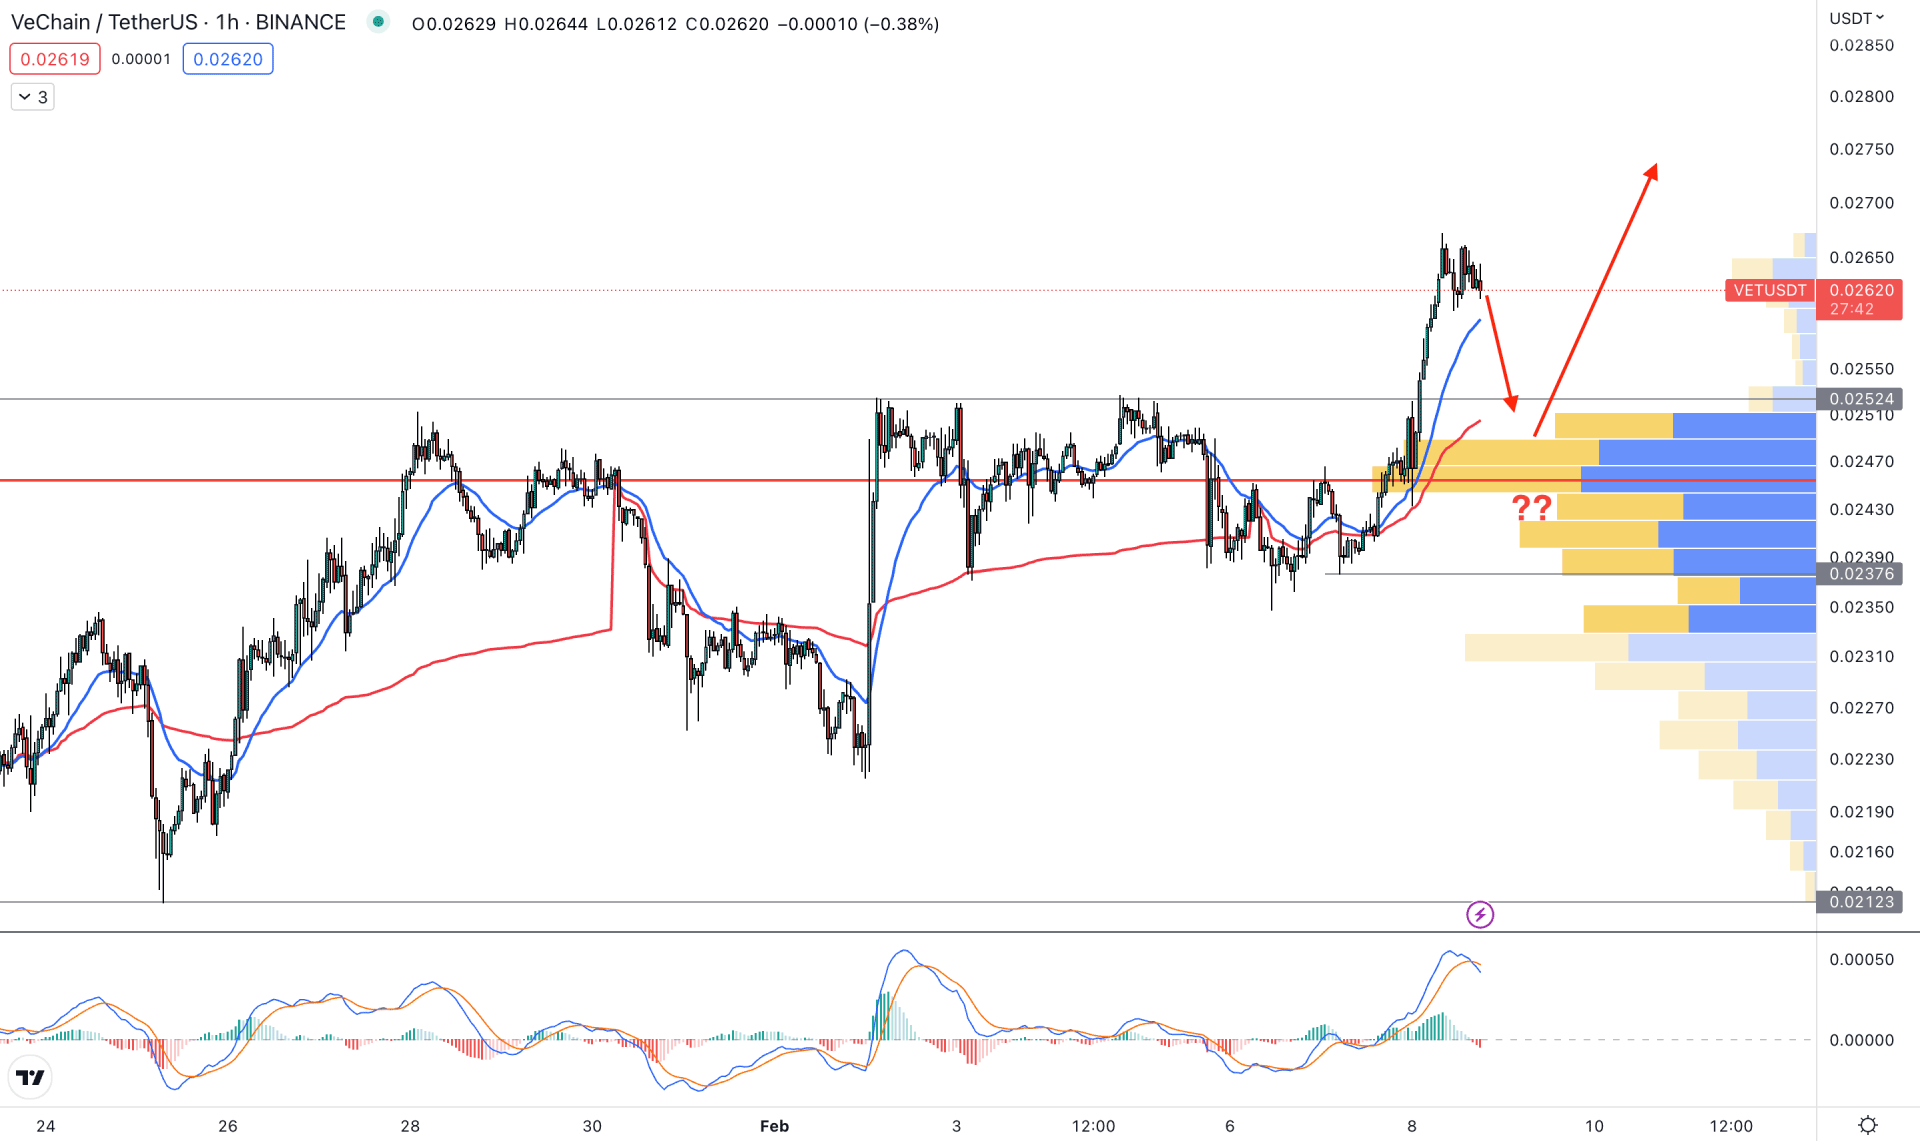
In the hourly timeframe, the broader outlook of this instrument is bullish. The current visible range high volume level is at 0.0245 level from where the current buying pressure has come. As a result, the upside momentum could increase if the price comes toward the high volume level again.
In the main price chart, the dynamic 20 EMA and weekly VWAP are below the current price, where the gap between these two dynamic levers is solid.
In that case, a downside correction is pending in this pair, but any bullish rejection from the dynamic area could offer a long opportunity.
The upside possibility is limited as long as the price trades above the 0.0245 level. A break below the 0.0237 level with an H4 close could eliminate the buying possibility and lower the price toward the 0.0200 area.
As of the current multi-timeframe analysis, the bullish momentum in the VET/USDT price is solid in the daily chart. Investors should closely monitor the lower timeframe price action to find the best price to join the bullish trend.


