Published: September 19th, 2023
The value of VET has encountered significant fluctuations throughout the year. In the first quarter of 2023, the price of VeChain doubled from $0.015 in January to $0.032 in early March, representing a robust performance by the cryptocurrency.
During the second quarter, the price reverted to its January levels, wiping out these gains. Since then, based on supply chain technology, this cryptocurrency has struggled to progress significantly, with its trading pattern remaining largely unchanged.
Within the VeChain ecosystem, several significant developments have taken place. In the first quarter of 2023, the platform obtained remarkable results. VeChain's financial holdings consist predominantly of Bitcoin and Ethereum, and the significant increase in BTC and ETH prices has significantly fueled the foundation's expansion. Beginning the year with $275 million in assets, VeChain grew its balance sheet to $380 million by the end of March.
VORJ, VeChain's comprehensive Web3-as-a-service platform, continues to evolve concurrently. Its primary objective continues to be the simplification of digital asset deployment and the incorporation of blockchain APIs. The platform is currently undertaking significant enhancements, including integrating the Interplanetary Filesystem (IPFS) for decentralized file storage and introducing a direct listing feature for the World of V (WoV) marketplace.
Let's see the upcoming price direction from the VET/USDT technical analysis:

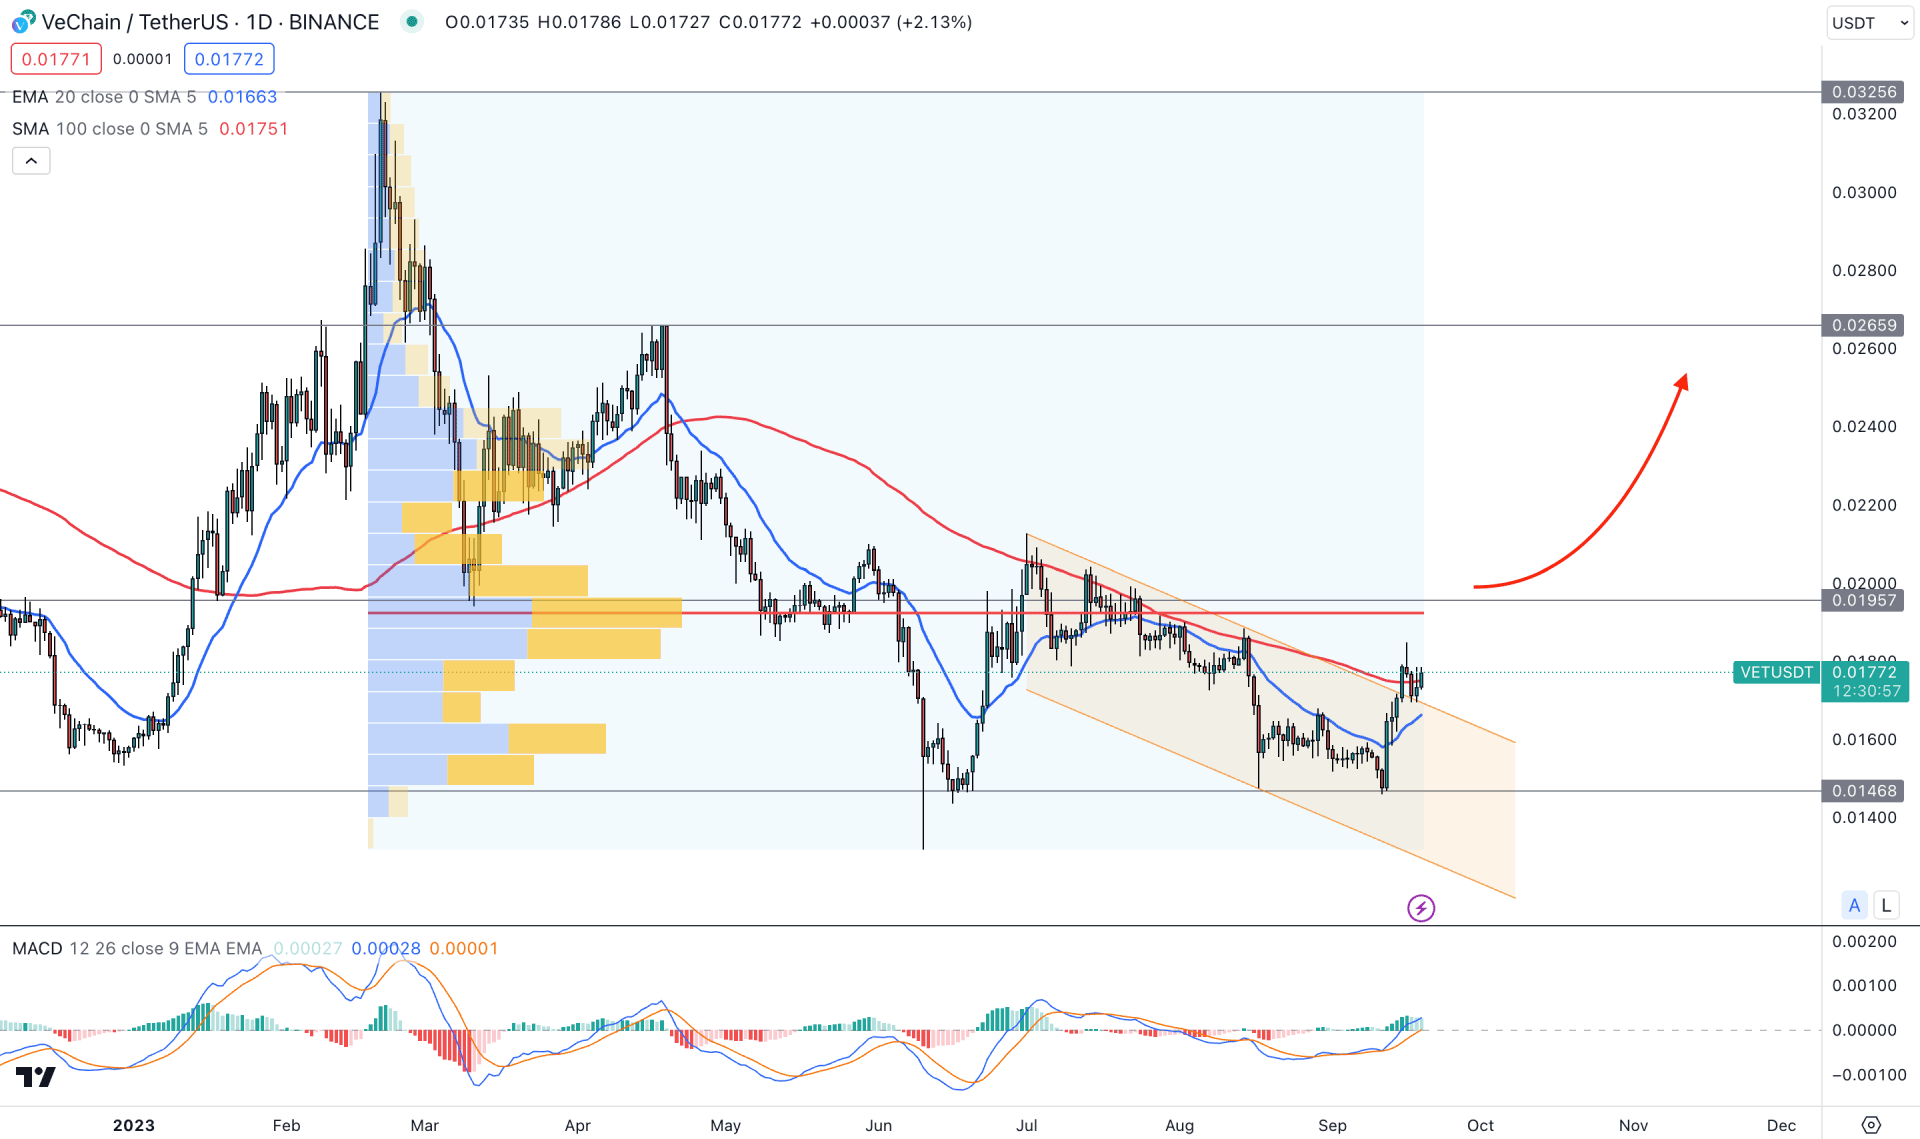
In the VET/USDT daily chart, the current price trades within a corrective price action where a strong breakout is needed before forming an impulsive trend.
In the higher timeframe, strong buying pressure is visible as the current price is trading at the bottom of the 2021 range, while the weekly price shows a consolidation since May 2023. Moreover, the 20-week EMA works as an immediate resistance, while the 100 SMA is above the trading zone. Based on this higher timeframe’s price action, a strong bullish range breakout is needed to reach 2021 high, but in the lower timeframe, the price needs more clues to find a pre-breakout momentum.
In the daily volume structure, the most active level since the 20 February peak is spotted at the 0.0192 level, which is above the current price. Although the dynamic 20 EMA and 100-day SMA are below the current price, bulls need to overcome the high volume area before forming a stable trend.
In the indicator window, the early sign of a bullish trend is seen where the positive MACD Histogram is getting support from the upward signal lines.
Based on the daily price structure, the descending channel breakout supports a bullish continuation, but a conservative approach needs to overcome the 0.0192 high volume level.
In that case, a bullish daily candle above the 0.0195 static resistance level could increase the price toward the 0.0265 level. On the other hand, a bearish pressure and a daily candle below the 0.0146 level could lower the price towards the 0.0120 level.

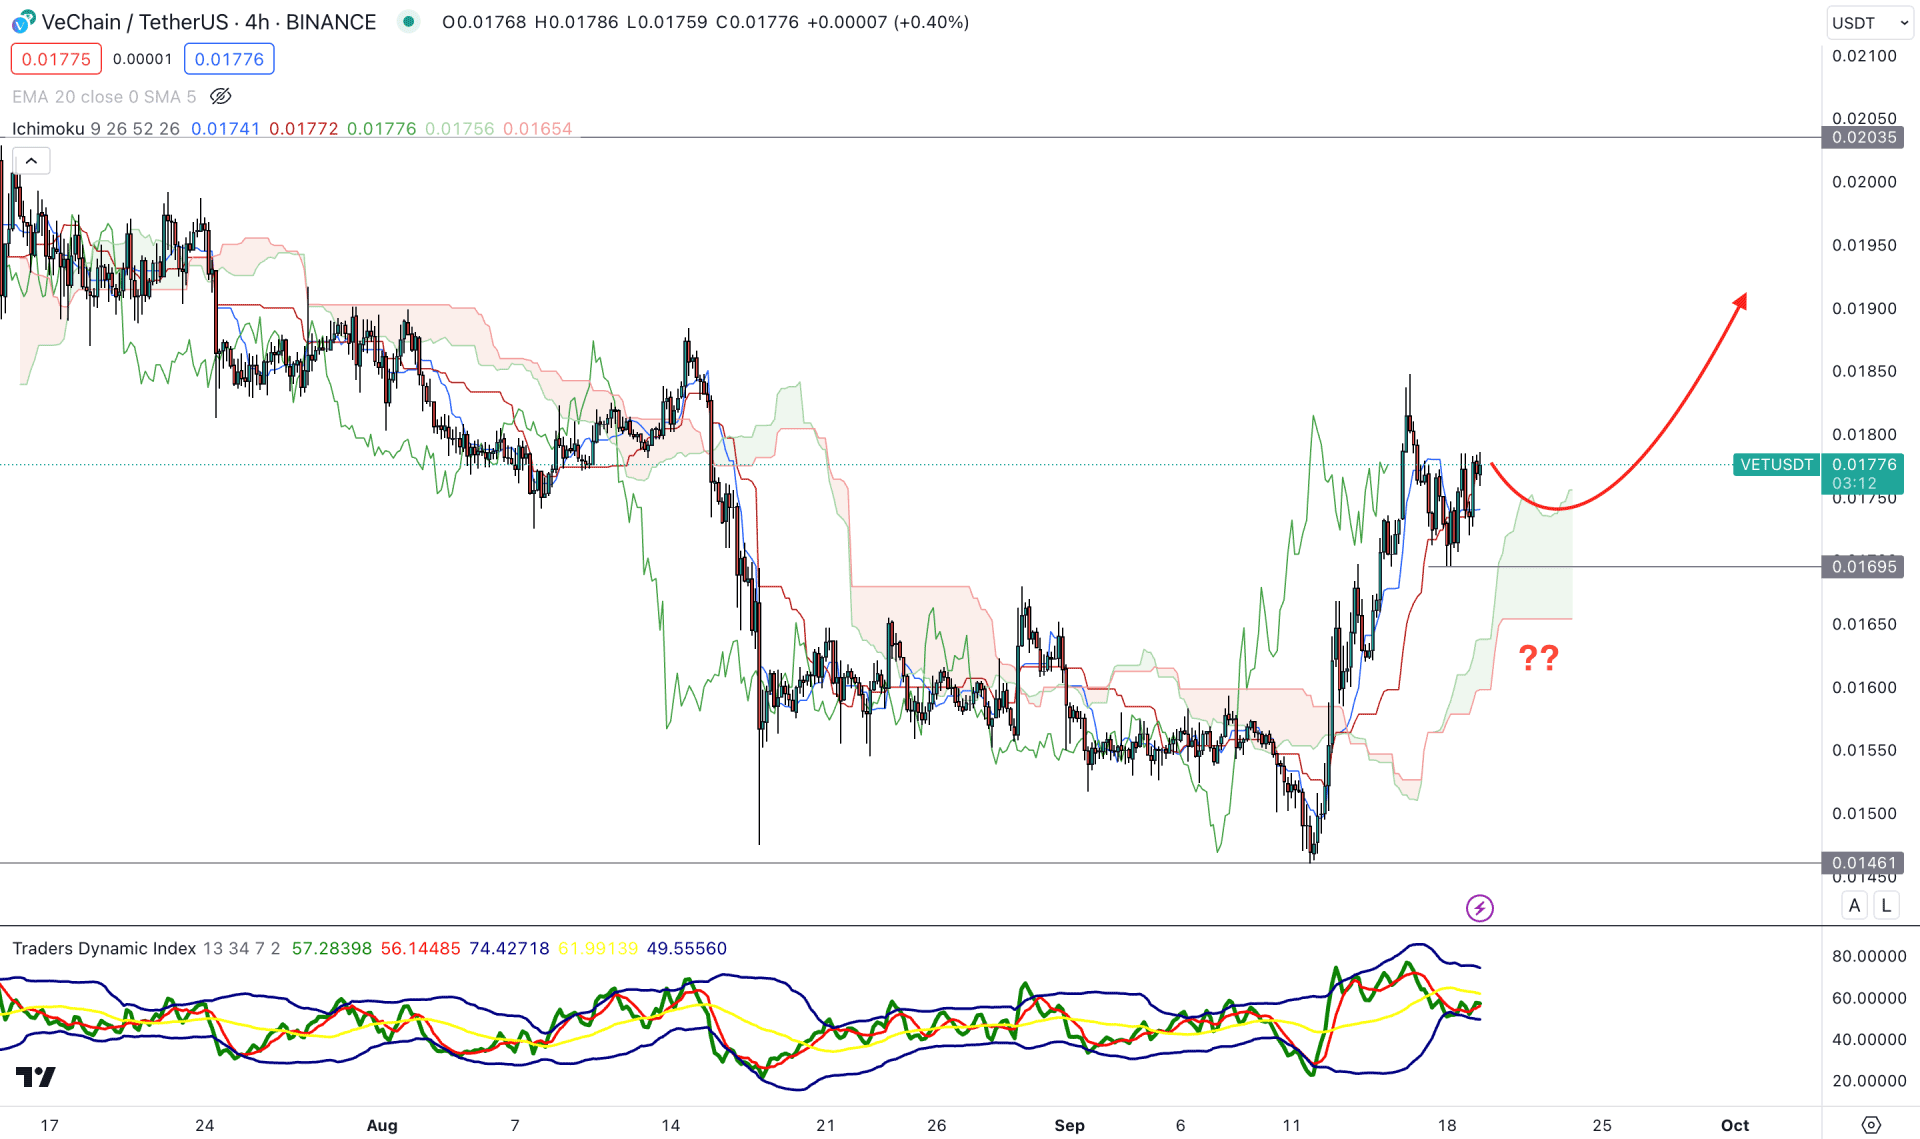
In the H4 timeframe, the overall market momentum is bullish as the current price trades above the Ichimoku Kumo Cloud after grabbing sell-side liquidity from the 0.0147 low.
In the future cloud, the Senkou Span A moved higher above the flat Senkou Span B, which signals active buying pressure from short-term bulls. Moreover, the current Traders Dynamic Index (TDI) level shows a neutral pressure at the 50.00 line, which indicates an active buying volume.
Based on the H4 structure, investors might find a bullish continuation opportunity after having a bullish rejection from the dynamic Kijun Sen level. In that case, the upside pressure for this pair could extend toward the 0.0203 level.
On the other hand, a break below the Ichimoku Kumo cloud area could initiate a consolidation, which needs more clues before forming a stable trend.

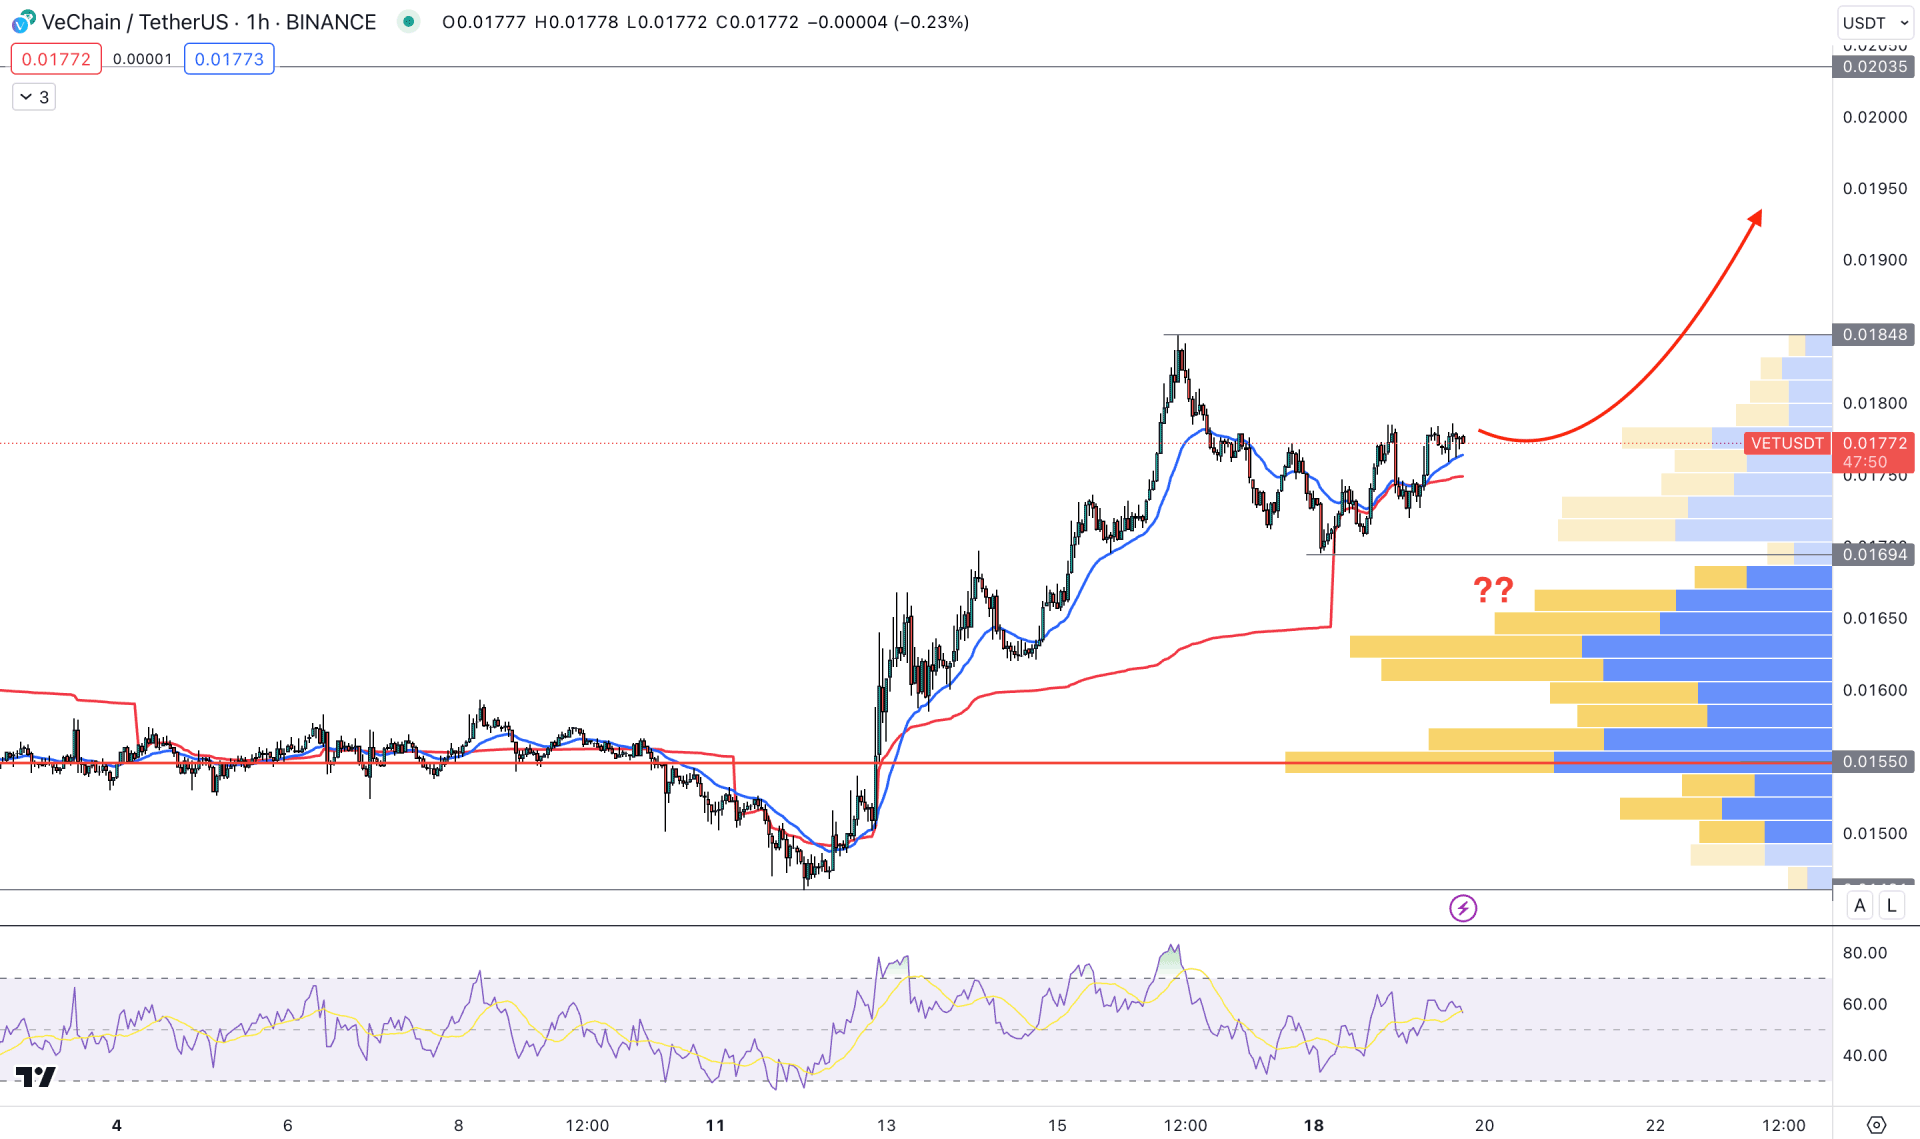
In the H1 timeframe, the overall market pressure is bullish as the current price trades above the visible range high volume level. Moreover, the dynamic 20 EMA and weekly VWAP works as immediate support, indicating an active market buying pressure.
Based on the current intraday price action, an active buying pressure is present, which could increase the price towards the 0.0200 level. On the other hand, a deeper discount towards the 0.0160 level is possible, but a bearish H1 candle below the 0.0150 level could eliminate the current market structure.
Based on the current multi-timeframe analysis, the overall market pressure is corrective, where a strong bullish breakout is needed before forming an impulse. Therefore, investors should closely monitor the intraday price action to find an early buying opportunity.