
Published: September 25th, 2020
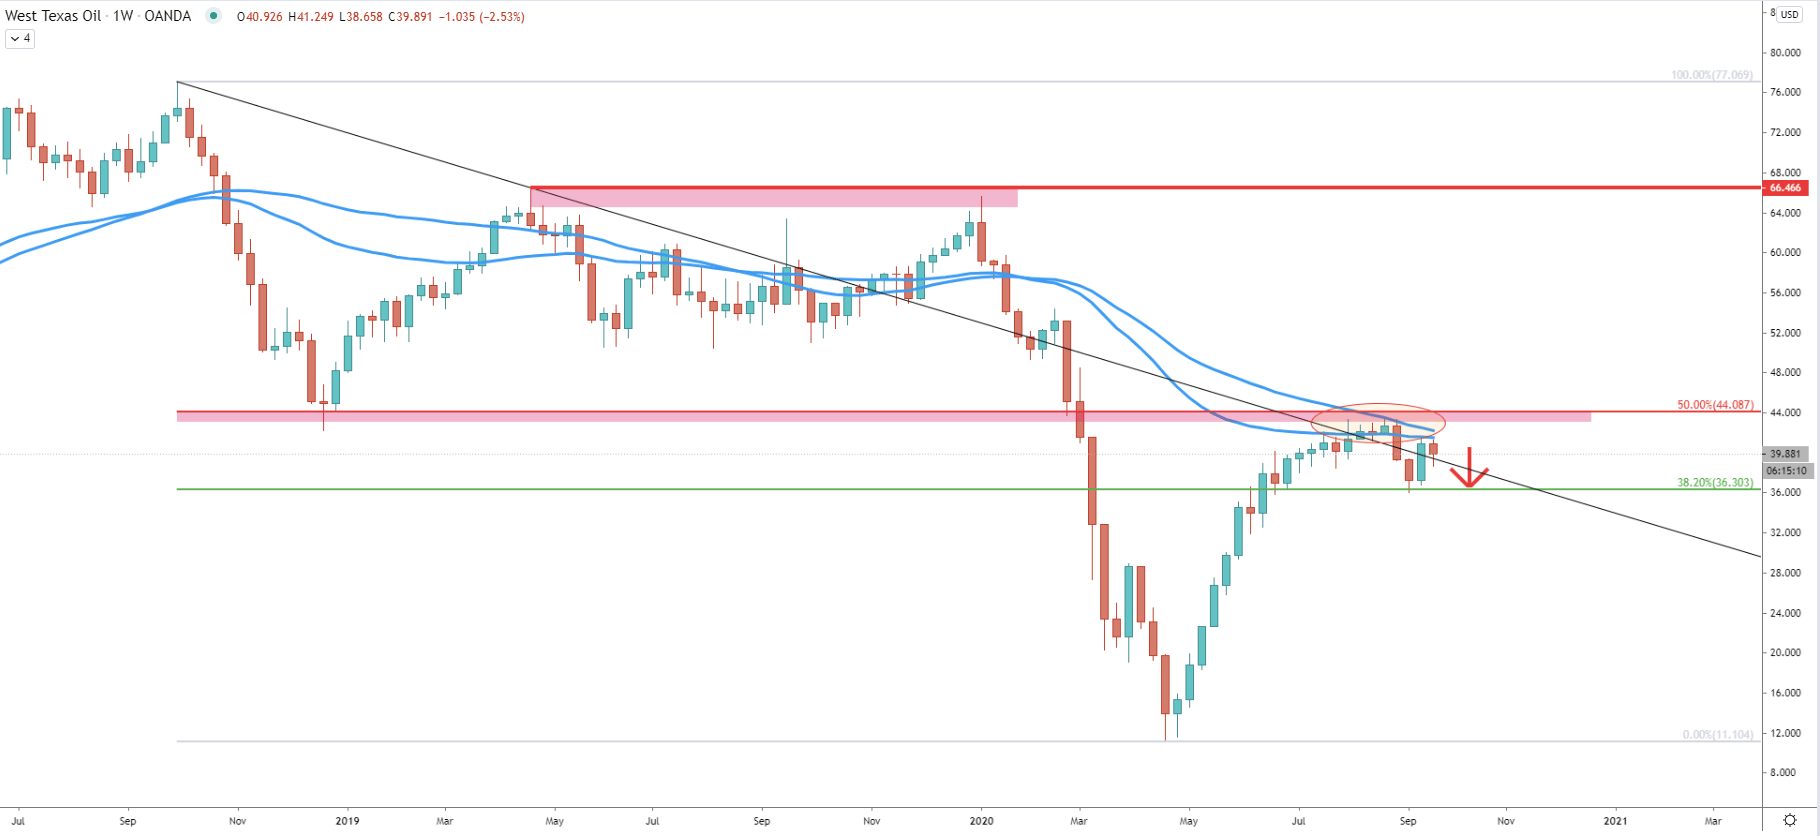
WTI long term trend remains bearish as the price has rejected the downtrend trendline as well as 200 Simple and Exponential Moving Average early this month. The previous area of support near 44.00 psychological level, which corresponds to the 50% Fibonacci retracement level, clearly has been acting as the resistance recently. Perhaps it will remain the key level in the medium to long term, which bears were defending strongly. As long as WTI/USD stays below this resistance, the downtrend will remain intact.
While there might be a substantial price decline in the coming weeks, the nearest support is not that far away. It is located at 38.2% Fibs near 36.00 and already acted as the resistance just a few weeks ago. It is highly likely that USOIL will move down to re-test this support area as long as the resistance is being respected.
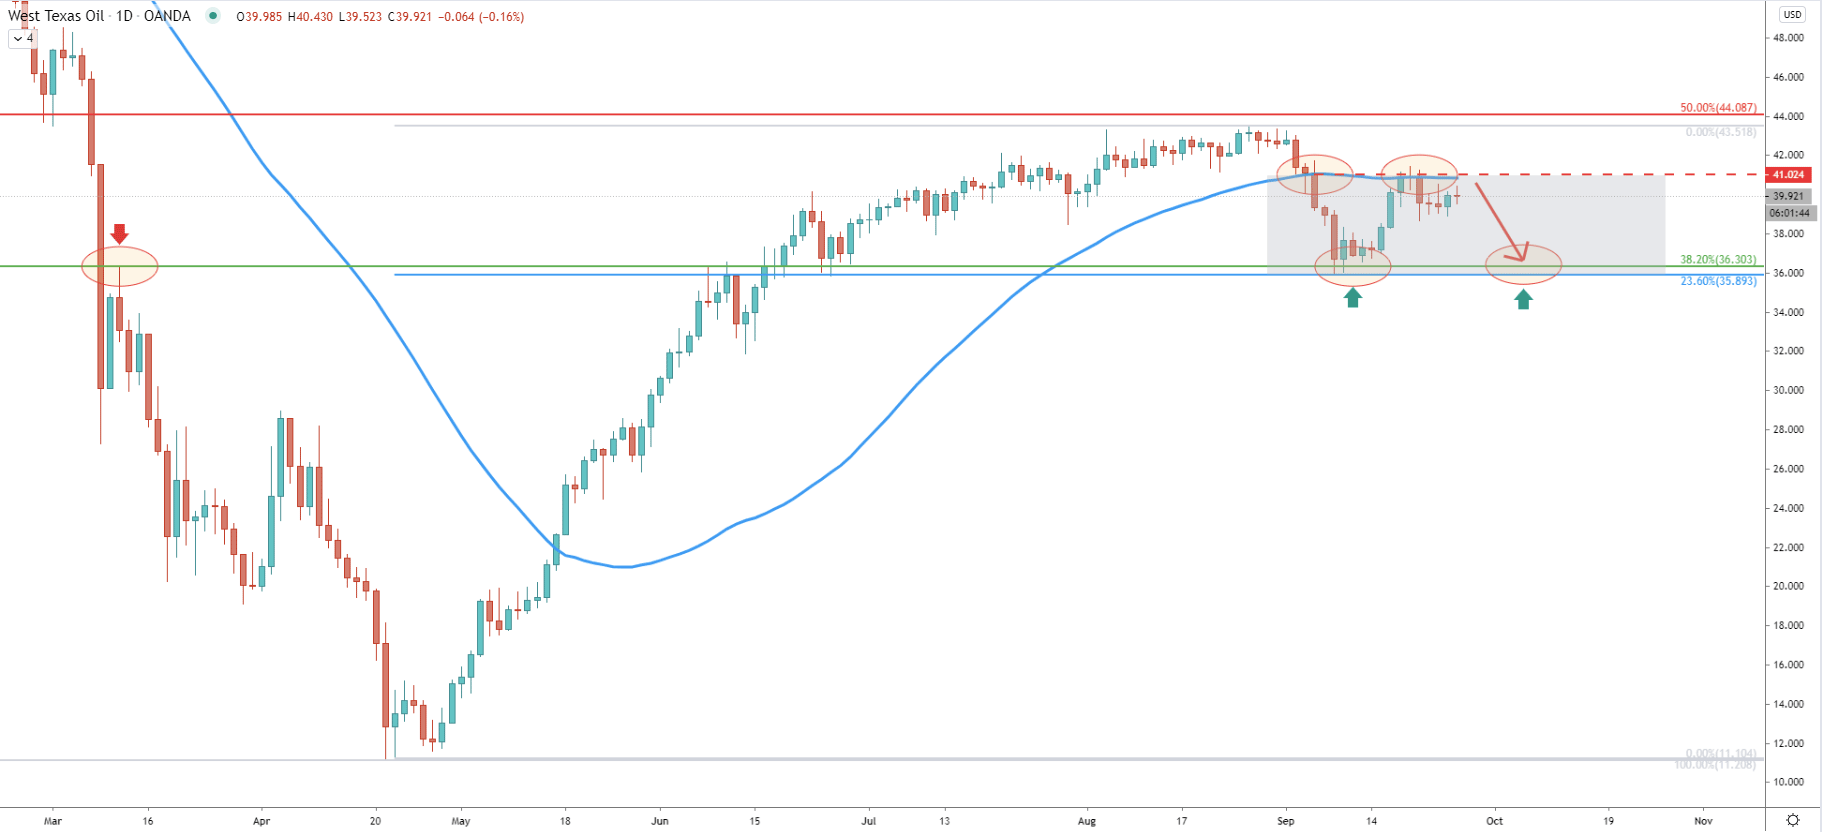
The long term range has been formed between 44.00 resistance and 36.00 support. Currently, the price has reached and so far rejected the 200 Simple Moving Average at 41.00. This level also corresponds to the breakout point of the 200 SMA, which occurred just a couple of weeks ago.
The shorter-term range zone is now between 41.00 resistance and 36.00 support. The support is confirmed by 2 Fibs, the first is the 38.2% as per the weekly chart, and the second is 23.6% Fibs applied to the overall corrective move to the upside which took place between April -September.
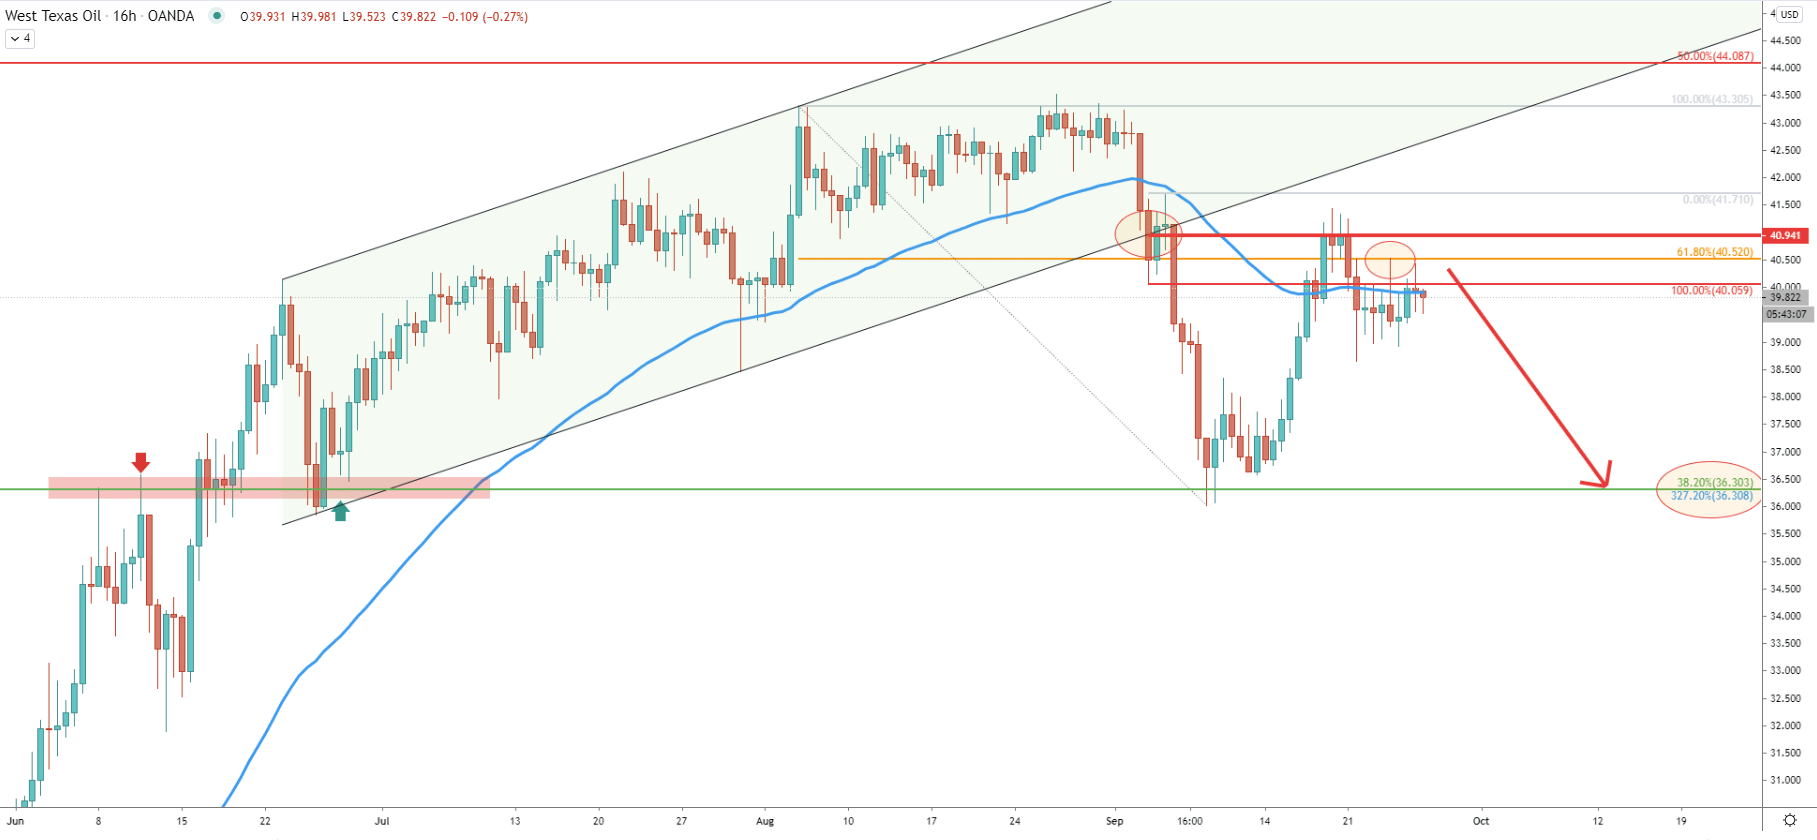
The ascending channel has been broken early this month, and the price went down sharply. It has tested a strong supply/demand zone near 36.00 formed during the previous 4 months. The pull back up followed and WTI has reached the channel breakout point, which was successfully rejected. The most recent price action shows the clean rejection of the 61.8% Fibonacci retracement level applied to the last move to the downside, from 43.00 down to 36.00 area. This Fib was rejected along with the 50 SMA, suggesting a strong selling pressure.
It seems like 41.00-41.50 is the key short-term resistance area and as long as daily closing prices remain below, WTI selling pressure will continue to increase. As has been mentioned, the price might drop down to 36.00 support, which on this chart is also confirmed by 327.2% Fibs applied to the corrective wave up after breaking the ascending channel.
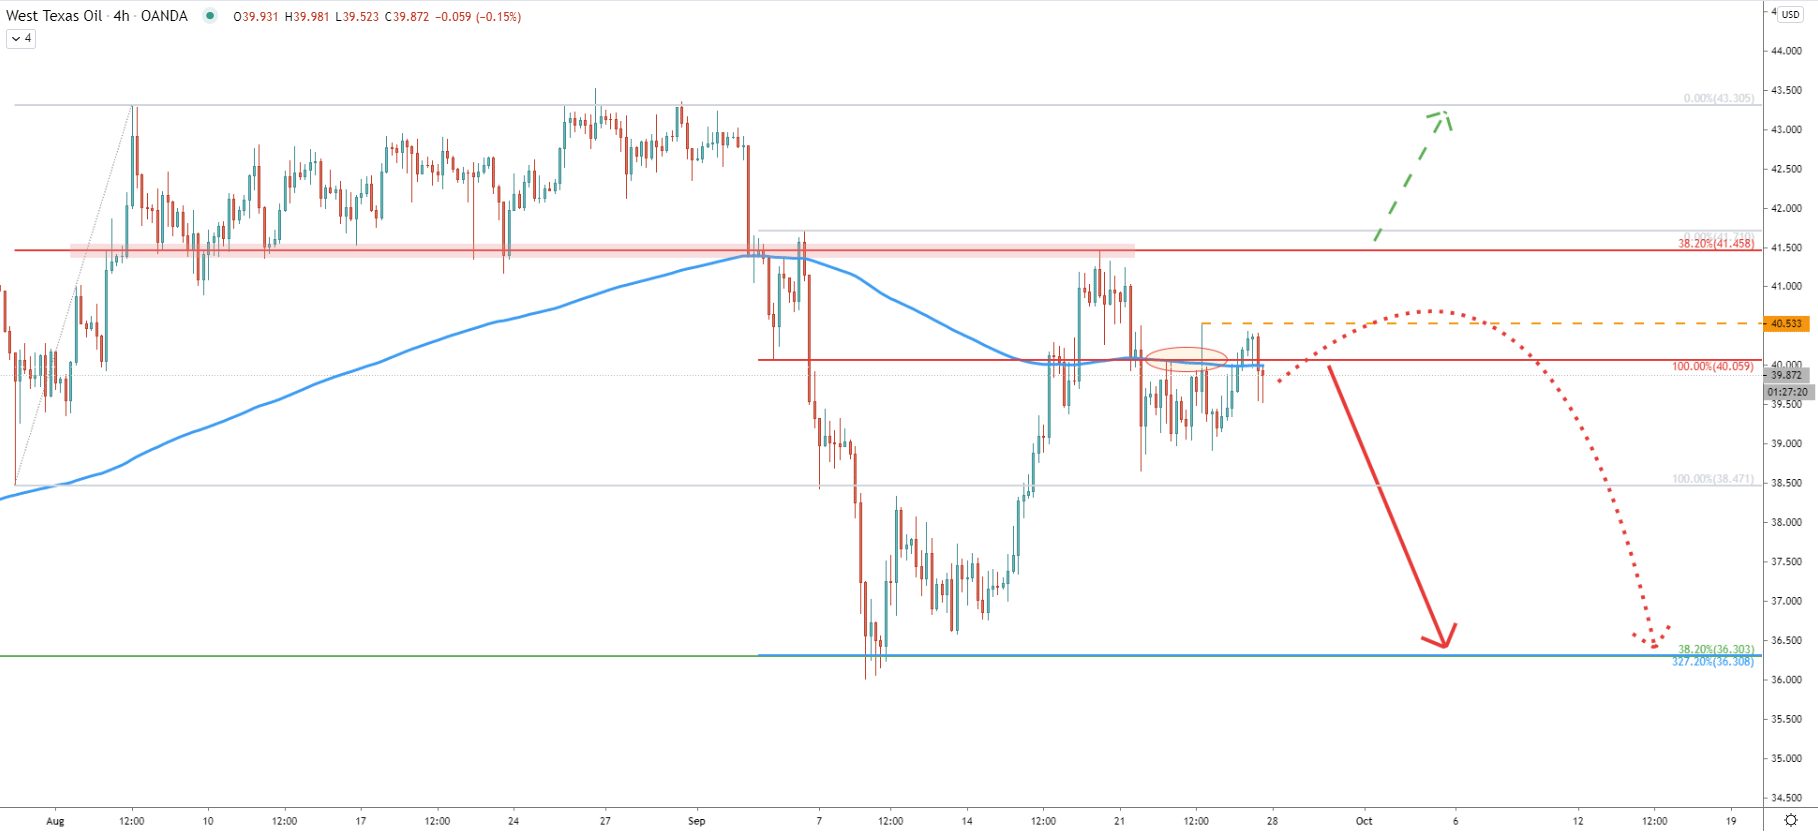
The Fibonacci applied to the last wave up, where WTI has topped out, shows that the 38.2% retracement level at 41.45 has been rejected cleanly on September 23. Then price broke below the 200 EMA and right now it is acting as the resistance, right at 40.00 psychological level.
While the trend remains bearish, there could be attempts to break above the 40.53 high, which was the top of the spike produced above 40.00. If there will be 1h and 4h break and close above 40.53 level, USOIL consolidation could be extended further, but this will not invalidate the bullish forecast.
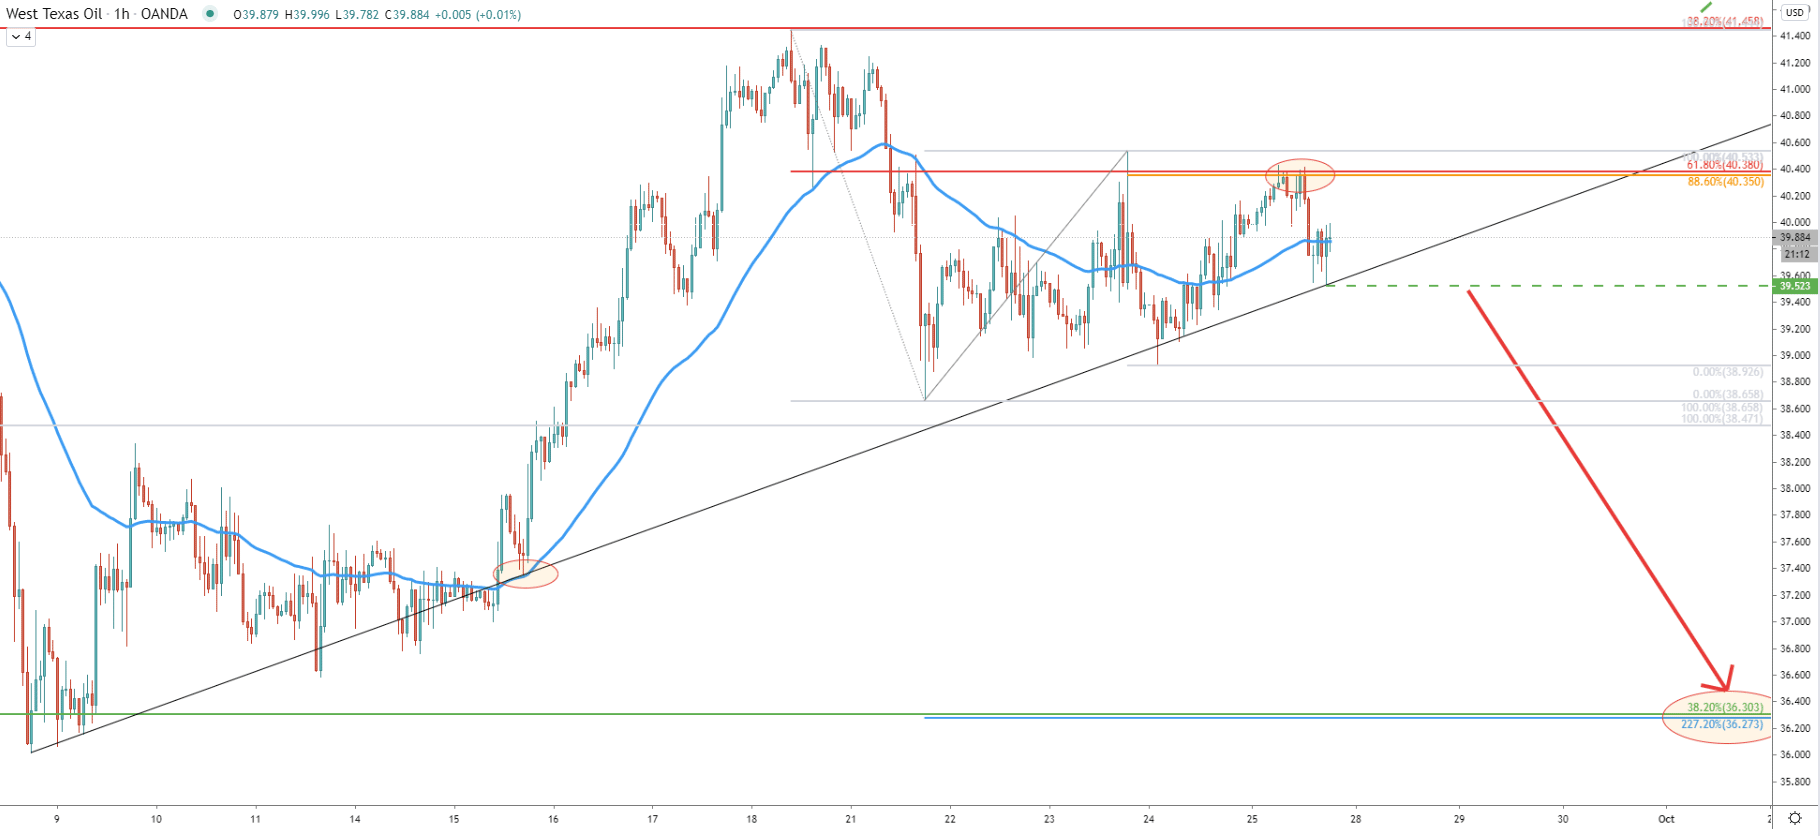
The hourly chart shows that today WTI rejected two Fibonacci retracement levels at the same time. The first was 61.8% Fibs applied to the last wave down and the second was 88.6% Fibs applied to the recent corrective move up. It is extremely clear that the resistance has been respected although price bounced off the simple uptrend trendline.
Perhaps for selling pressure to increase even further, there must be a break below the 39.52 support, which is the level of the last rejection of the trendline. If/when this will occur, the price could be starting to move down under a heavy trading volume. And finally, on this chart the 36.00 downside target area is also confirmed by 227.2% Fibs, applied to the September 21-23 correctional wave up.
USOIL is keeping on rejecting multiple resistance levels and indicators, suggesting the validity of the downtrend. As long as daily closing prices remain below 41.45, downside pressure will remain high, potentially resulting in the price drop towards the 36.00 support area.
On every chart in this analysis, there is at least one Fibonacci retracement level which is confirming 36.00 support. This makes it 5 Fibs, pointing out to nearly exactly the same level, and making it an extreme area of demand.
As per the 4-hour chart, only a daily break and close above 41.45 will completely invalidate the bullish forecast. This will not necessarily mean that the uptrend will start, but most likely such price action will initiate an extended consolidation phase that might take place between 40.00 - 43.00.
Support: 39.50, 36.30, 36.00
Resistance: 40.00, 41.00, 41.45, 43.50