
Published: June 11th, 2026
The USDJPY pair is trading flat near the 160.53 price area. Concerns that Tokyo would interfere in foreign exchange markets to bolster the Japanese yen (JPY) have caused the pair to stabilize.
Since the pair has returned to levels before the government interfered against one-way excessive movements in the domestic currency, Japan's chances of intervening have increased.
Investors have also moved to the sidelines due to the ambiguity around the Bank of Japan's (BoJ) monetary policy decision, which is scheduled to be announced next Tuesday. The BoJ is anticipated to increase interest rates by 25 basis points, or bps, to 1%, according to the most recent Reuters survey.
The US Dollar Index (DXY) is currently trading 0.13% lower at about 99.95 as investors look for signs that the April truce between the US and Iran is still in effect. In response to Tehran's assaults on a US Apache chopper flying above the Strait of Hormuz, American Central Command (CENTCOM) carried out military operations on several targets in Iran in recent days.
Despite the war-driven volatility, USDJPY could provide a decent trading opportunity from the current event level.
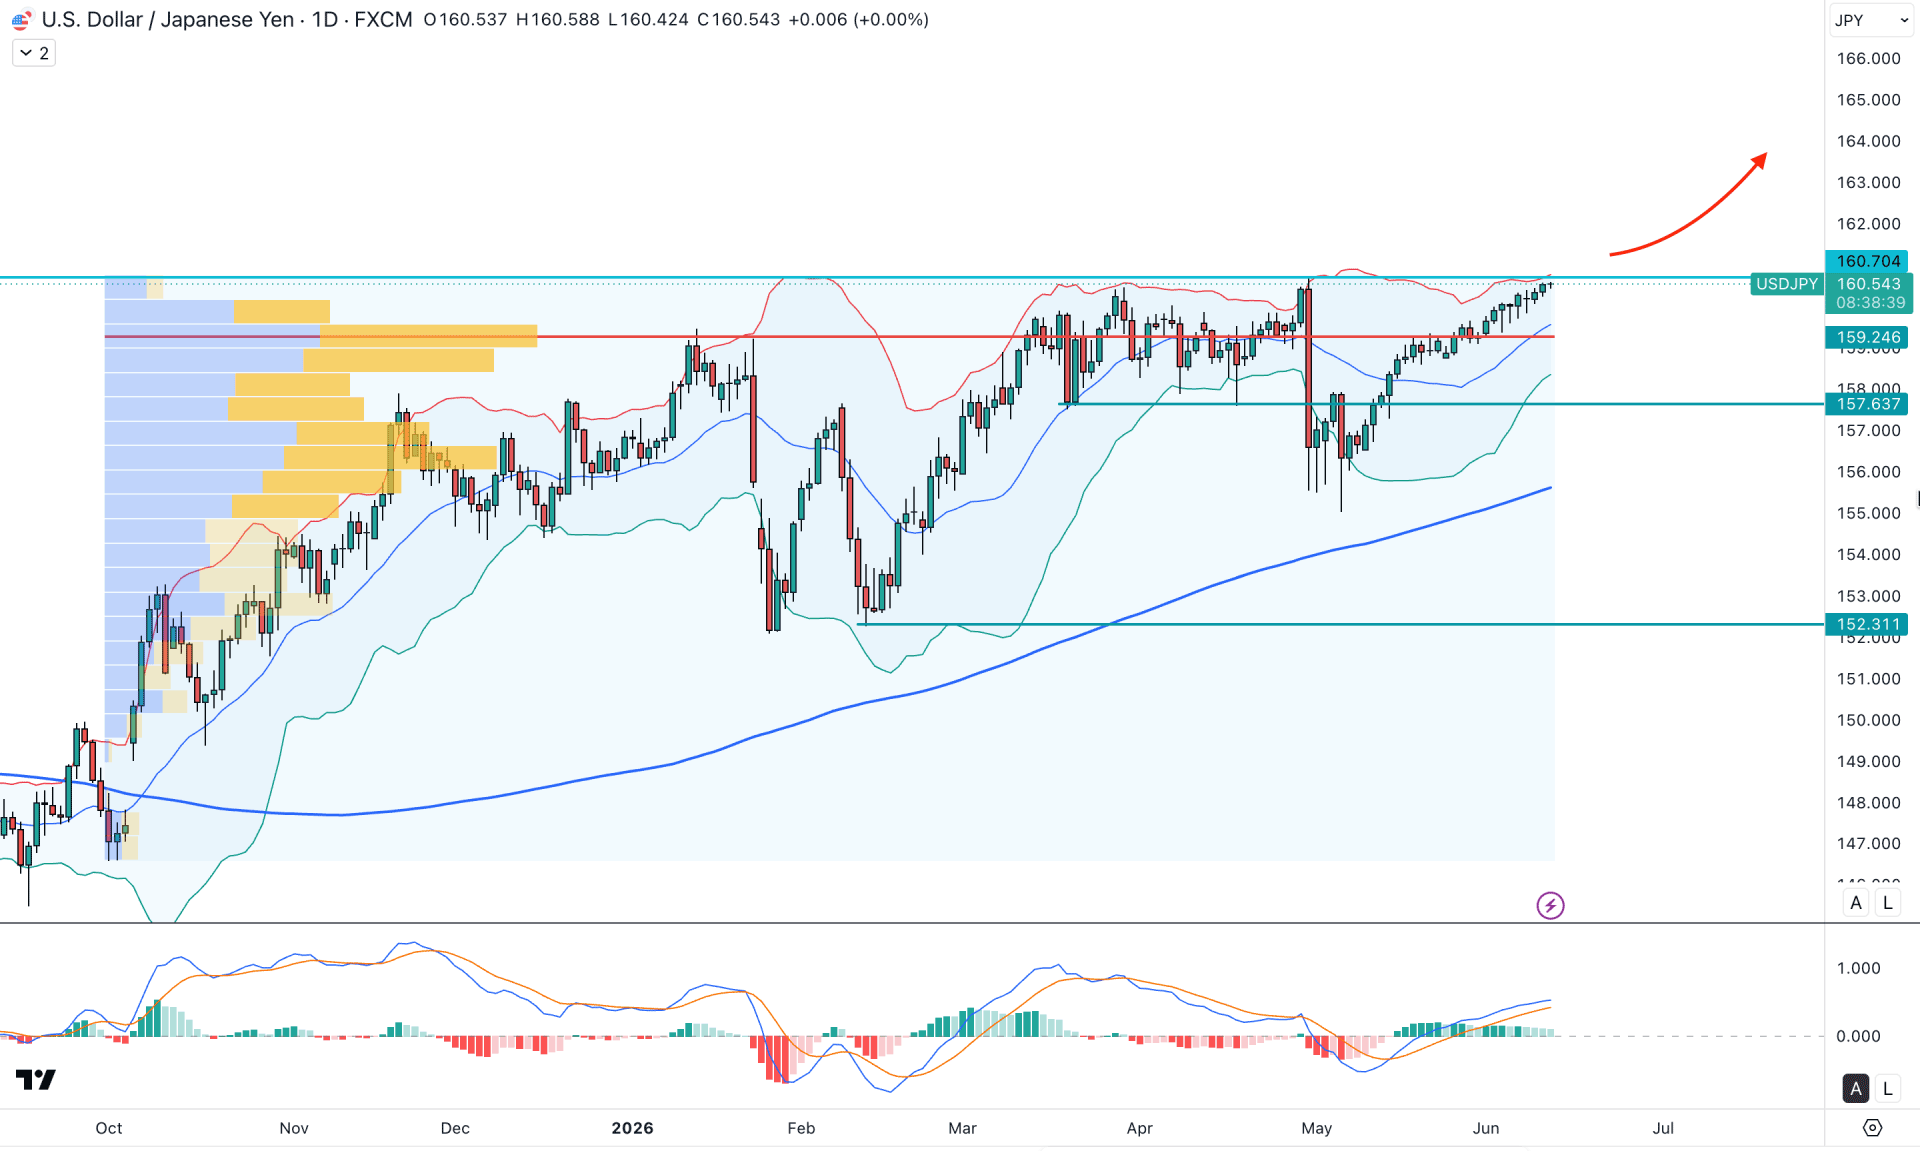
In the daily chart of USDJPY, the major market momentum is bullish as the price keeps rising without creating any significant lower low. However, the most recent price action formed a counter-bearish momentum but failed to sustain the selling pressure below the static support area. As the price rebounds towards the crucial resistance area, a potential breakout is likely.
In the monthly timeframe, the current price is heading upward, followed by a bullish inside bar breakout where the recent price is trading above the May 2025 high. As no significant barrier is visible in the monthly timeframe, the primary anticipation would be to look for long trades only. Moreover, the bullish momentum is validated by the strong V-shape recovery in the weekly timeframe, creating a breakout possibility.
In terms of volume, the buying pressure is also valid as the largest activity level since October 2025 is at the 159.24 level, which is just below the current price. Primarily, multiple bullish daily candles present a crucial support line that can work as a strong bullish opportunity.
In the main price chart, the price keeps rising above the mid Bollinger Band for a considerable time, while the upper band remains flat just above the current daily candle. It is a sign of sideways market pressure, and from where a downside correction is possible.
On the other hand, the 200-day SMA is below the entire structure with a bullish slope, suggesting a major bullish trend. Following the structure shown in the 200 SMA, a major bullish recovery is possible even if the entire structure is slightly bearish in the short term.
The MACD histogram shows corrective buying pressure as the histogram remains above the neutral line for a considerable time. However, the signal line is at the upper peak area, from where a bearish crossover could limit the buying pressure at any time.
Based on the overall market structure, investors should closely monitor how the price trades at the crucial resistance of the 160.70 level. Breaking above this line with a bullish daily candle could open room for a move towards the 167.50 psychological level.
On the other hand, a failure to overcome the upper Bollinger Band with bearish exhaustion at the top could limit the buying pressure at any time. In that case, a bearish recovery is possible where the immediate support is at the 159.24 level.
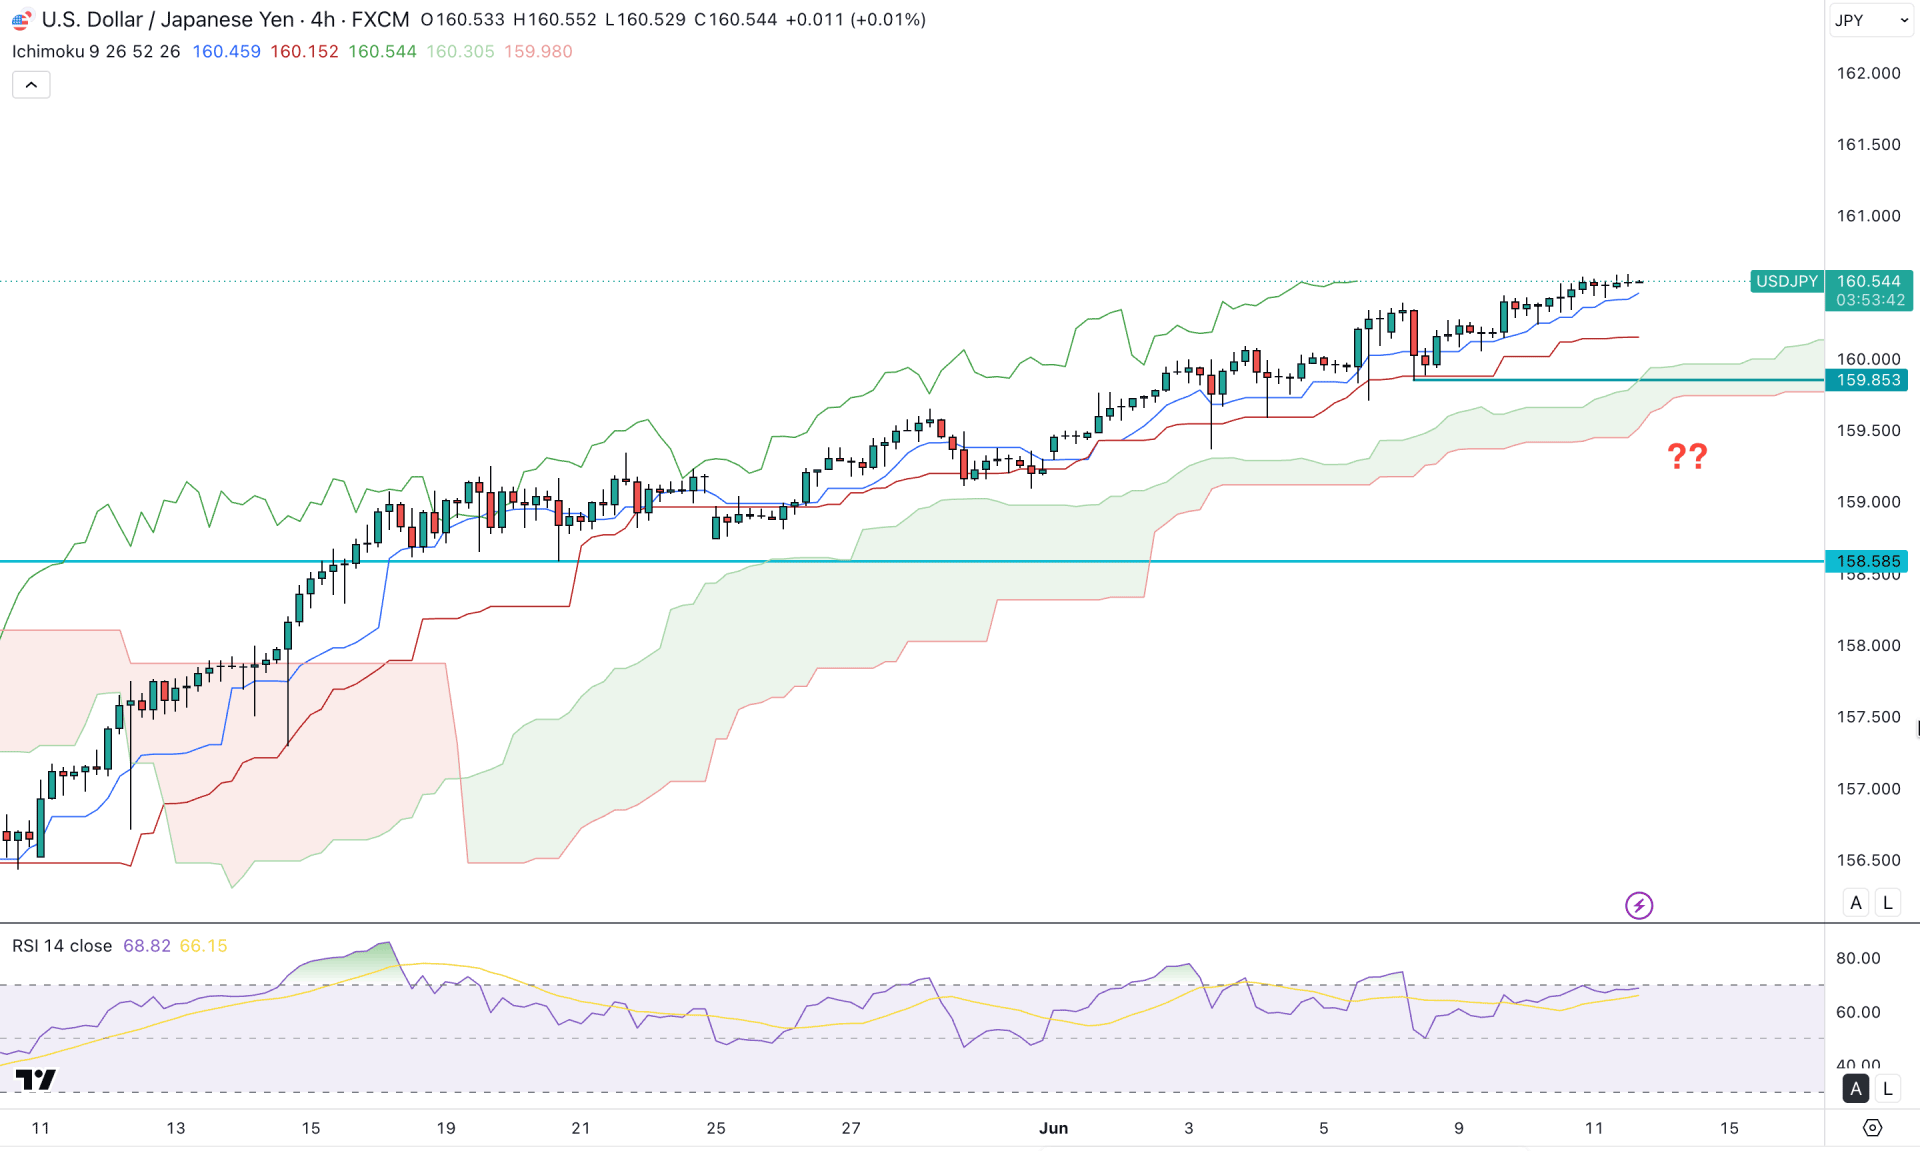
In the H4 timeframe, the recent price is trading above the Kumo Cloud, which suggests ongoing buying pressure. Moreover, both lines in the future cloud keep moving higher, suggesting a confluence of bullish factors.
In the secondary indicator window, the Relative Strength Index (RSI) remains sideways around the 70.00 area, signaling corrective buying pressure.
Based on the overall market structure, sideways momentum is visible around the Kijun-sen support line, suggesting a pending downside correction. The immediate support level to look at is the 159.85 level, which may be tested after violating the Tenkan-sen line.
On the other hand, any bullish rebound from the 160.00 to 159.50 area could resume the existing trend, targeting the 161.50 area.
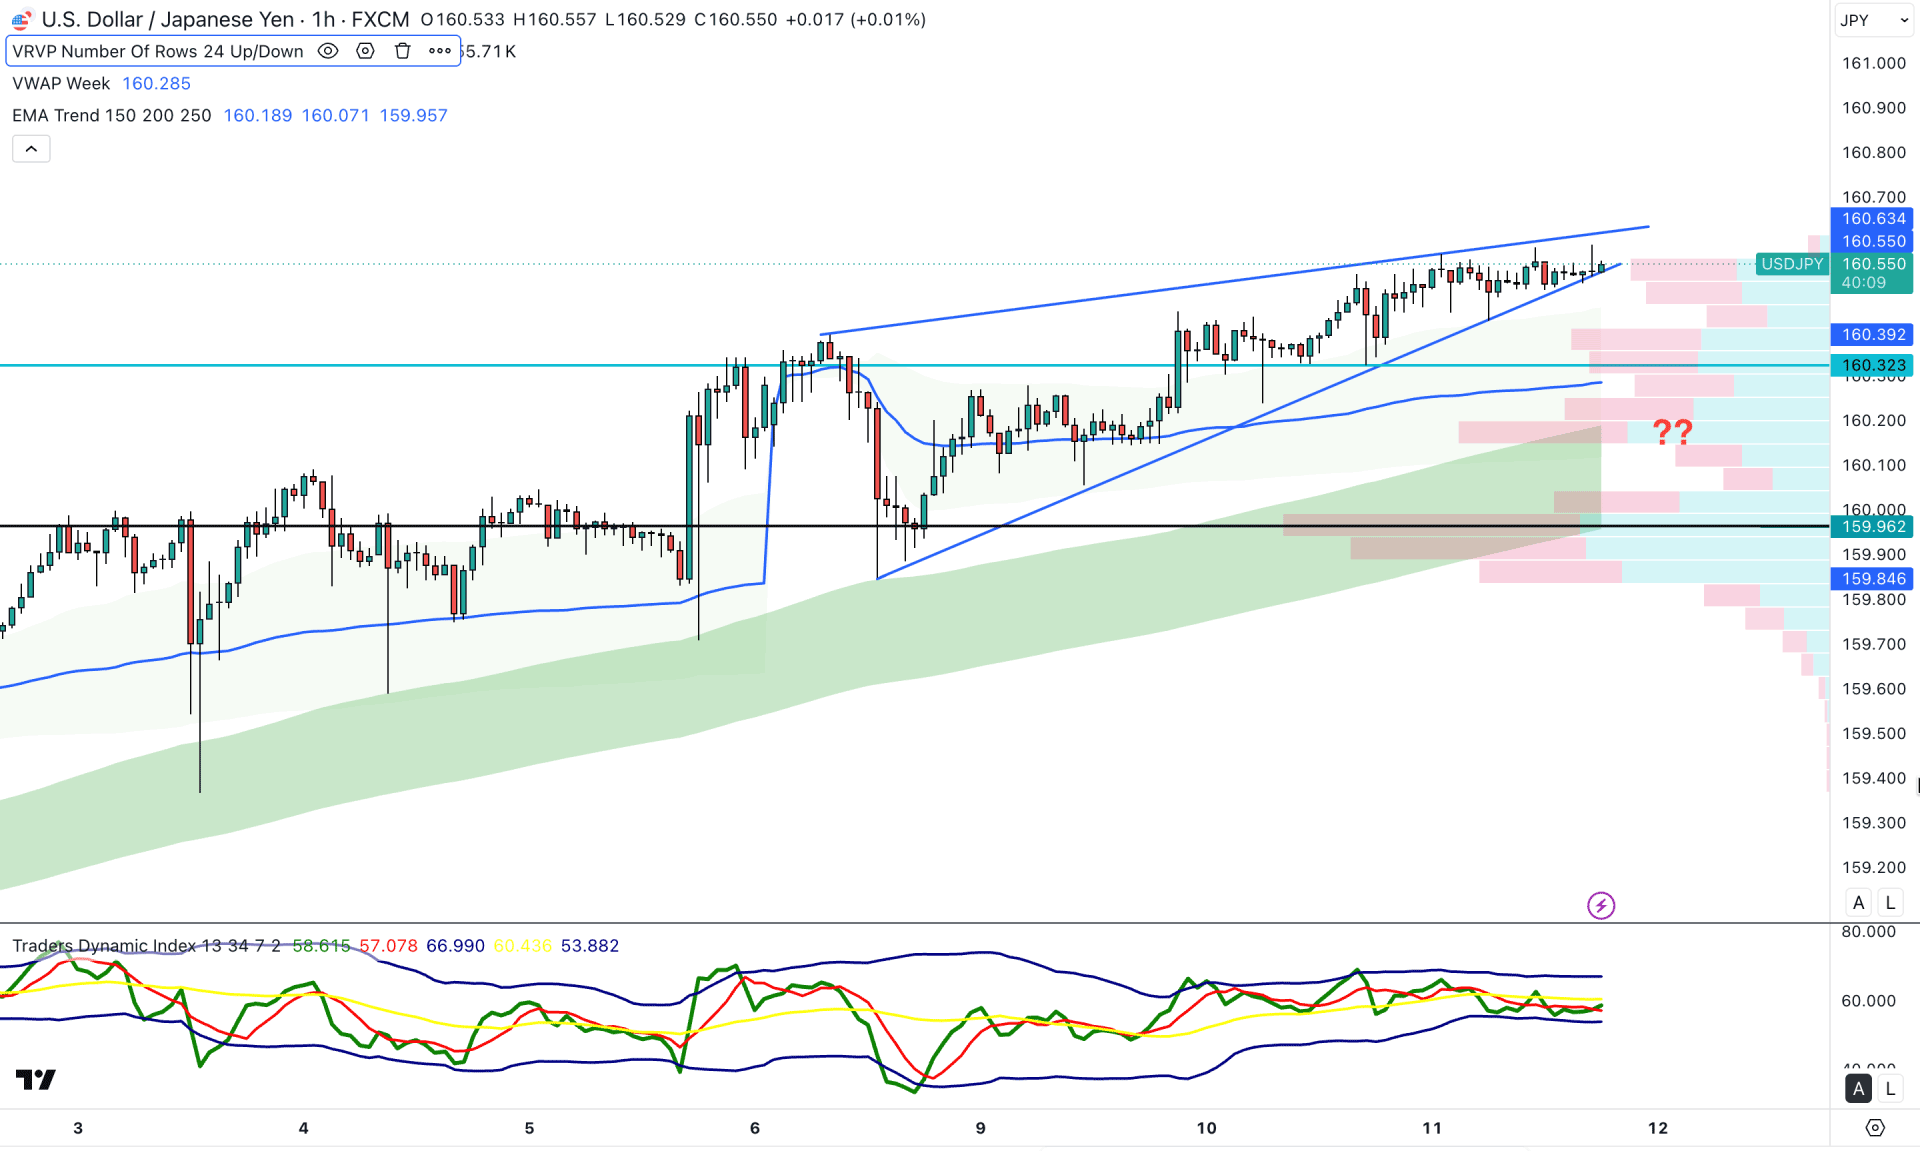
In the H1 timeframe, the buying pressure is visible as the most recent price is trading at the peak. Moreover, the corrective pressure has squeezed the price into an area signaling a breakout possibility. The weekly VWAP level and EMA wave are still below the current price and holding the buying pressure.
The Traders Dynamic Index has rebounded to the bearish region, signaling the first sign of pressure. In that case, rejection at the top increases the possibility of forming a bearish rebound and testing the 160.32 support level. Below this line, the next support level to look at is 159.96.
On the bullish side, upward continuation is possible as long as the price remains above the weekly VWAP line. In that case, a bullish rebound from the trendline support with valid price action can resume the existing bullish trend.
Based on the overall market structure, USDJPY is trading bullish within a pre-breakout structure. The daily trend remains bullish, while the intraday price is extremely sideways at the top. It is a sign of a potential liquidity grab at the intraday support area. In that case, a downside rebound with a valid recovery could offer an early long opportunity.


