
Published: September 29th, 2021
Fumio Kishida has won the next Japanese Prime Minister under the LDP leadership. He is considered moderate and experienced in different positions. However, Japanese Yes continues to weaken after the leadership news comes with the rising US bond yields.
As per several analysts’ opinions, the Kishida victory would bring a positive outcome for JPY, given he is a candidate who is likely to change the near-term Japanese policy. As a result, the overall volatility in JPY may become softer.
In the price chart, USD/JPY is losing its upside pressure amid the retreat in the US Treasury yields. On the other hand, the Bank of Japan announced a purchase of JPY 70.1 billion Exchange-traded-funds this week that may intervene in the USD/JPY price by a major pullback.
Let’s see the upcoming price direction from the USD/JPY technical analysis:
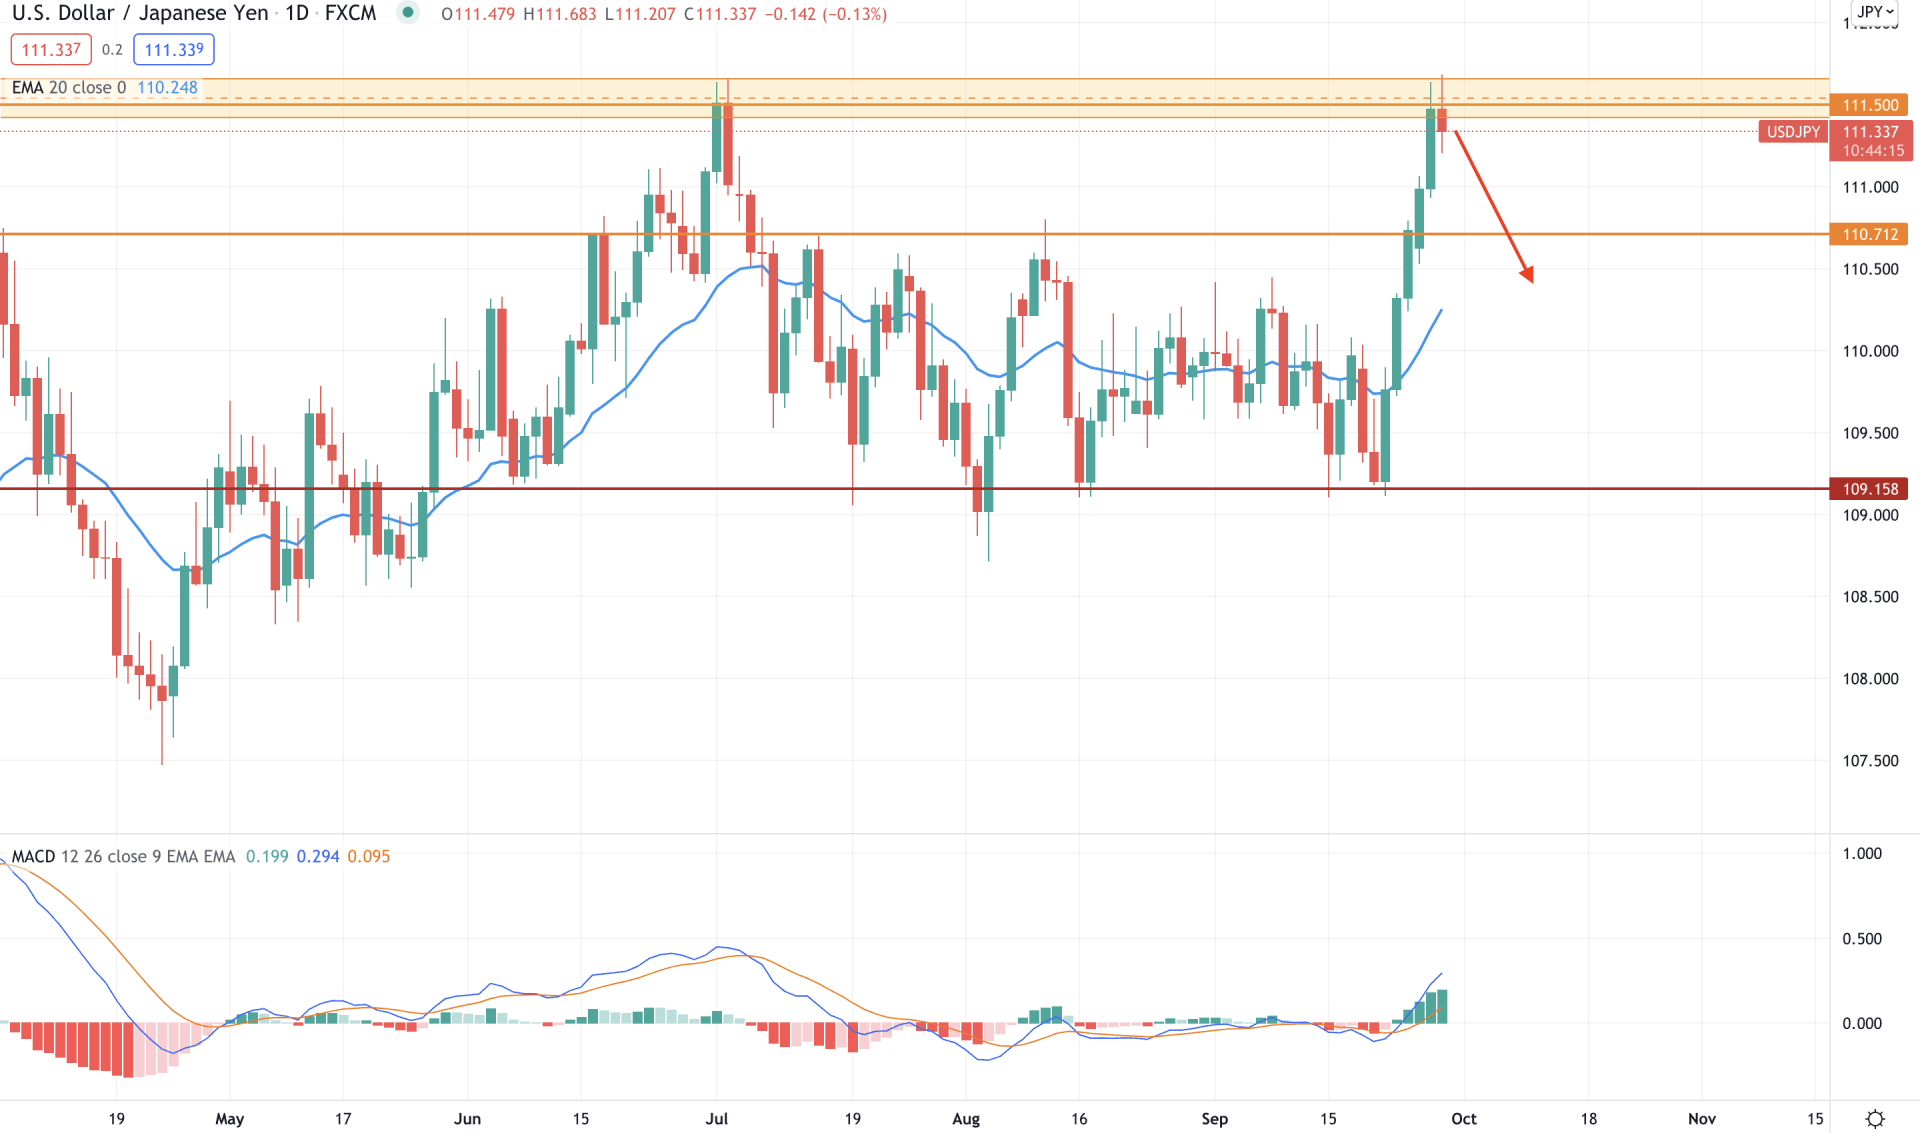
USD/JPY passed a long consolidation from 110.71 high to 109.15 low for a considerable time. After that, the price tried to break the level in either way but failed. However, September came with a blessing that pushed bulls to regain momentum by breaking above the 110.71 horizontal level with a bullish impulsive pressure. However, the extreme bullish pressure extended the gap between the price and dynamic 20 EMA.
The above image shows that the price is trading below the 111.50 key resistance level and showing bearish pressures. Moreover, the institutional order flow from 111.70 to 111.40 area has a higher possibility of regaining the momentum and decreasing the price. Although the MACD Histogram is bullish, there is a huge gap between the price and dynamic 20 EMA. Therefore, a strong mean reversion to the bearish side is highly possible for the coming days.
Based on the daily context, a bearish daily close below the 111.20 level may indicate institutional selling pressure that may lower the price towards the 110.50 area. On the other hand, a break above the 111.70 level would alter the current market structure, but investors should wait for further indications about the selling opportunity.
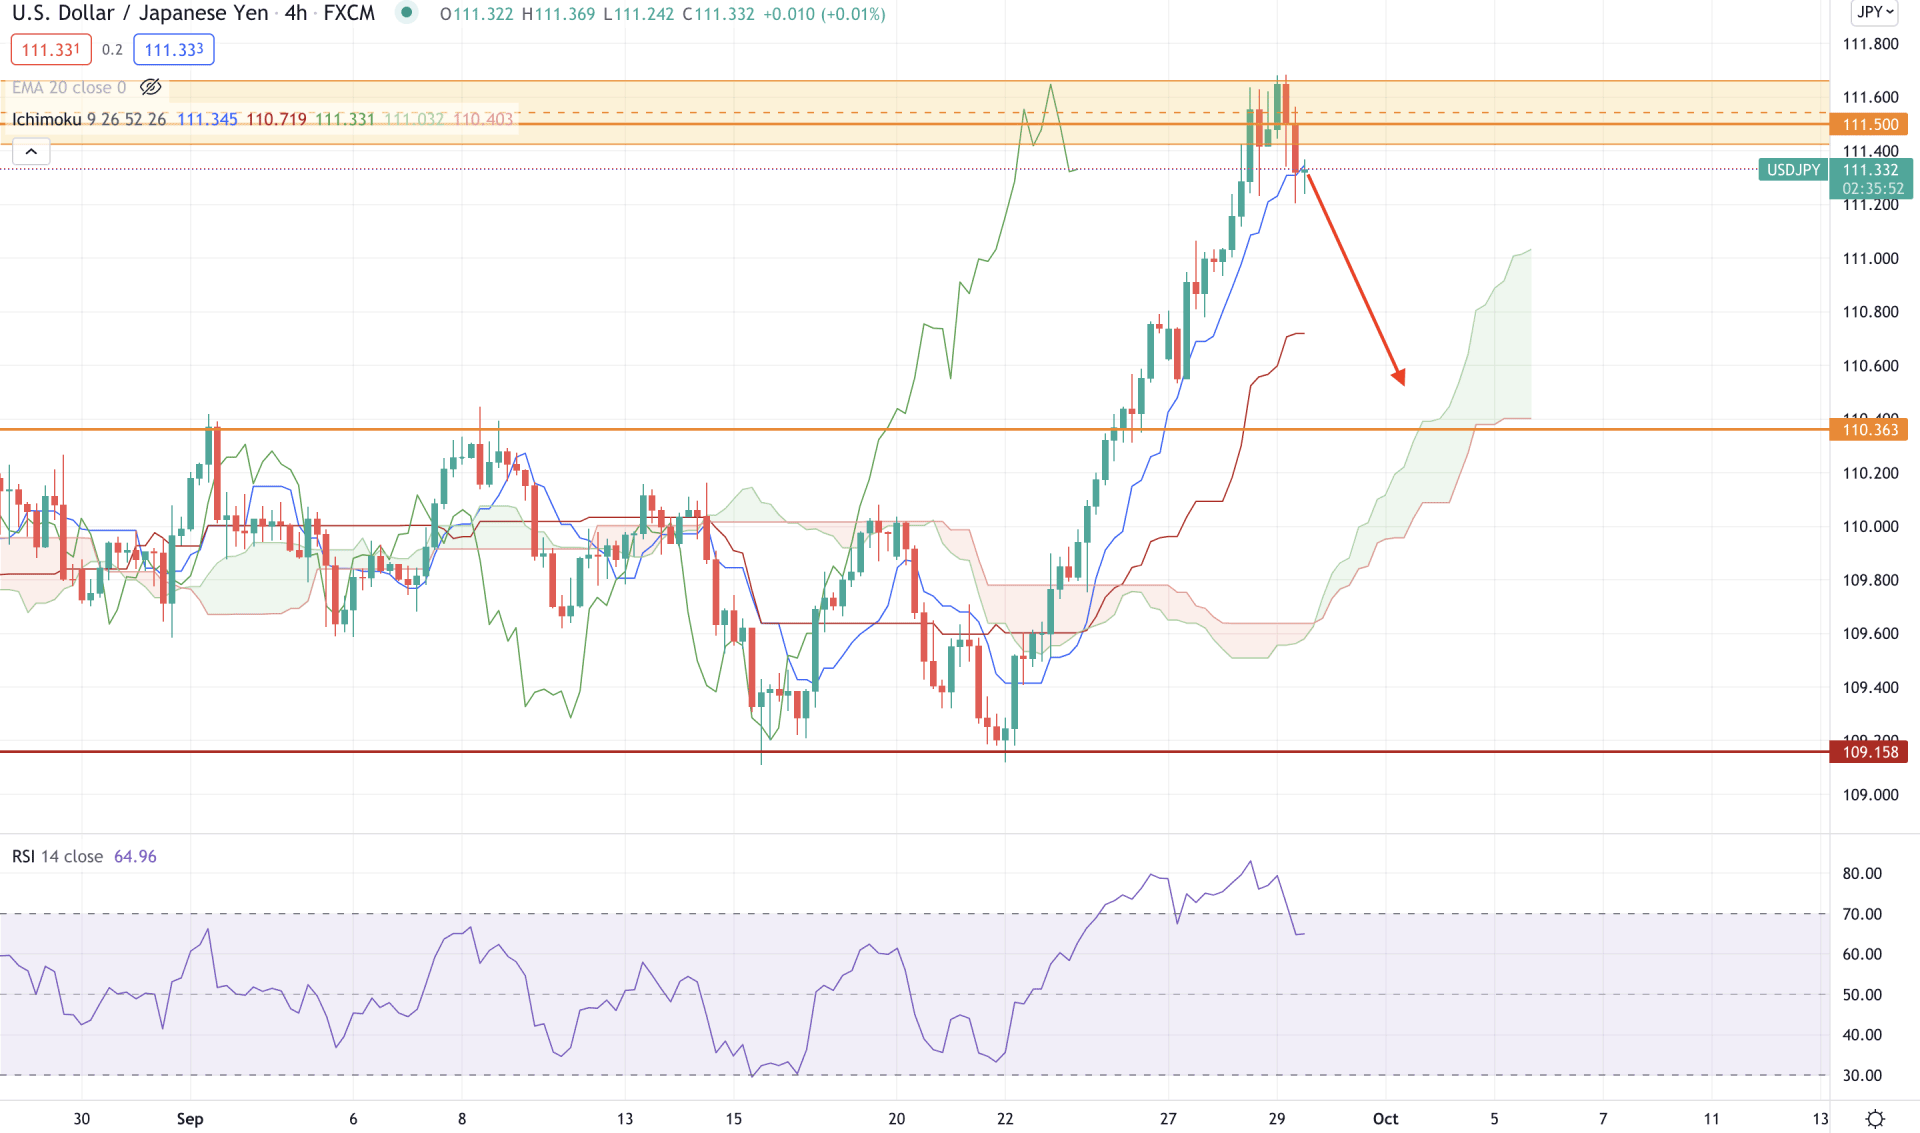
In the H4 chart, USD/JPY is extremely bullish as the gap between the price and dynamic Kijun Sen extended. Moreover, the future cloud is bullish where the price moved too far from the Kumo cloud. In that case, investors may experience a bearish correction towards the 110.36 horizontal support level in the coming hours.
The above image shows that the RSI line moved above the 70 levels but rebounded lower, pointing out that bulls have started profit-taking. In that case, a bearish H4 close below the dynamic Tenkan Sen would increase the selling pressure for the coming US Session.
Overall, the H4 context is bearish, although the price is moving up within an uptrend. A break above the 111.70 level with a bullish H4 close may increase the price volatility, where investors should remain skeptical while taking trading decisions.
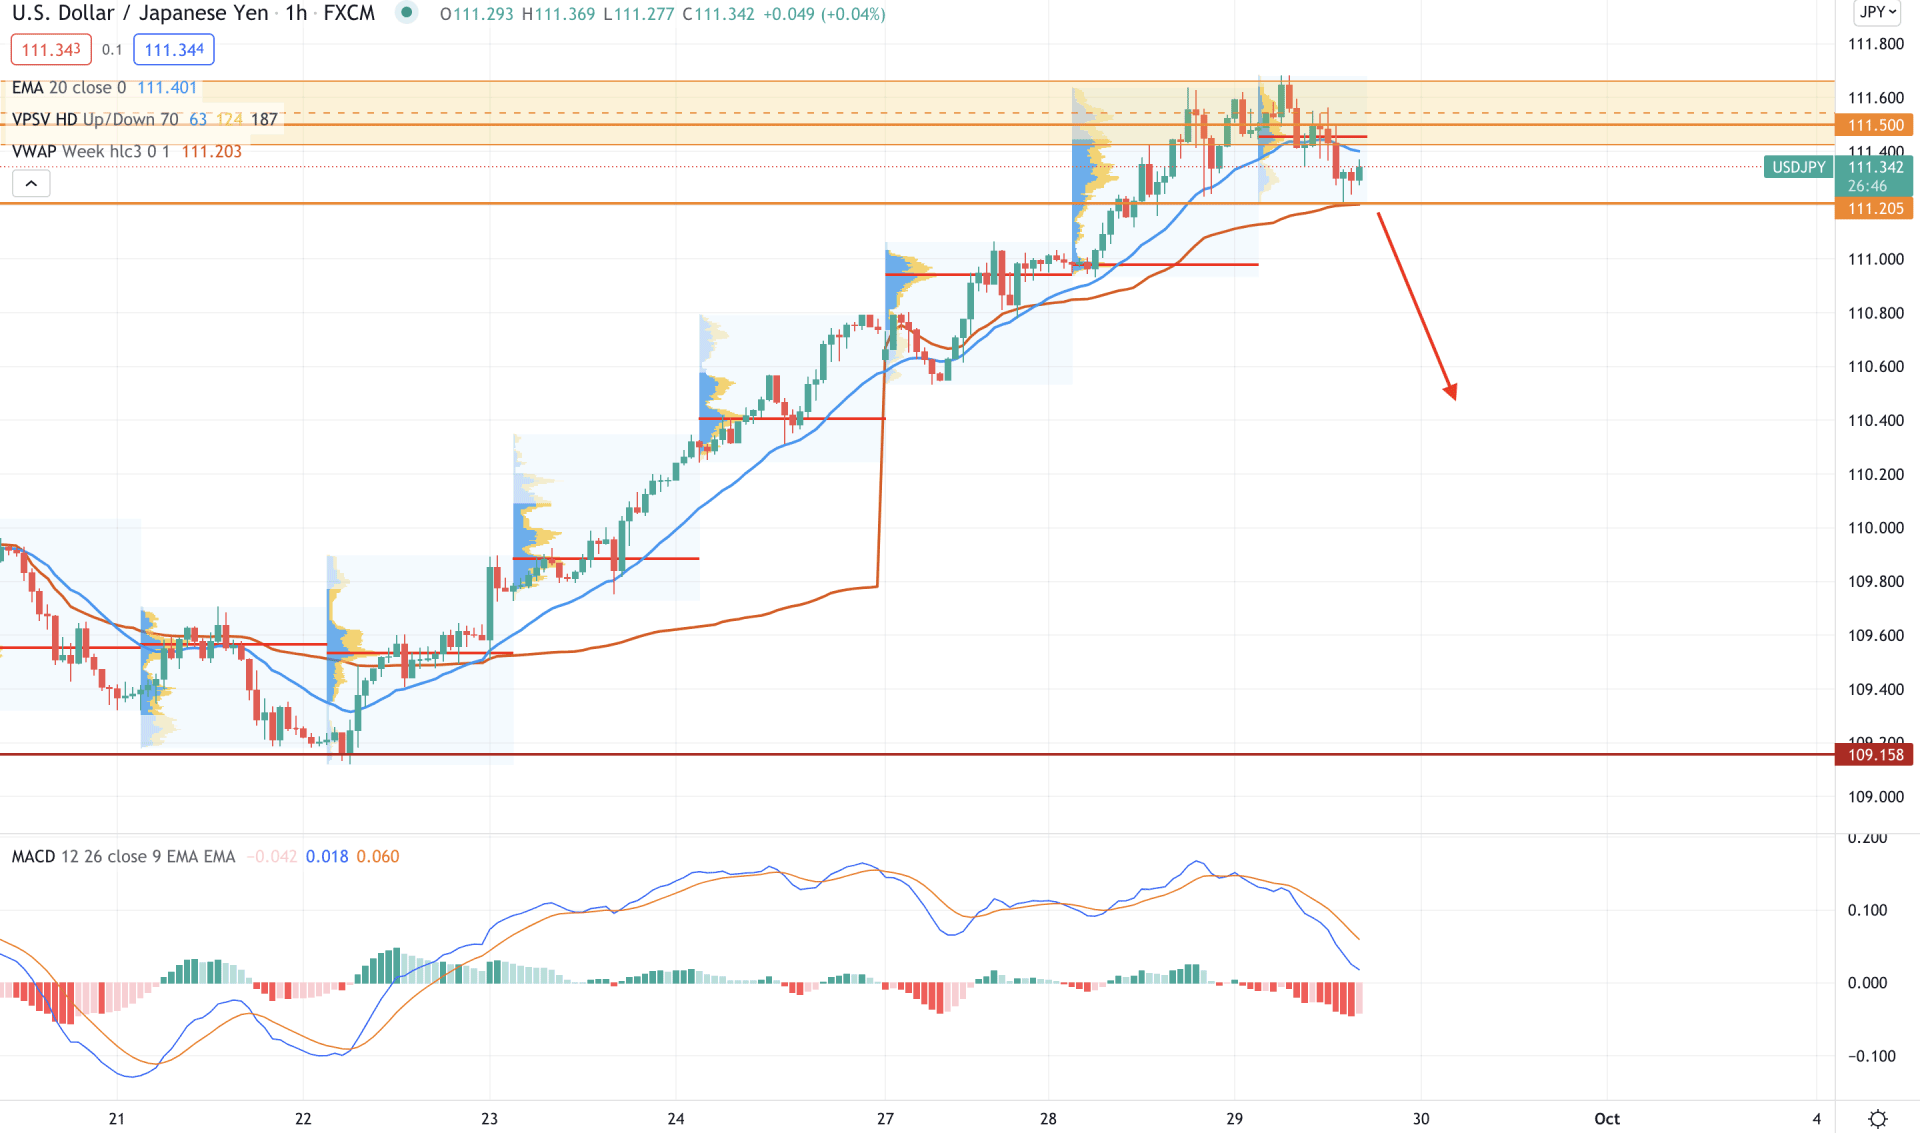
USD/JPY became volatile in the intraday chart after reaching the 111.50 supply area, which pushed the price below the dynamic 20 EMA. Moreover, the intraday bearish pressure became strong as the price moved below the high volume level of 111.40.
The above image shows that the price is moving higher by creating higher highs where a selling possibility requires additional attention. Still, the price is above the 111.20 intraday support level and weekly vwap. Therefore, as long as the price is above the intraday vwap, the overall outlook is bullish that may extend above the 111.70 level.
On the other hand, the MACD Histogram is bearish and making new lows, which signifies sellers’ presence in the price. In this context, investors should wait for a bearish H1 close below the dynamic vwap to rely on the upcoming bearish pressure towards the 110.40 level.
As of the above discussion, we can say that the USDJPY has a higher possibility of showing a bearish pressure as the price is trading below the 111.50 level. Furthermore, the mean reversion with the dynamic 20 EMA may take the price lower towards the 110.40 level.
On the other hand, the overall market trend is still bullish, where a bullish H4 close above the 111.70 level may alter the market structure. In that case, the ultimate bullish target would be towards the 113.57 level.


