Published: October 3rd, 2023
The USD/JPY pair has reached its greatest level in nearly a year, at approximately 149.90. This upward momentum is attributable to the United States Dollar (USD) acquiring strength due to a decline in investor risk appetite and a rise in risk-averse sentiment.
As evidenced by its announcement of an unscheduled bond-purchasing operation on Monday, the Bank of Japan (BoJ) maintains its ultra-loose monetary policy framework. The BoJ's participation in the bond market is part of its continuous efforts to maintain monetary easing and stabilize monetary markets. The central bank frequently purchases bonds to influence interest rates and maintain financial system liquidity.
The US Dollar Index (DXY) has attained its highest level in eleven months, driven by rising US Treasury yields. The 10-year US Treasury yield is at its greatest level since 2007 at 4.67 percent.
In addition, Michael Barr, the Fed's vice chairman for supervision, emphasized a cautious approach to monetary policy. Barr stated that the central bank should consider how much interest rates will rise and how long they will be maintained at sufficiently restrictive levels. Nevertheless, Barr believes that the Federal Reserve can control inflation without significantly harming the labor market.
Should you buy USDJPY now? Let’s see the complete price outlook from the USDJPY technical analysis:

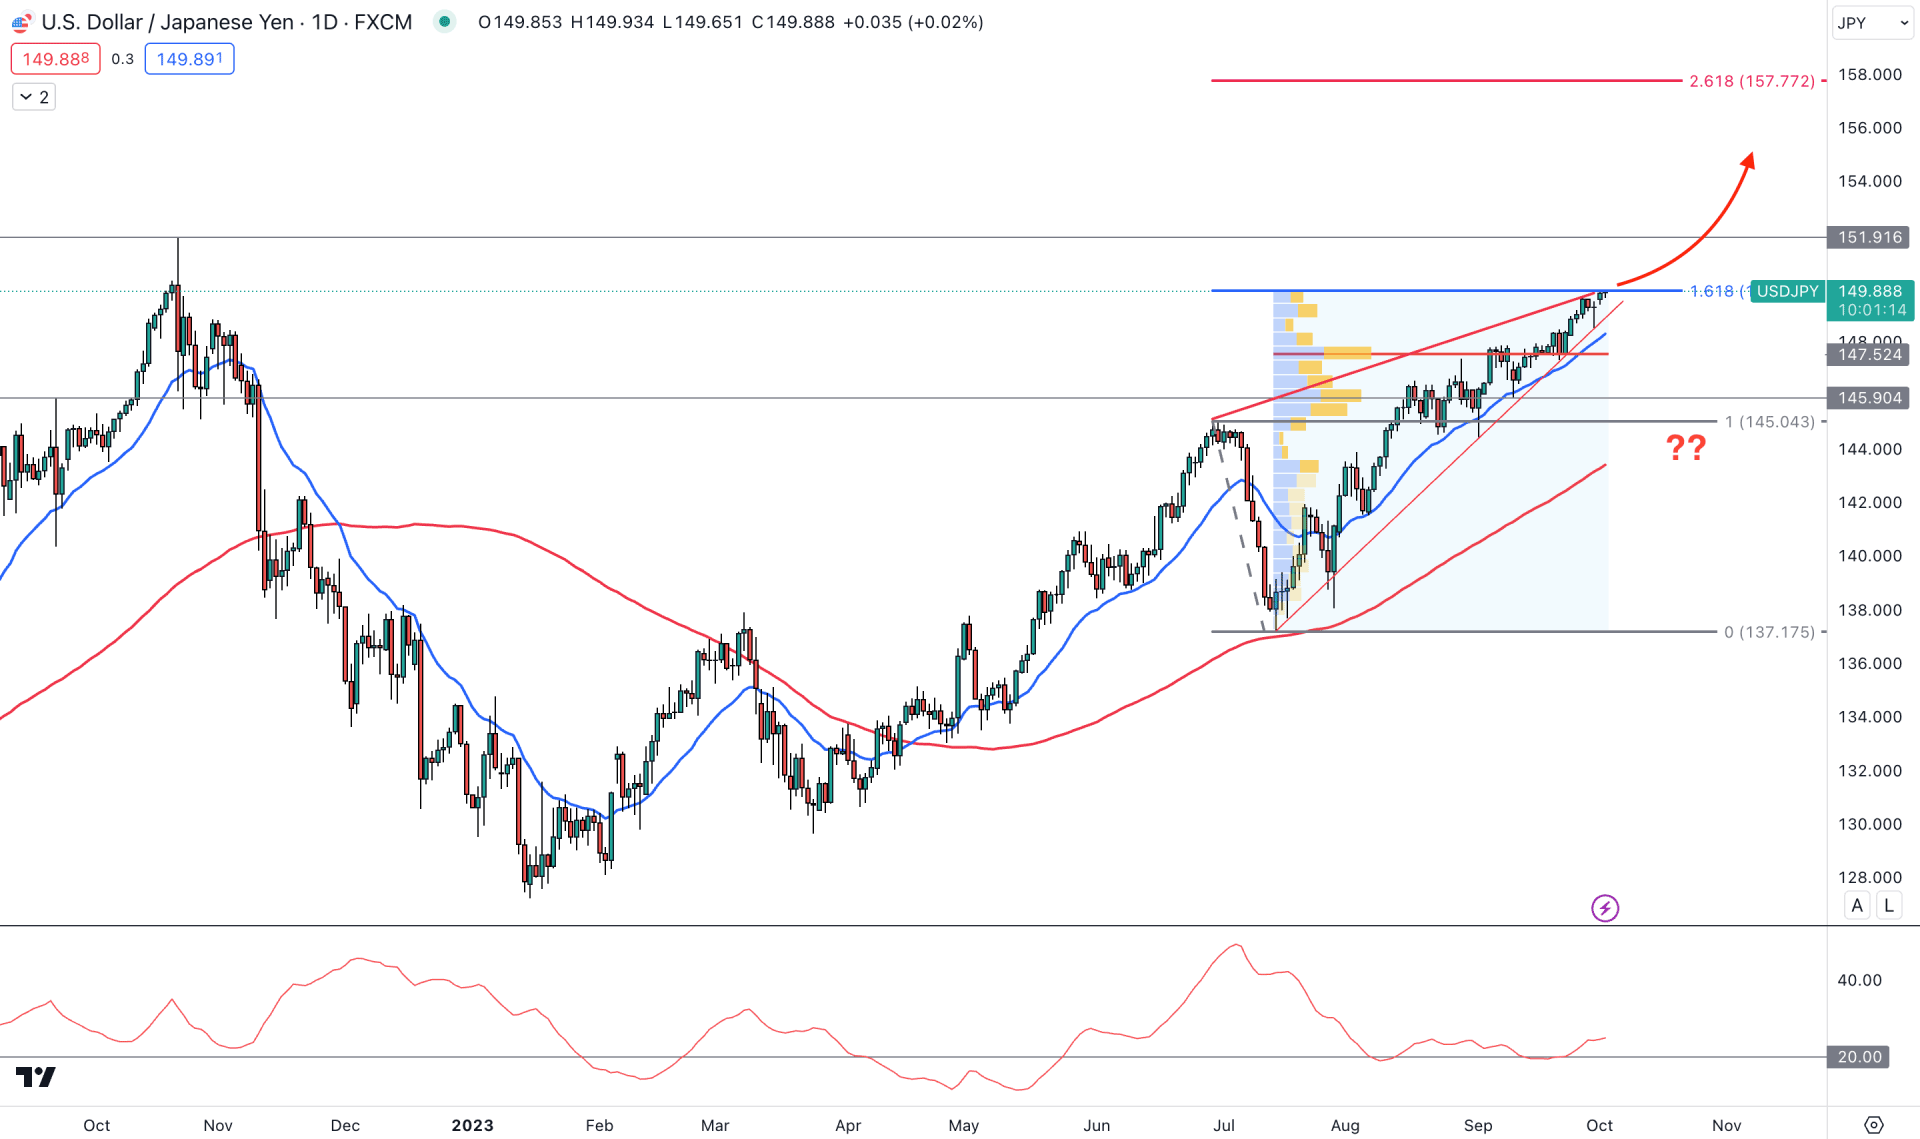
In the daily chart of USDJPY, the overall market momentum is extremely bullish, supported by the muted Bank of Japan regarding the interest rate decision. On the other hand, the rate hike possibility by the Federal Reserve is already priced in the US Dollar index.
In the higher timeframe, a strong bullish continuation is visible in the monthly candlestick, while the weekly price closes bullish for the 10th consecutive candle. It signifies a bullish market trend, where any short-term long trades could provide highly profitable trading opportunities.
In the volume structure, the high volume level from the latest significant low is spotted at 147.52 level, which is just below the current price. It is a strong sign of a bullish accumulation, which indicates additional buying order placement in this market.
In the daily chart, the price aimed higher from the 20-day Exponential Moving Average, which indicates a stable trend. Moreover, the 100-day SMA is below the latest price, which supports the stable bullish continuation.
However, the 161.8% Fibonacci Extension level from the 145.04 high to the 137.17 low is at 149.90, which is near the current price. As the overall momentum is bullish, a stable daily price above this critical Fibonacci level could extend the momentum in the coming days.
In the indicator window, the current reading of ADX is 24.96, which came after a rebound from the 20.00 level and a consolidation.
Based on the daily outlook, the USDJPY price trades within a strong buying pressure where the ultimate target is the 157.77 level. Moreover, a stable price above the 151.91 swing high could boost the bullish possibility.
On the bearish side, a strong reversal is needed from the current Fibonacci Extension level. Moreover, the emerging bullish wedge pattern needs a valid breakout below the 147.52 high volume level before approaching the 143.51 equilibrium point.

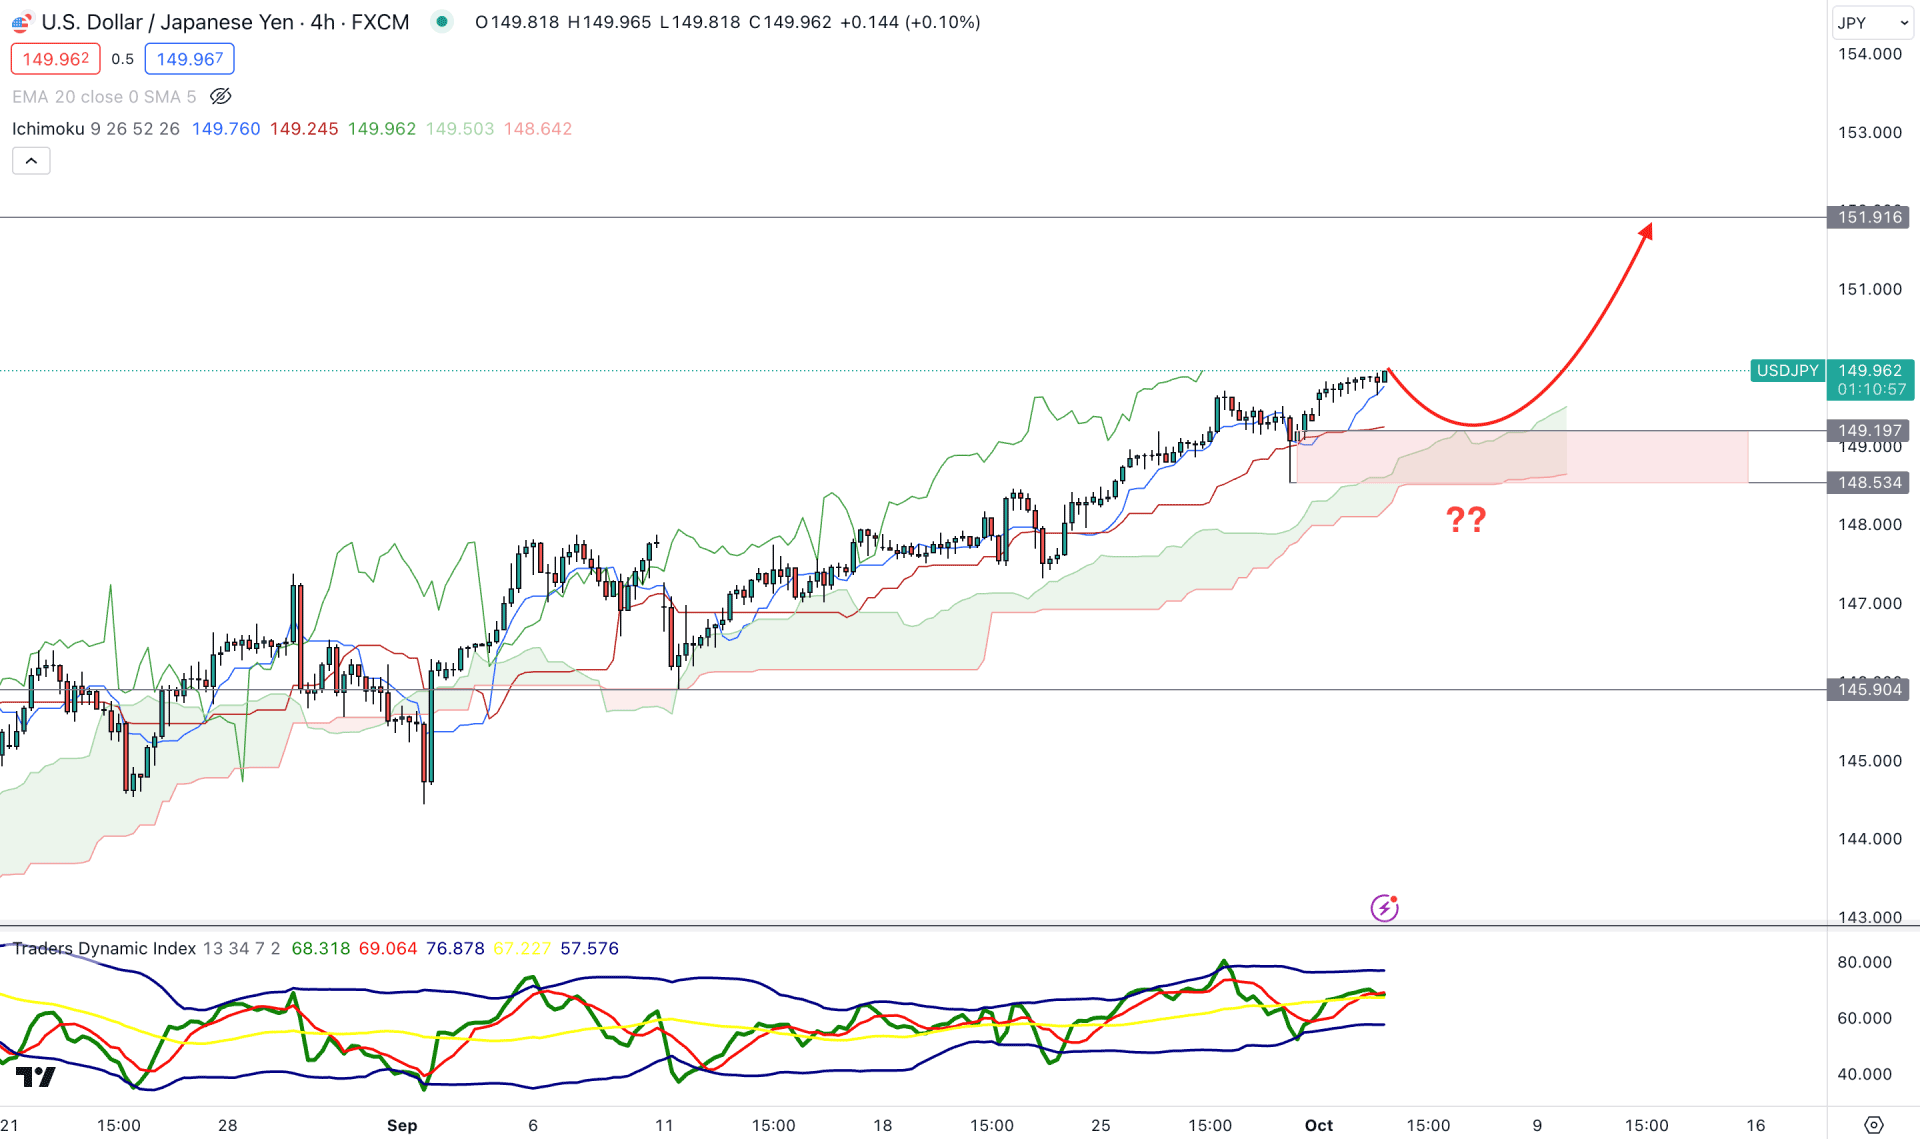
In the H4 timeframe, the overall market pressure is bullish as the current future cloud shows a stable trend continuation opportunity.
In the near-term market momentum, the bullish rally-base-rally formation is seen, where the current demand zone is at 149.19 to 148.53 area. In that case, the primary outlook for his pair would be bullish as long as it holds the buying pressure above this critical demand zone.
In the Traders Dynamic Index indicator, the TDI level shows a neutral opinion as the current reading is at the 50.00 level.
Based on the H4 outlook, the buying possibility is valid, where the main aim is to reach the 151.00 psychological level. However, breaking below the 148.50 level could lower the price towards the 145.90 area.

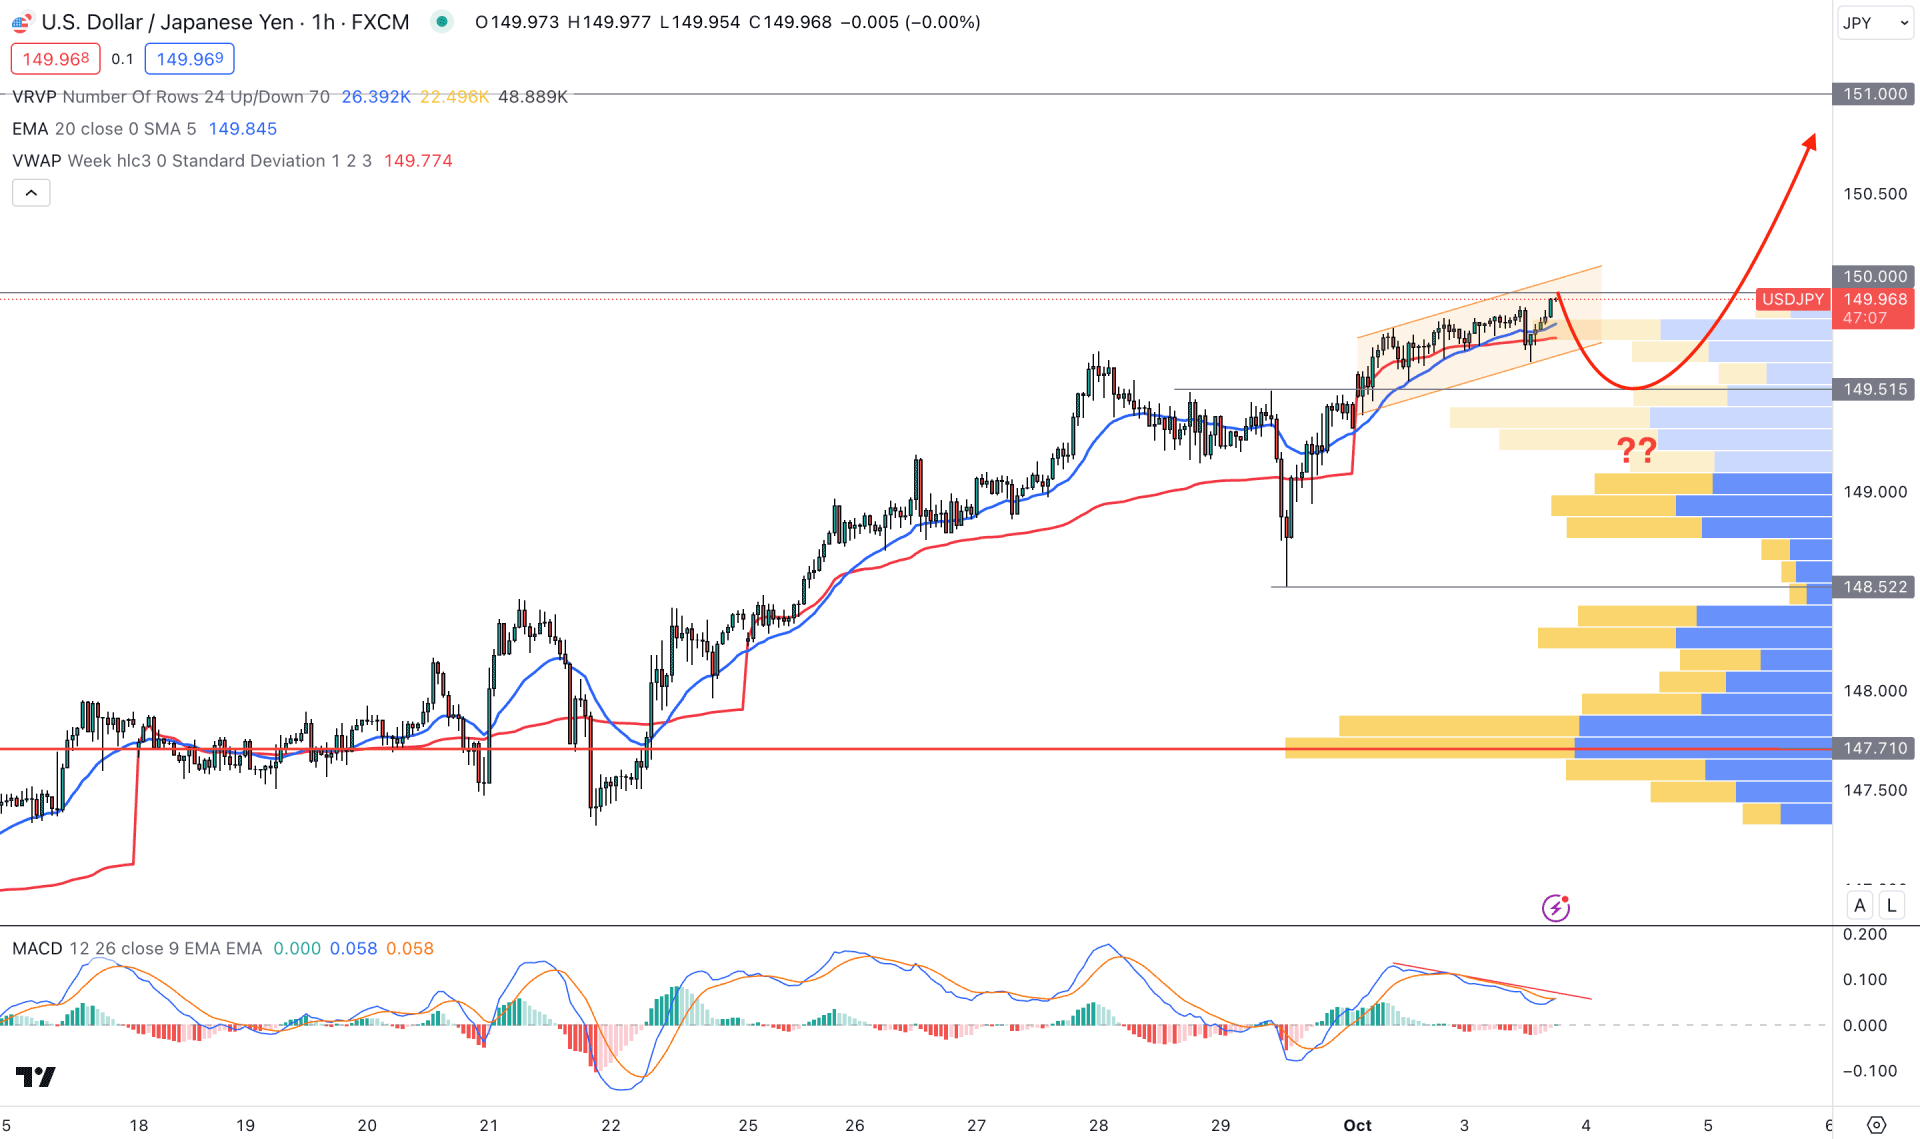
The hourly chart shows bullish overall market pressure, but the most recent momentum is overextended from the latest visible range high volume level. Moreover, the most recent price forms an ascending channel with a MACD Divergence.
On the other hand, the dynamic 20 EMA and weekly VWAP are below the current price, with a bullish rejection in the H1 timeframe.
Based on this structure, a bullish trend continuation could come after a liquidity grab from the channel support, which could see the 151.00 psychological level in the coming hours.
On the other hand, an intense bearish reversal with an H1 candle below the 149.00 level could lower the price toward the 147.71 high volume level.
Based on the overall market momentum, the existing trend for the USDJPY price is bullish, which could offer a decent trend trading opportunity. On the contrary, investors should closely monitor how the price trades at the critical Fibonacci Extension level as the high impact news, like the Non-farm payroll, could change the current trend at any time.