
Published: November 11th, 2021
The US Dollar has caught some fresh bids during the European Session, pushing the USD/JPY back to the one-week high. After the hotter-than-expected US CPI report, they formed a strong bullish daily candle that pushed bulls to gain almost 125 pips a day. The momentum was pushed by the US Dollar, where the current sentiment is enough to show tightening policy by the Fed.
The US CPI rose at the fastest annual pace since 1990, speculating that the Fed needs to take a more aggressive response to the rising inflation where the possibility of the rate hike is strong. Moreover, the rising inflation pressure triggered a strong rally in the US Treasury Bond Yield, another bullish factor for USD/JPY bulls.
On the other hand, the ultra-easy BoJ policy might leave the JPY defensive against the US Dollar. The post-re-election of the LDP could incur another round of stimulus programs where further weakness in Q3 is highly probable. In that case, investors should consider the 114.00 to 114.50 as a crucial zone for USD/JPY from where the price may find a strong trend.
Let’s see the upcoming price direction from the USD/JPY technical analysis:
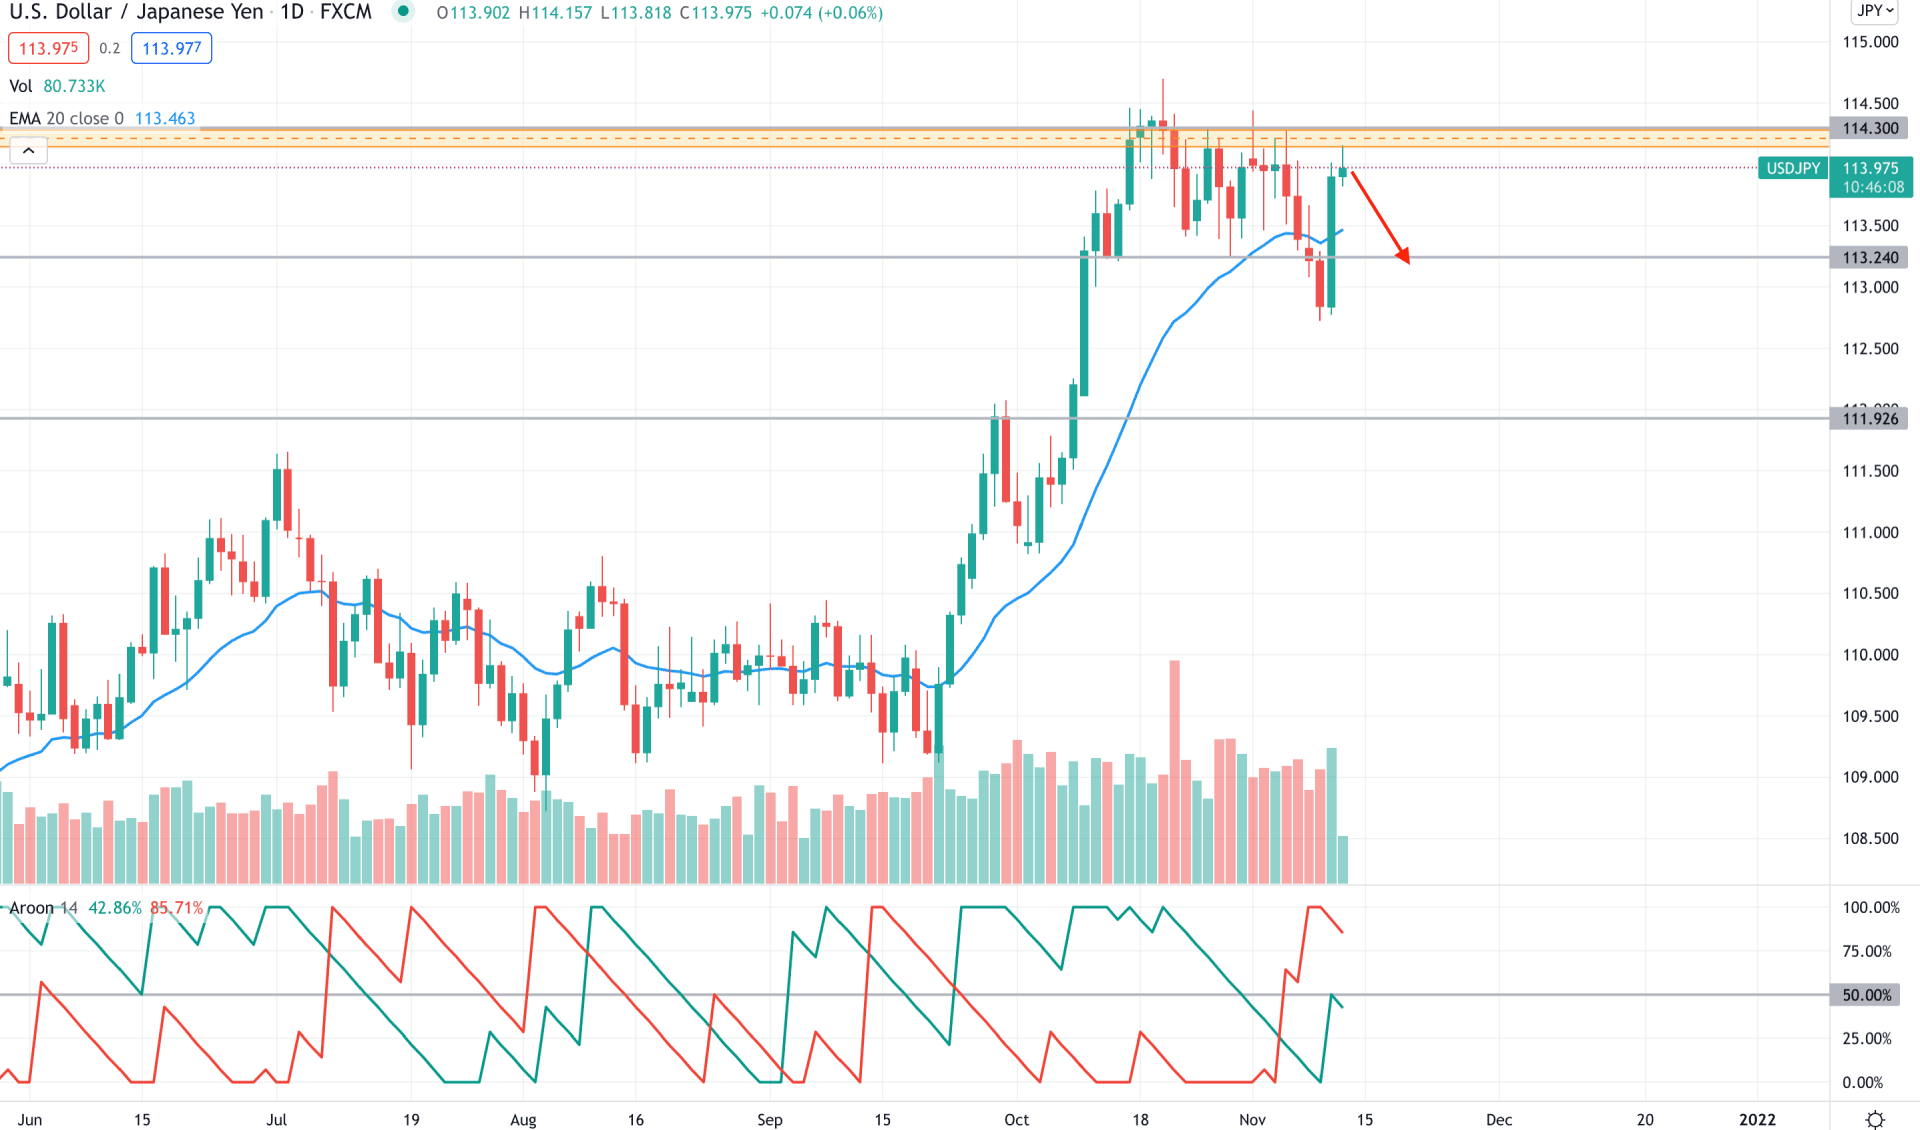
USD/JPY bulls became active from mid-September as the price moved above the dynamic 20 EMA with a bullish breakout. The buying pressure came after a long consolidation that pushed bulls to grab almost 500 pips from a single rally. However, the price action changed as soon as the price reached 114.50 level and formed an indecision candle on the daily chart. As a result, the price consolidated within 114.50 to 113.24 levels for more than a month.
The USD/JPY price action became interesting after breaking the structure and breaking below the 113.24 level with a bearish daily candle. It is a sign that someone at the top pushed the price down, attempting again. Based on the Aroon Indicator, the Aroon Down (red line) is above the Aroon Up (green line) and holds a strong position at 100% level. Therefore, it is a sign that the early trend changed from bullish to bearish, extending in the coming days.
Based on the daily context, investors should closely monitor how the Aroon Up holds its position above the 50% level. In that case, any rejection from the 114.30 level with a bearish daily close would be a great selling opportunity in this pair with the target of 113.24 level. On the other hand, a break above the 114.50 level with a bullish daily close may invalidate the current setup.
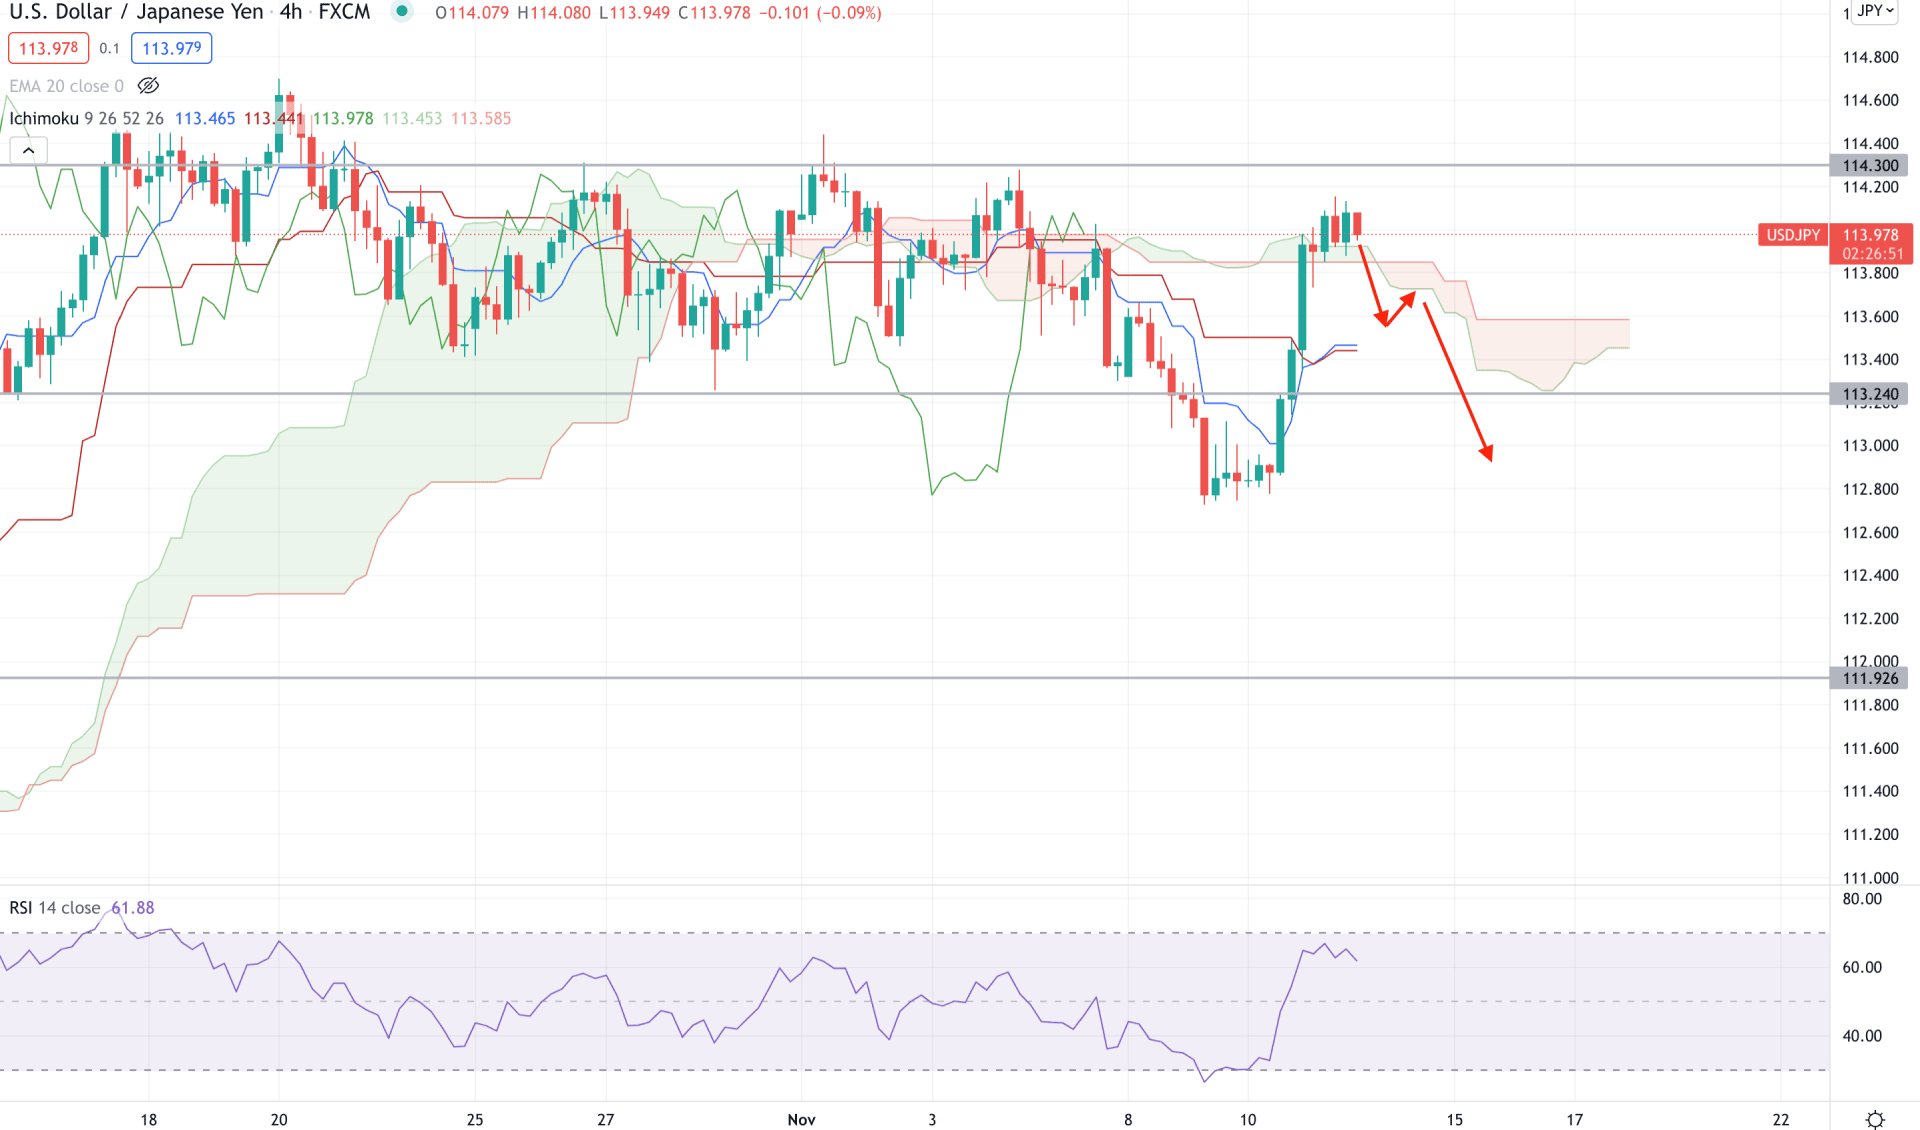
According to the Ichimoku Cloud, USDJPY H4 price moved to buyers zone as the current price is above the Kumo Cloud. However, the price became extremely corrective above the Cloud area, indicating that bulls struggle to hold the price. Meanwhile, the Senkou Span A is below the Senkou Span B in the future cloud, a sign of a possible bearish pressure in the price.
The above image shows that the RSI became corrective at the overbought 70 levels with a sideways movement in the recent chart. Moreover, the dynamic Tenkan Sen and Kijun Sen are below the price with a possibility of a mean reversion.
Based on the H4 context, a bearish H4 close below the Kumo Cloud would increase the selling pressure towards the 112.60 area. On the other hand, a bullish pressure may increase with a bullish H4 close above the 114.30 level.
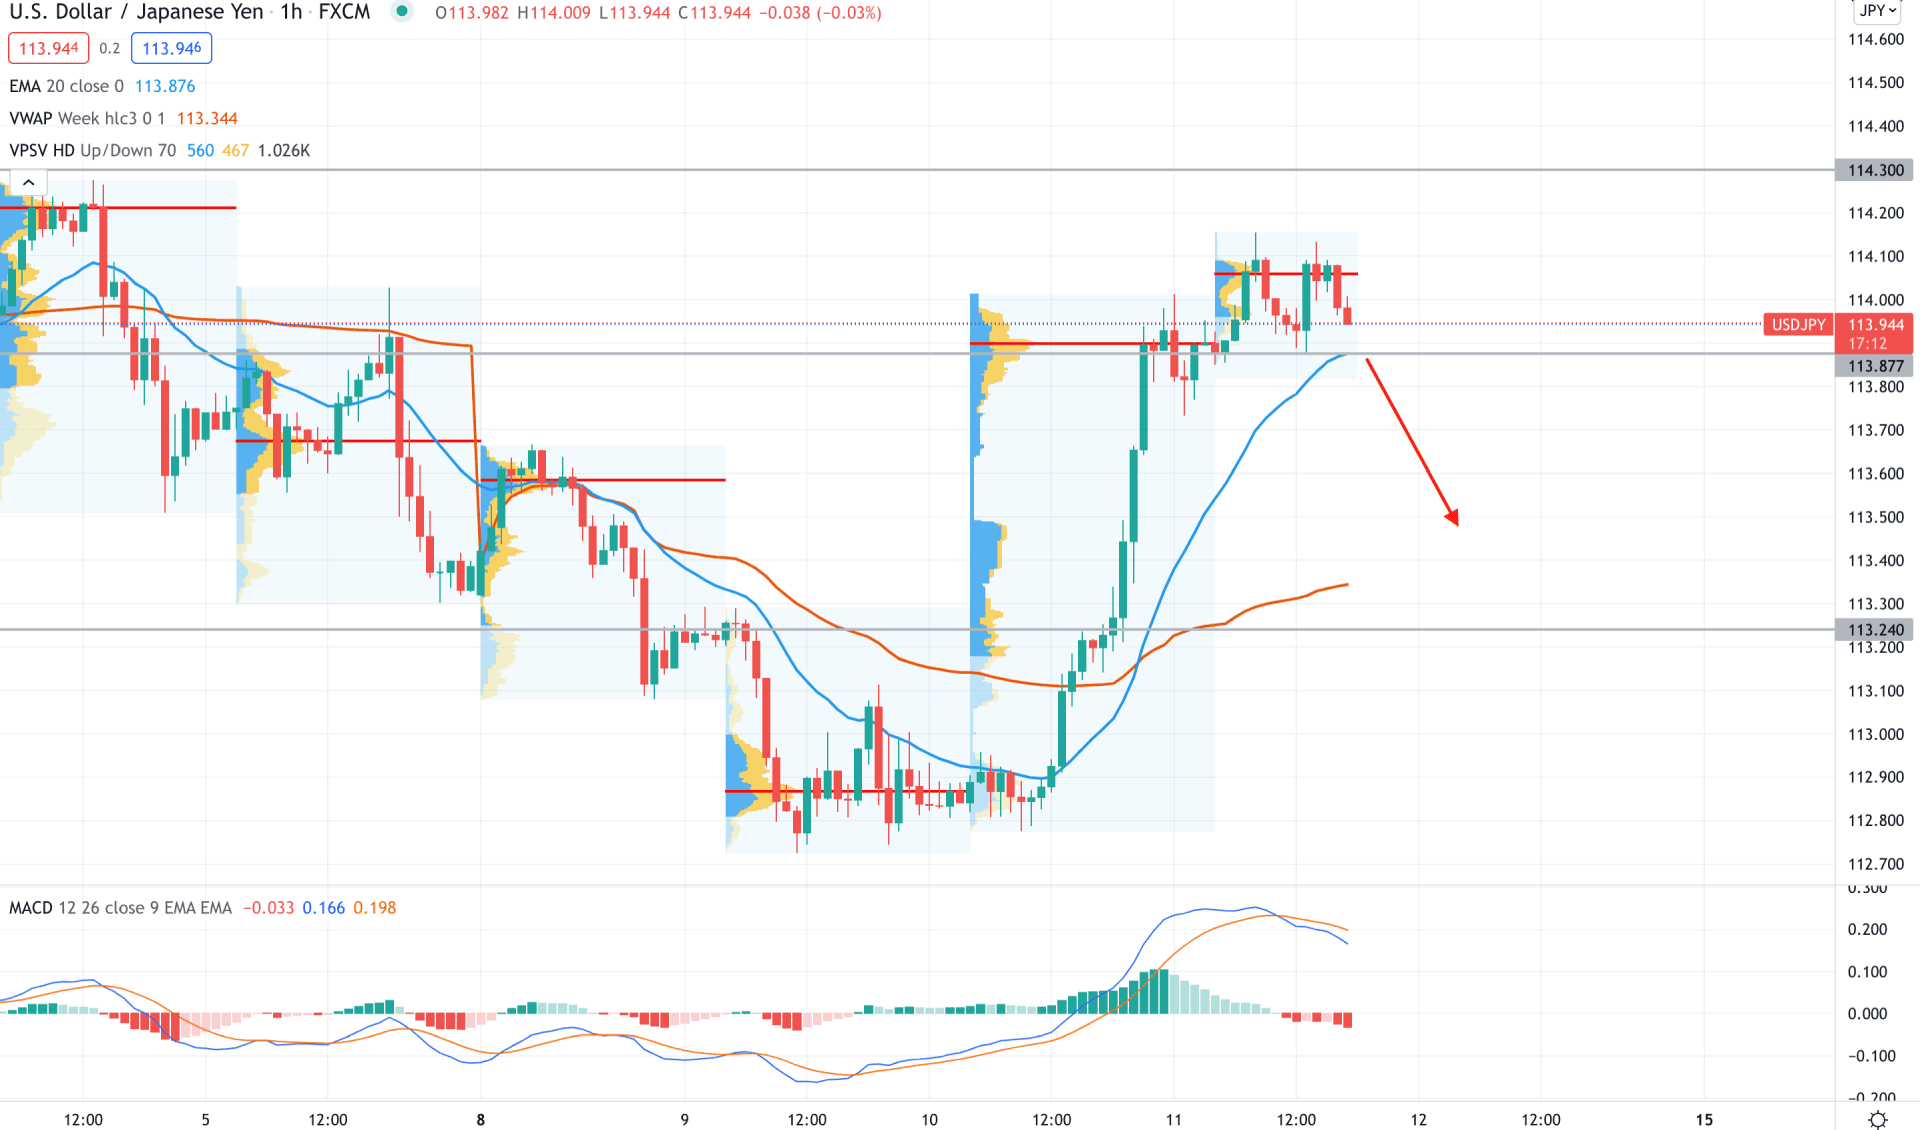
In the intraday chart, USD/JPY became corrective at 114.10 as the price failed to hold the bullish momentum above the most recent high volume level 114.05. Therefore, a bearish pressure is highly possible if bears can make a new intraday swing low below the 114.00 area.
The above image shows the price gap between the dynamic weekly VWAP where a bearish correction is pending. Meanwhile, the current price is above the dynamic 20 EMA where a bearish H1 close below 113.87 level may initiate a bearish pressure followed by a negative Histogram in MACD.
As per the current market condition, the USD/JPY intraday price is more likely to move down in the coming hours. In that case, the primary bearish target would be 113.00 to 112.50 area. However, a bullish daily close above 114.50 may invalidate the current setup and initiate a broader correction to the price.


