
Published: July 3rd, 2025
The USDJPY pair is back above the 145.00 mark after the NFP release as the Japanese yen (JPY) continues to lose ground against a slightly bullish US dollar for the following day in a row. A trade deal between Vietnam and the US reduced worries about protracted trade disputes, threatening the safe-haven JPY, giving the global risk a slight bounce. The JPY is also being affected by American President Donald Trump's vow to increase tariffs on Japan due to its purported reluctance to purchase rice farmed in the United States.
However, the JPY should benefit from the growing consensus that the Bank of Japan would raise interest rates once again in light of Japan's widening inflation. In contrast, the USD cannot draw in any significant buyers and is still very close to a multi-year low reached this past week due to dovish Fed predictions. This could also help limit the USD/JPY pair and restrict deficits for the lower-yielding Japanese yen.
The present policy rate is below neutral, according to BoJ Governor Kazuo Ueda, who stated on Tuesday that further interest rate increases will be contingent on the current state of inflation. As businesses continue to pass on growing raw material costs, Japan's consumer inflation has exceeded the BoJ's 2% target for over three years. This serves as a boost for the JPY and supports the argument for additional central bank tightening.
Let's see the upcoming direction from the USDJPY technical analysis:
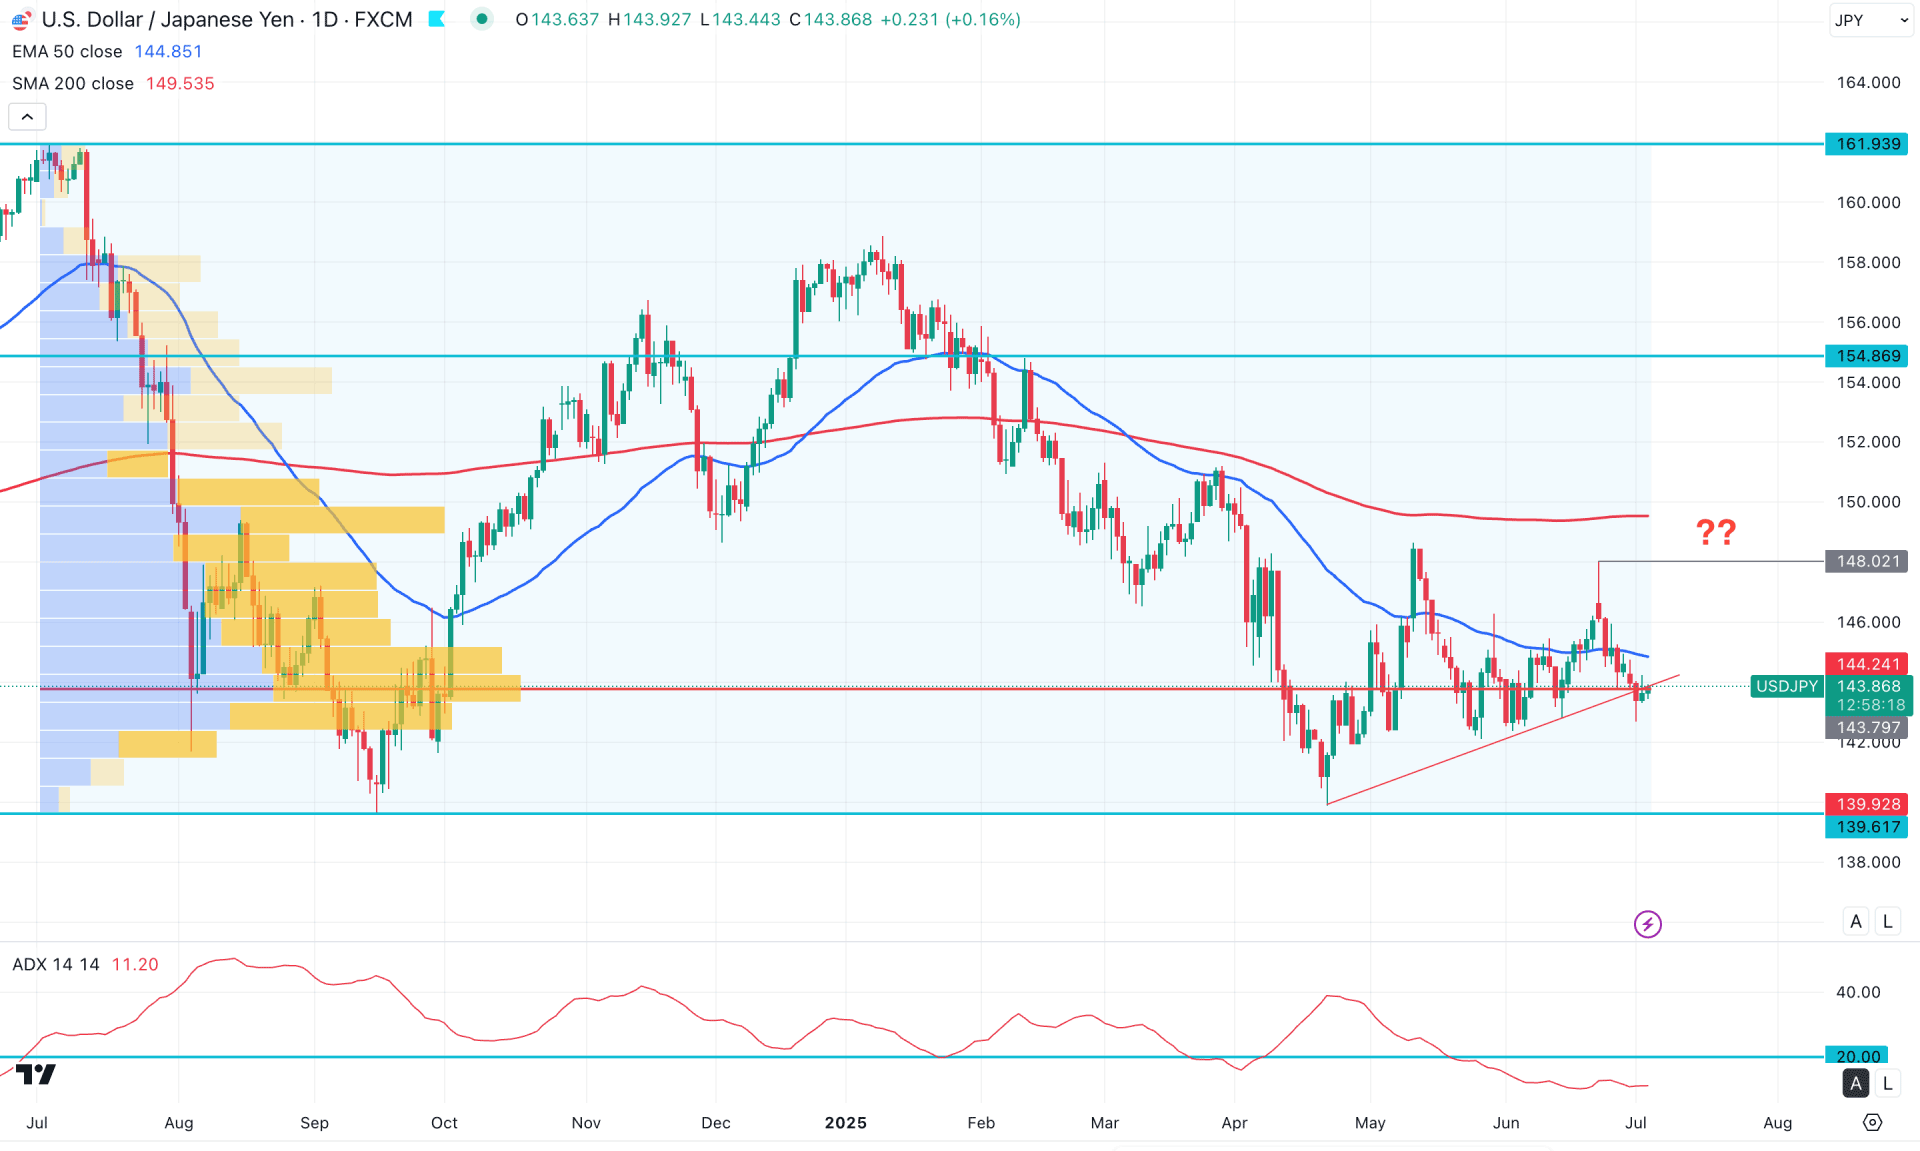
The USDJPY price trades sideways within a bearish wave initiated in January 2025. As no significant higher high has formed, the primary expectation remains to look for short opportunities only. In the most recent chart, the price moves sideways near a trendline support, where multiple bullish rejections are visible.
Looking at the higher timeframe, price action on the monthly chart suggests multiple inside-bar formations following the strong bearish candle that closed in April 2024. Based on this candle pattern, the ideal trading approach is to look for short opportunities after a break below the 142.10 monthly low. The weekly chart also shows a sideways momentum, where the 139.61 support level will be crucial.
Currently, the price is trading at a key discounted zone on the weekly timeframe, so more confirmation is needed before anticipating a long-term bullish move. However, short-term trading opportunities may still arise despite the choppy market over the last three months.
The high volume level also supports the sideways momentum. The most significant resistance since July 2024 is at 143.79, which is just above the current price. Although intense bearish pressure is possible following the June 23 daily candle, more confirmation is needed from the current price zone, as a high volume order block is active.
Recent candles in the main price chart show multiple daily closes below the 50-day Exponential Moving Average, while the 200-day Simple Moving Average remains above 148.00. If both dynamic lines exceed the current price, we may expect a bearish continuation unless there's a solid bullish reversal.
The indicator window shows signs of correction, as the Average Directional Index (ADX) is below the 20.00 satisfactory level. Moreover, the Relative Strength Index (RSI) has moved below the 50.00 level and is yet to approach the oversold 30.00 zone. Meanwhile, the Everest True Range Indicator shows a downward slope, confirming the sideways market.
Based on the daily market outlook, the price trades sideways after a bearish rally, which signals a potential downside continuation. As the most recent daily candle closed below the trendline support, a consolidation followed by a bearish rejection from the 50-day EMA could offer a short-term trading opportunity. On the bearish side, the ultimate target would be to test the 139.61 level before extending a bearish leg toward the 128.00 area.
On the other hand, the price has moved into a strong liquidity zone, as the trendline breakout occurred without a significant daily close below it. Although the dynamic lines are still above the current price, investors should closely monitor how the price reacts from the 141.77–144.50 zone. Any bearish pressure below the 142.38 level, followed by a sharp recovery above the 50-day EMA, could present a bullish opportunity targeting 151.19. A breakout above 148.02, followed by bullish consolidation, could extend the buying pressure toward the 154.86 resistance level.
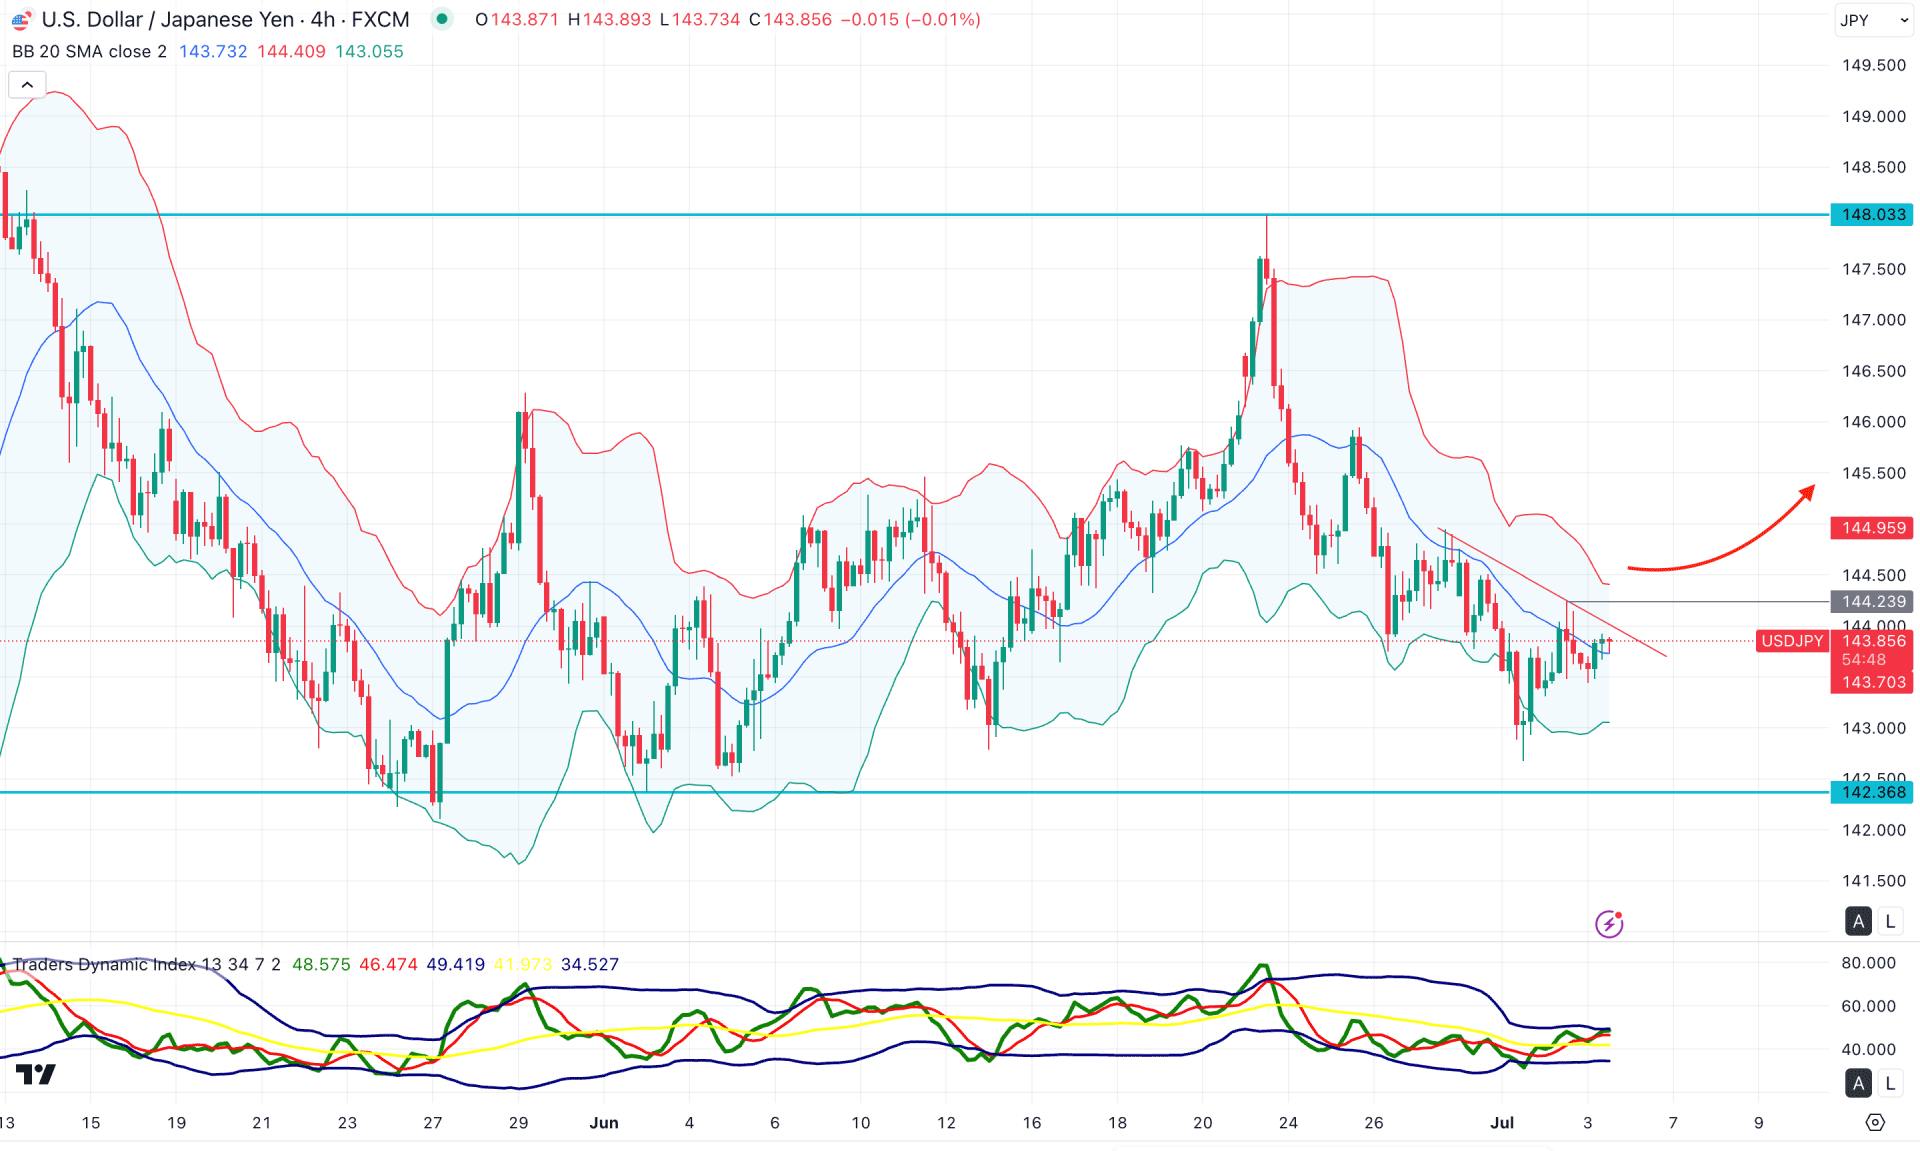
In the H4 timeframe, the rent price is trading bearish as multiple H4 candles are visible below the mid Bollinger Bands level. Moreover, a bullish rebound is visible from the low Bollinger Bands support, which signals an early bullish signal.
In the indicator window, the Traders Dynamic Index remains above the 50.00 neutral line. It is a sign of strong buyers' presence in the market, which can create a long opportunity at any time.
Based on the H4 outlook, the recent bullish trendline breakout signals an upward continuation opportunity. Investors might expect a corrective downside pressure from where any bullish reversal can be a continuation signal.
On the other hand, an extended selling pressure with an H4 candle below the 143.73 mid Bollinger Bands level could invalidate the bearish opportunity at any time.
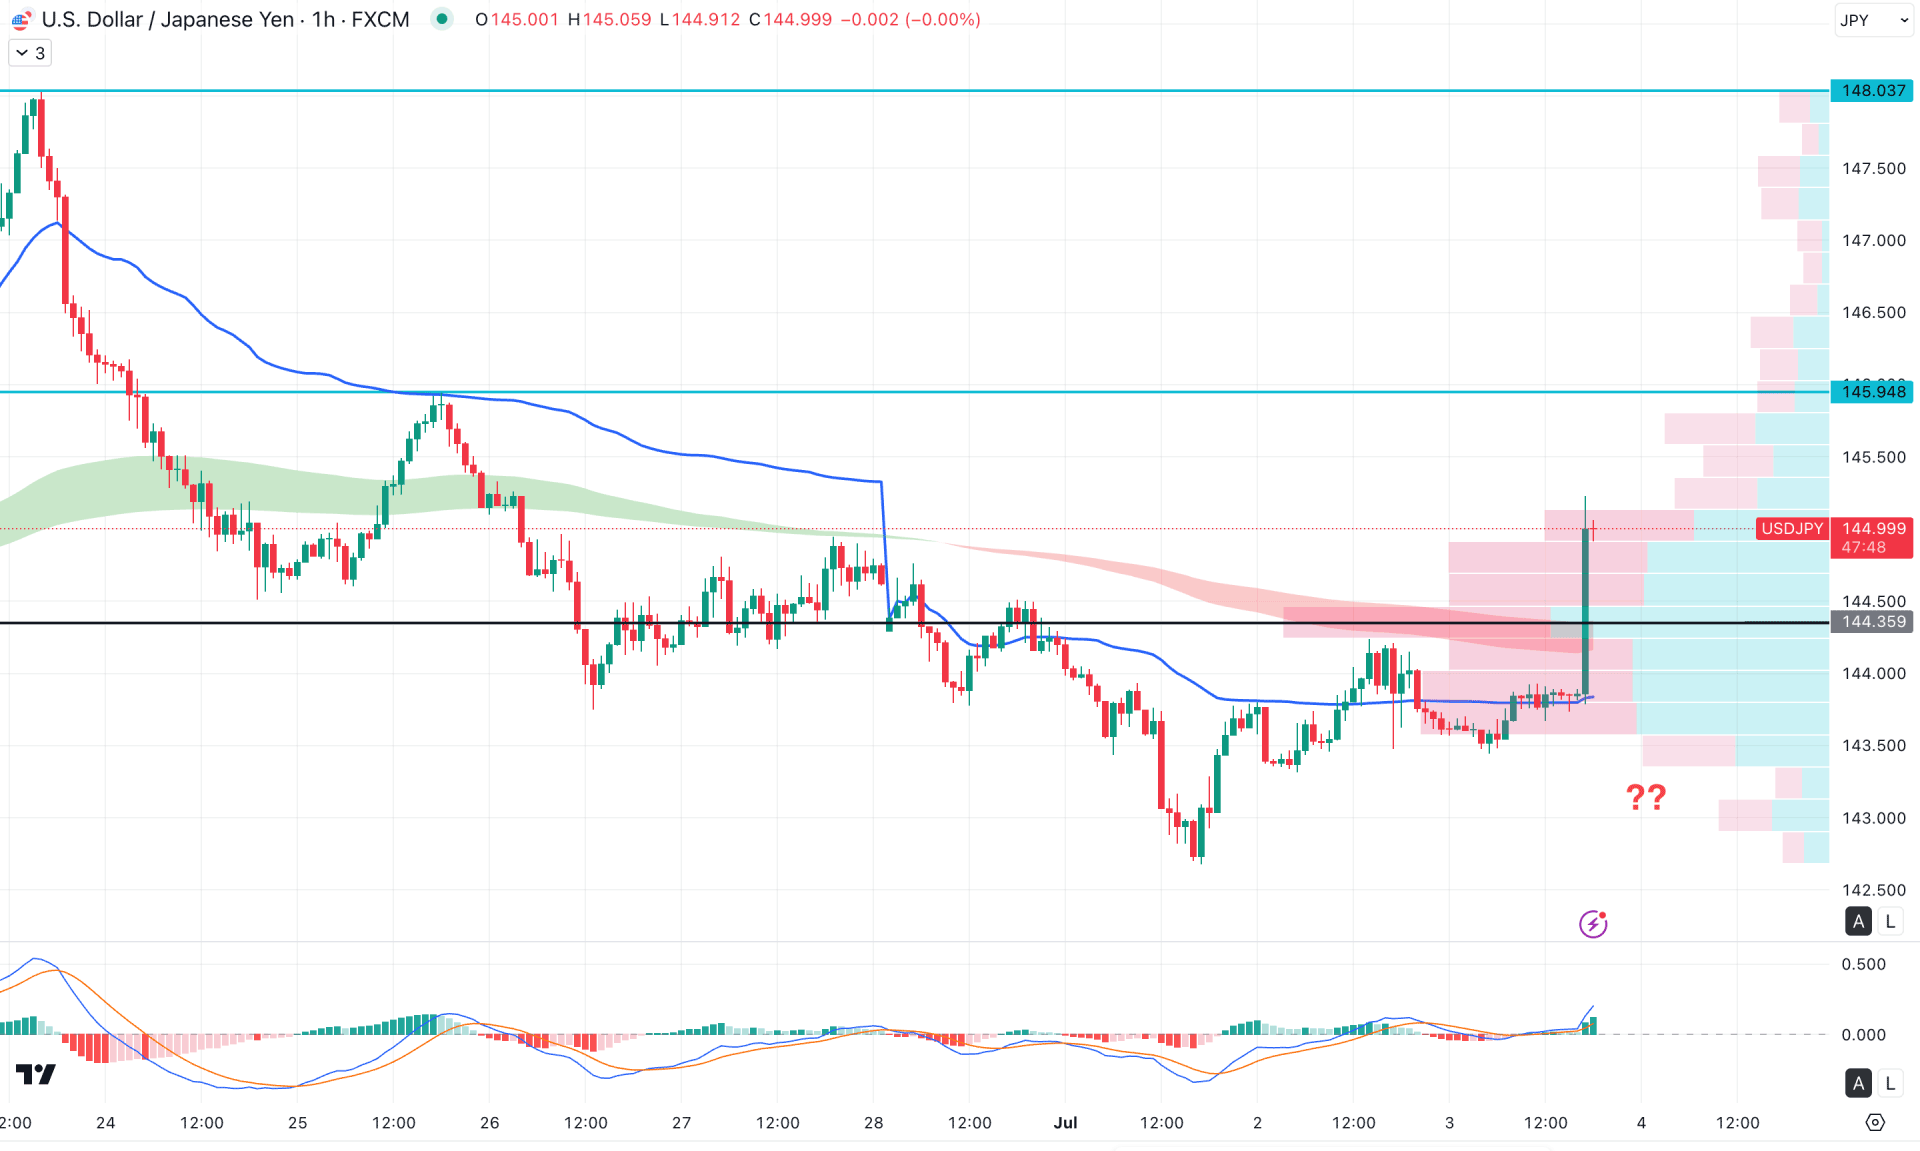
In the hourly time frame, the current price is trading within bullish pressure as a bullish H1 candle is visible above the high volume line. Primarily, the high volume breakout supported by the Moving Average wave signals a possible upward continuation.
In the secondary indicator window, the MACD Histogram aimed higher, signalling a bullish continuation. Moreover, the signal line aimed higher, showing a strong position in the positive zone.
Based on this outlook, investors should closely monitor how the price retraces lower from the latest bullish H1 close. A corrective downside momentum with a bullish rebound from the MA wave area could be a possible long opportunity, targeting the 145.94 resistance level.
On the other hand, a failure to hold the price above the 144.35 high volume line with a bearish H1 candle below the 144.00 level might be a bearish signal, targeting the 142.67 level.
Based on the overall market structure, the intraday market momentum is bullish, followed by the market sentiment from the post-NFP sentiment. As the broader market momentum is still bearish, investors might find a bearish opportunity once the intraday bullish sentiment is over.


