
Published: April 26th, 2023
After plummeting to lows near 133.40 on Tuesday, USDJPY has gained value, but on Wednesday, immediate selling pressure came.
Due to concerns about the banking sector, investors became risk-averse, causing the yen to depreciate against the US Dollar. This was precipitated by First Republic Bank's plummeting deposits and UBS's 52% quarterly income decline due to its acquisition of Credit Suisse.
The Consumer Confidence report for April was disappointing, with a decrease of 2.7 points to a reading of 101.3, its lowest level since November. The weak report was primarily the result of declining expectations, which decreased from 74.0 to 68.1. This, coupled with a decline in Federal Reserve manufacturing data, enhanced the dollar's allure as a safe-haven currency.
Even though the new governor of the Bank of Japan, Kazuo Ueda, indicated he was not in haste to change policy, the yen continued to function as a typical safe haven. Friday concludes the first BoJ meeting under Ueda's leadership.
Let’s see the future price direction of USDJPY from USDJPY technical analysis:
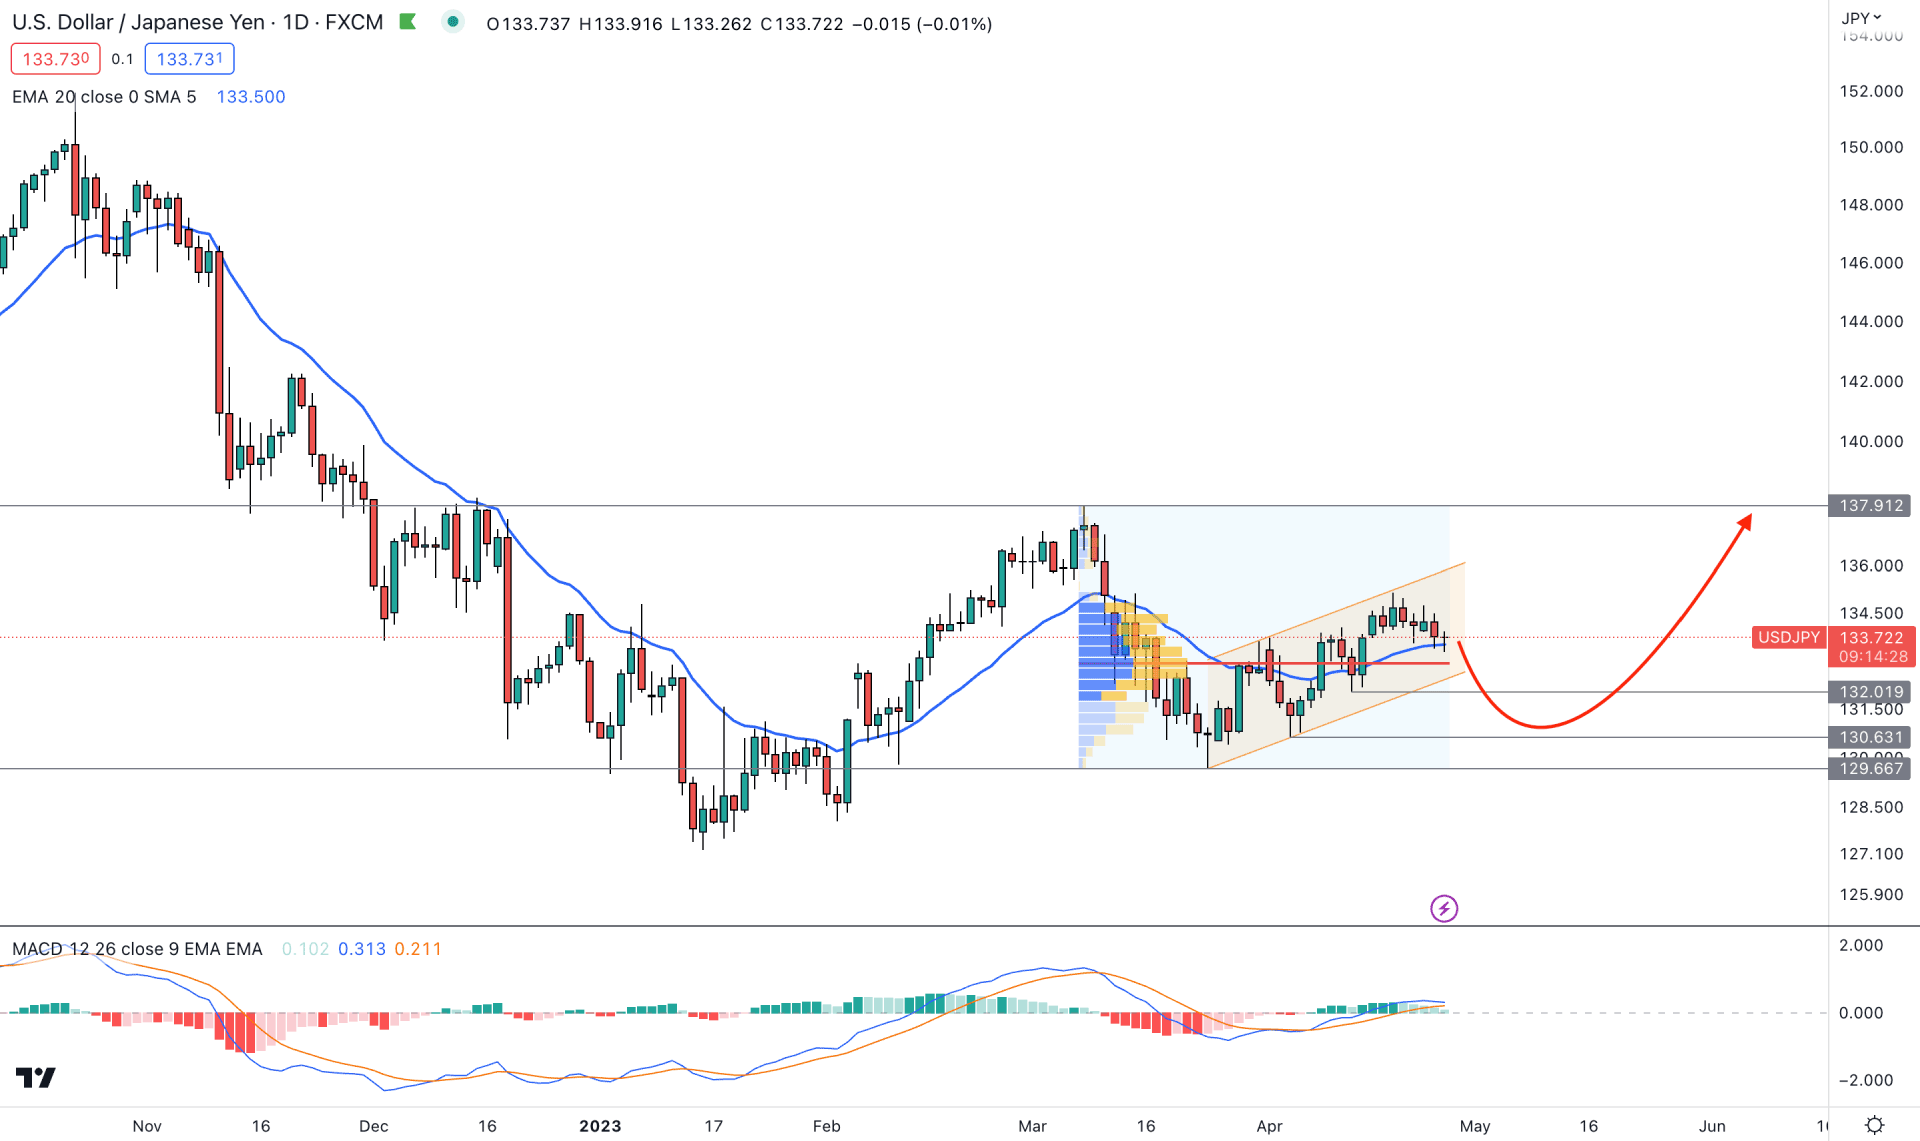
USDJPY has traded sideways recently, with the current price trading within an ascending channel in the daily chart. At first look, a range extension could increase the price, but it can reverse at any time.
The current tradable range for USDJPY starts from the 129.66 low to the 137.91 high, as strong liquidity sweeps are seen from these levels. The price trades sideways below the 50% Fibonacci Retracement of this zone, which could offer a long opportunity in this pair.
According to the current high volume level indicator, the highest trading volume level since 8 March 2023 is at 132.92 level, which is below the current price. It is a sign of strong buying pressure in the market, supported by the dynamic 20-day Exponential Moving Average.
The indicator window shows a corrective pressure, where the current MACD Histogram is bullish. Moreover, MACD EMA’s showed a bullish crossover with a stable presence above the neutral area.
Based on the daily outlook of USDJPY, the broader market direction is bullish, but a minor downside correction may happen. Price may grab the liquidity from the channel support, where any false break at the 132.01 and 130.63 area could offer a high probable buying opportunity. However, another buying opportunity is available at the 20 DMA support, which can extend the range toward the range of 136.00 level.
In all cases, the ultimate barrier is the 129.66 level, as breaking below this area with a daily candle close could eliminate the bullish structure.
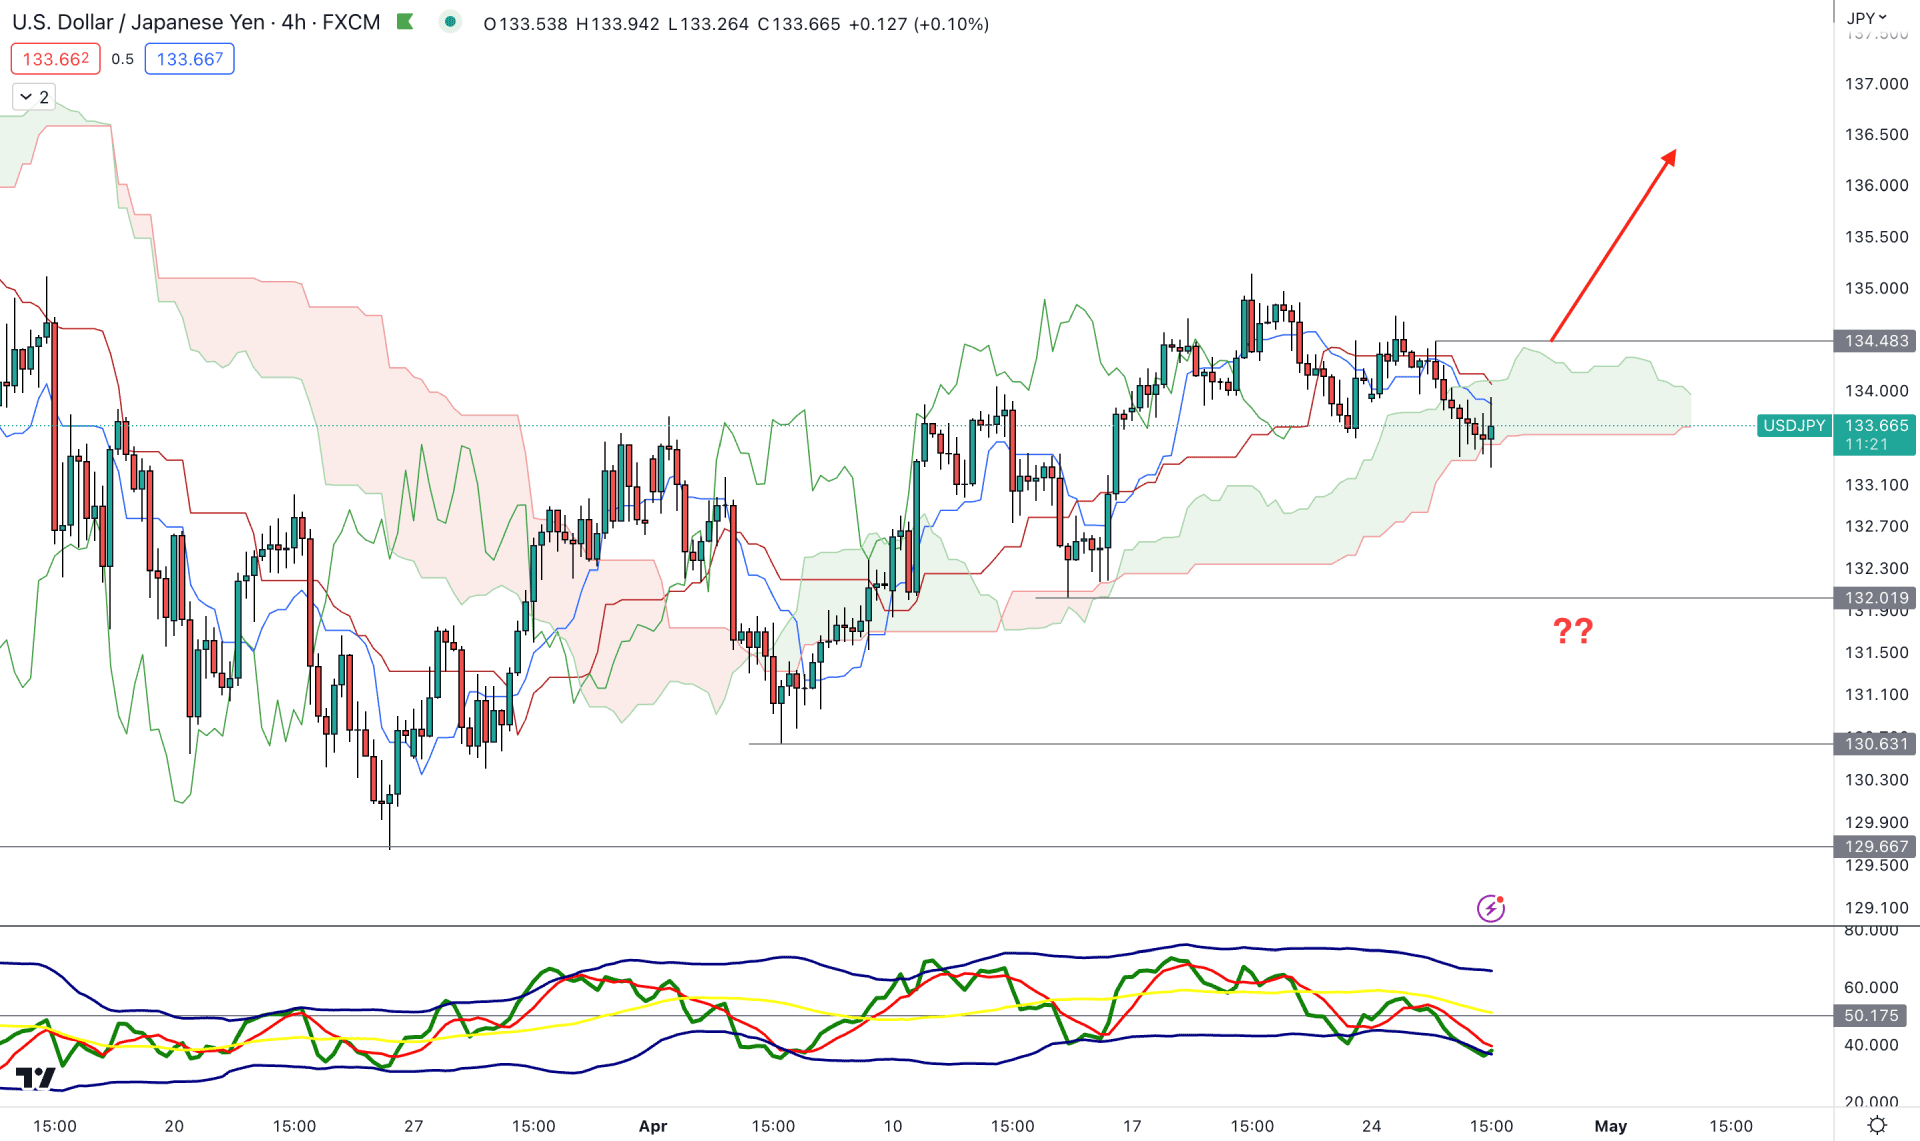
In the 4-hour chart, the current price trades within a corrective bullish trend, where the most recent price trades within the Ichimoku Kumo Cloud. It is a sign that bulls need to expand their presence in the market before forming a stable trend.
In the future cloud, Senkou Span B is Flat, which is a sign of corrective price action. Moreover, the Senkou Span A is above B, with an upward slope, which is a sign of a short-term buyers’ presence in the market.
Based on the H4 outlook, a bullish price action above 134.48 could offer a long opportunity. Meanwhile, the Traders Dynamic Index (TDI) level above the 50.00 area would confluence support to the buying pressure.
On the other hand, an immediate bearish pressure with an H4 close below the 133.20 level could lower the price towards the 130.50 level.
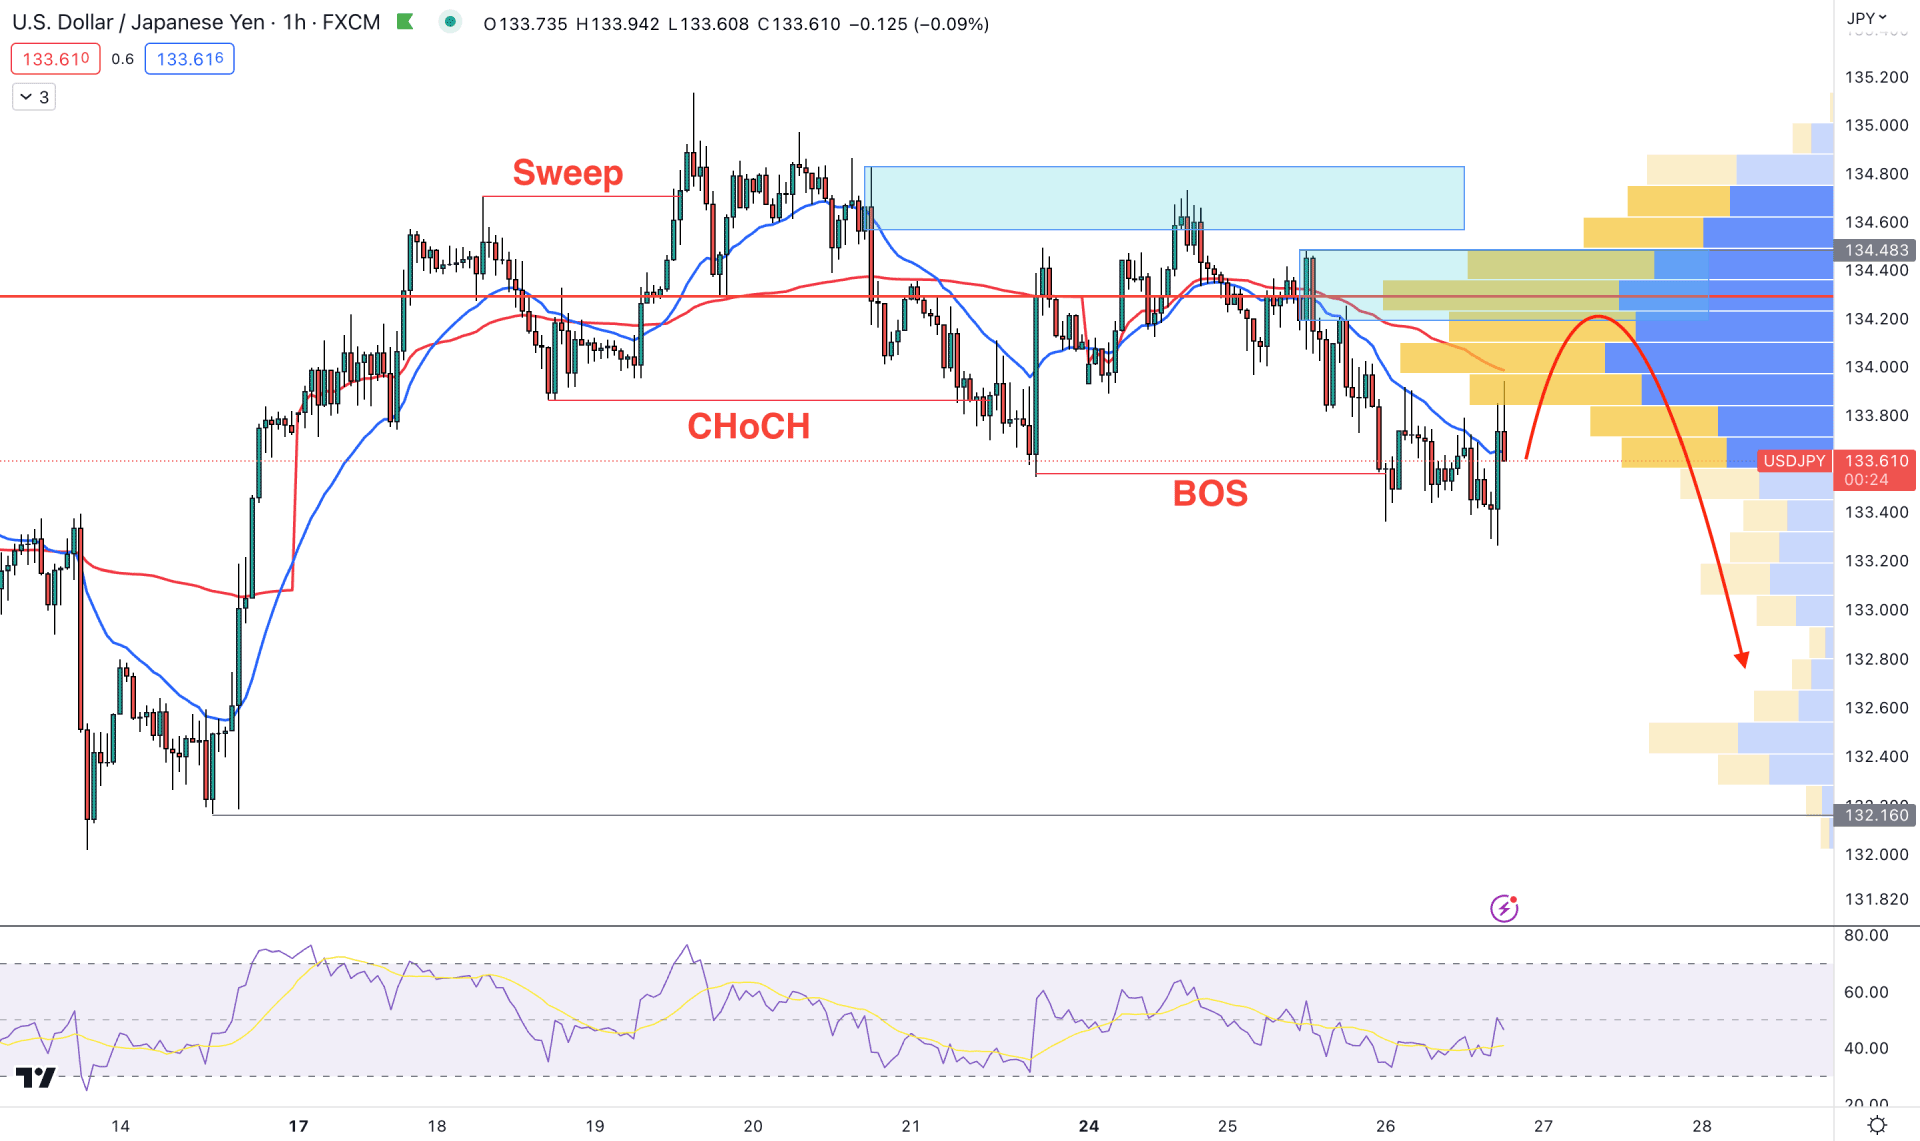
In the hourly chart, a liquidity sweep at the 134.70 level with a bearish Change of Character provided the first sign of a possible bearish trend. Later on, the bears grabbed the wheel after testing the 134.82 to 134.54 order block that ended up with a new swing low.
The current visible range high volume level is 134.29, which is above the current price. Moreover, the dynamic 20 EMA and weekly VWAP are above the current price, working as resistance levels.
Based on this outlook, a minor bullish pressure could offer a short opportunity, where the ultimate target is to test the 132.00 level. However, a bullish recovery with an H1 candle above the 134.60 level could alter the structure and open a long opportunity at any time.
USDJPY daily price trades sideways with several swing levels below the channel support, which signals a bearish possibility to grab those liquidities. Therefore, the best approach is to look for short opportunities in this pair based on the price action in the H4 chart.


