
Published: June 15th, 2021
The bullish pressure in the USDJPY came with a broader dollar strength as a part of the post-Covid economic recovery. Since the beginning of 2021, the US economy has shown some strength in economic releases compared to Japan.
The US economy has grown by 6.4% in Q1, while the Japanese economy contracted 3.9% only. Moreover, the Atlanta Fed estimated the Q2 GDP at 9.3%, while the Japanese activity is forecasted to shrink this quarter.
This week, further indication about the US economy will come from the FOMC, where the Federal reserve might indicate the inflation projection. Later on, the Bank of Japan will meet on Friday, where the policy may remain unchanged. However, the Japanese government may undertake additional anti-deflation measures that might undermine the yen.
Based on the fundamental outlook, it is illogical to say that the USDJPY will move down with the 9% expansion in the US economy. On the other hand, it is also not in a healthy buying environment as the Fed is insisting on rate accommodation. So, is there any possibility that the USDJPY will reach 111.00 resistance in the coming days?
Let’s see the future price direction from the USDJPY technical analysis:
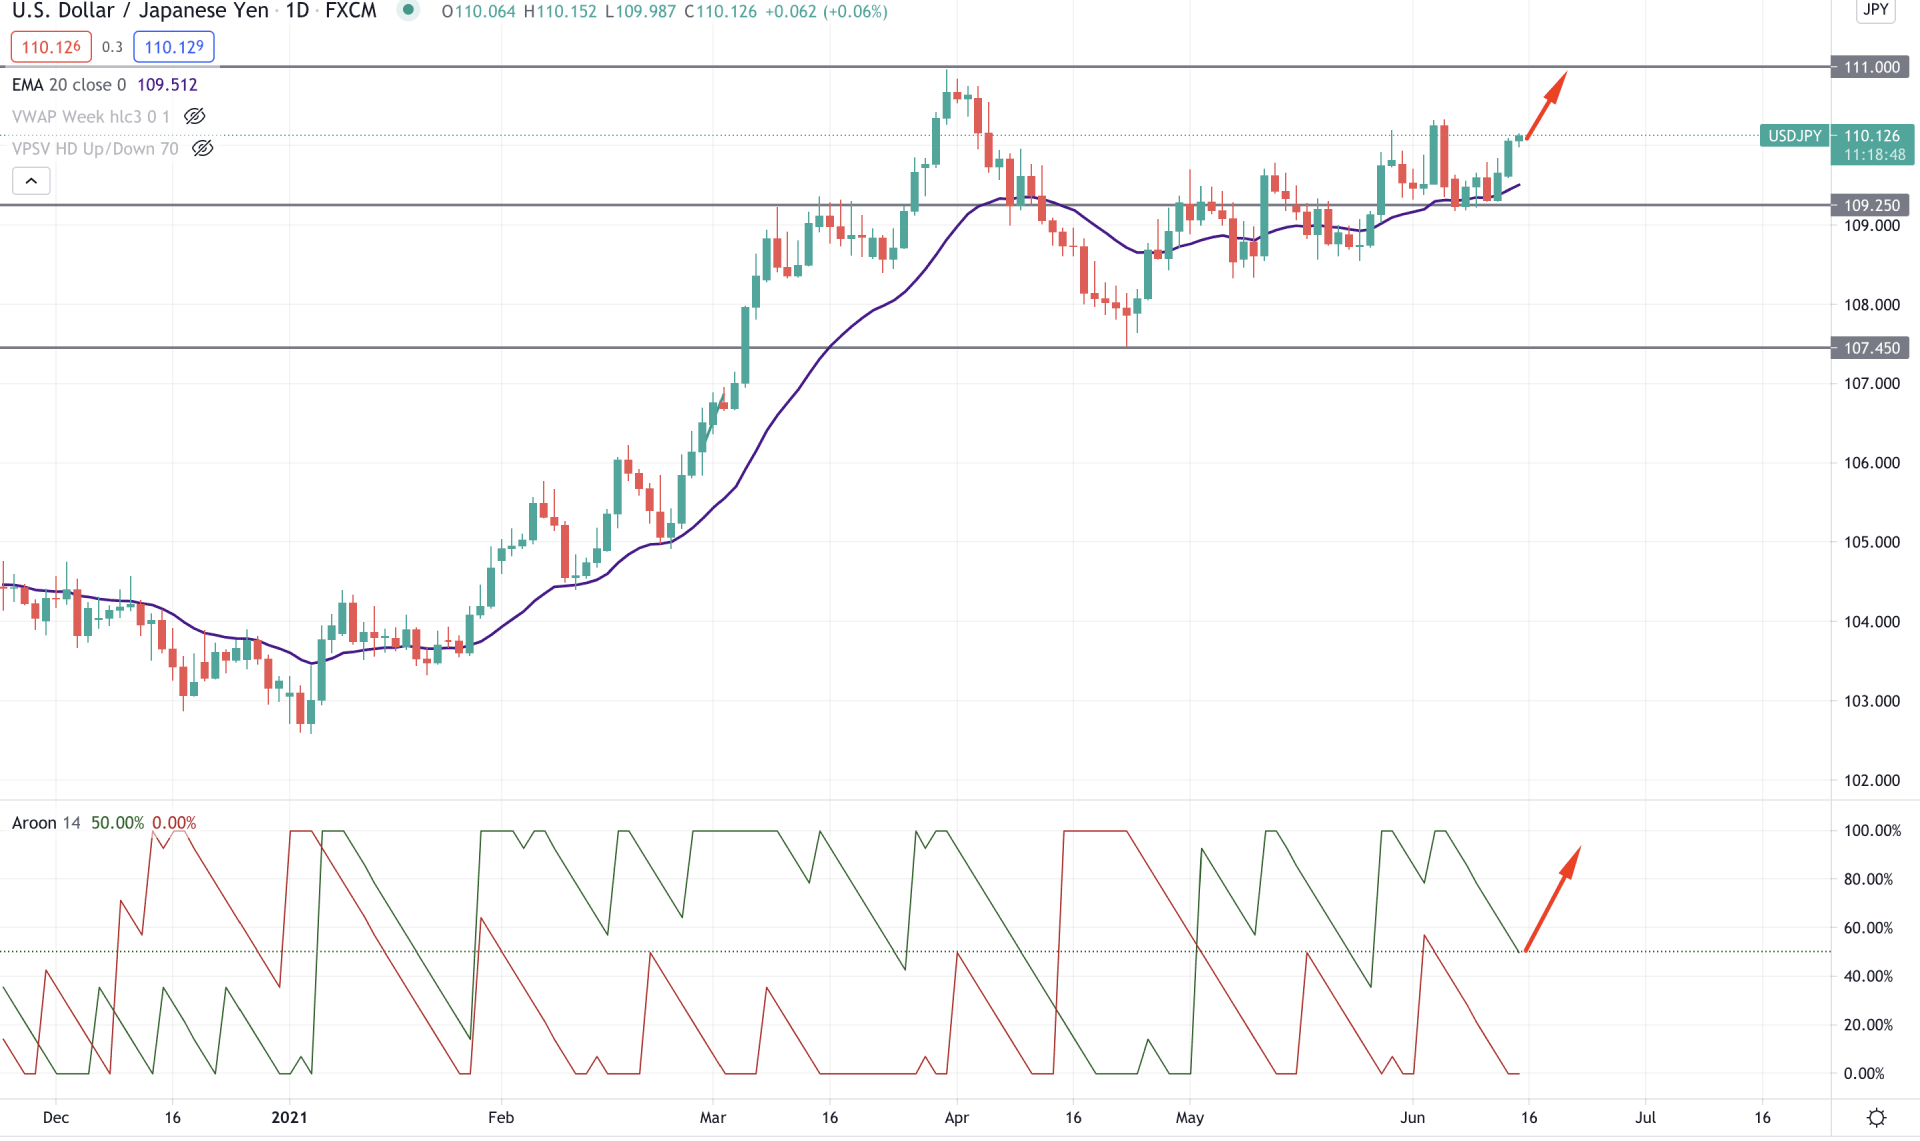
USDJPY started a strong bullish pressure since the beginning of 2021 that took the price higher from 102.59 to 110.95 level. Later on, the price corrected lower and made a swing low at 107.45 level.
After that, the price moved higher by creating higher highs and remained stable above the 109.25 event level. Therefore, as long as the price is trading above the 109.25 event-level, it has a higher possibility of continuing the bullish pressure in the coming days.
In the above image, we can see the daily chart of USDJPY, where the most recent price is trading above the dynamic 20 EMA with a bullish daily close. Moreover, the price successfully rejected the 109.25 event level and moved higher.
Besides, in the indicator window, Aroon Up (green line) is above the Aroon Down (red line) for a considerable time and currently at the 50% level. Therefore, if the Aroon Up reaches the 70% level, the price may resume its bullish pressure where the primary target will be 111.00 level.
Conversely, a solid bearish daily close below the 109.25 event-level may alter the current market structure, increasing a broader consolidation.
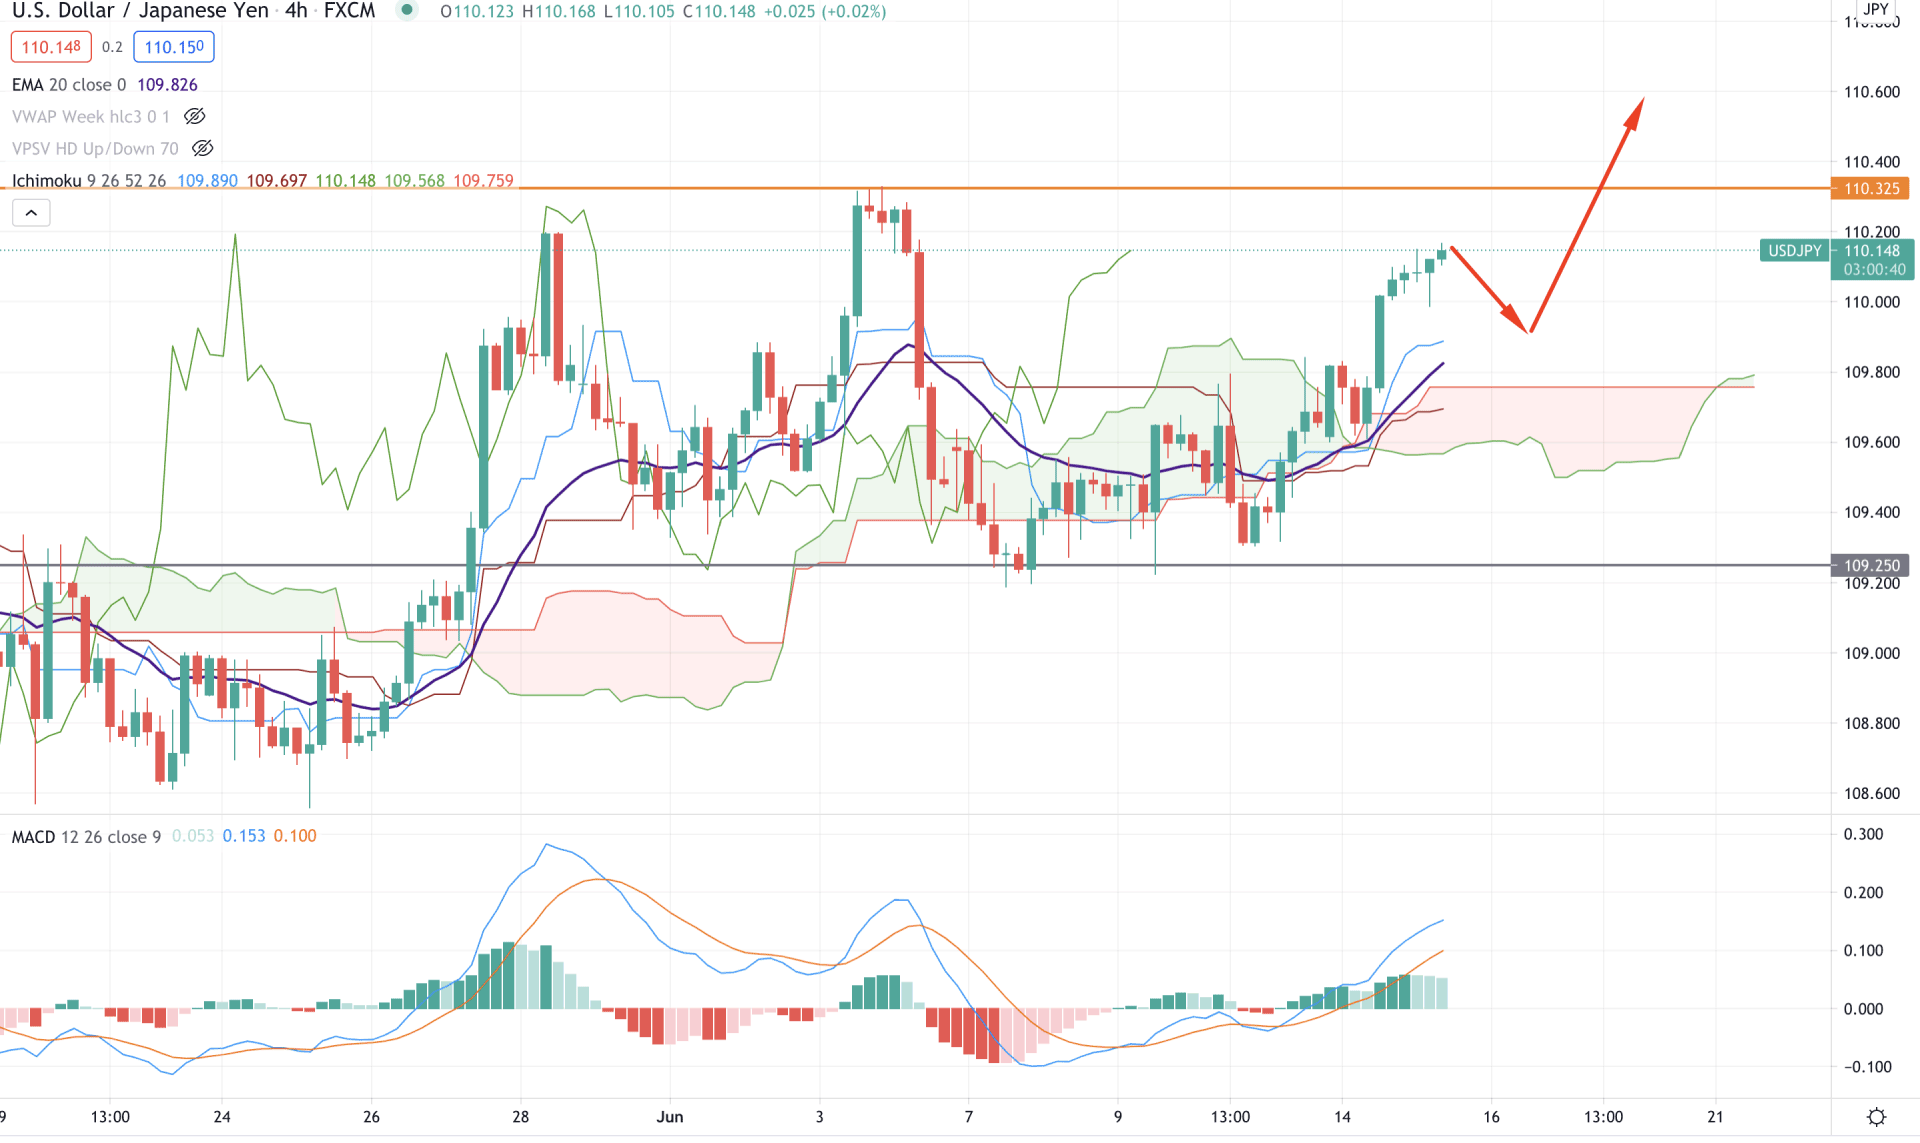
Based on the Ichimoku Kinko Hyo on the H4 timeframe, the USDJPY broke above the Kumo Cloud with an impulsive bullish pressure on today’s early Asian session. Moreover, Senkou Span A moved above the Senkou Span B and headed upwards in the future cloud. Therefore, based on the Ichimoku price reading, the overall outlook is bullish.
In the above image, we can see the H4 chart of USDJPY where the price moved higher and created a gap between the dynamic Kijun Sen. Therefore, the price may come lower in the coming session as a mean reversion before making another bullish leg.
In the indicator window, MACD Histogram is bullish, and there are no signs of regular or hidden divergence. Therefore, as long as the MACD Histogram is above the zero lines, the overall price outlook will remain bullish.
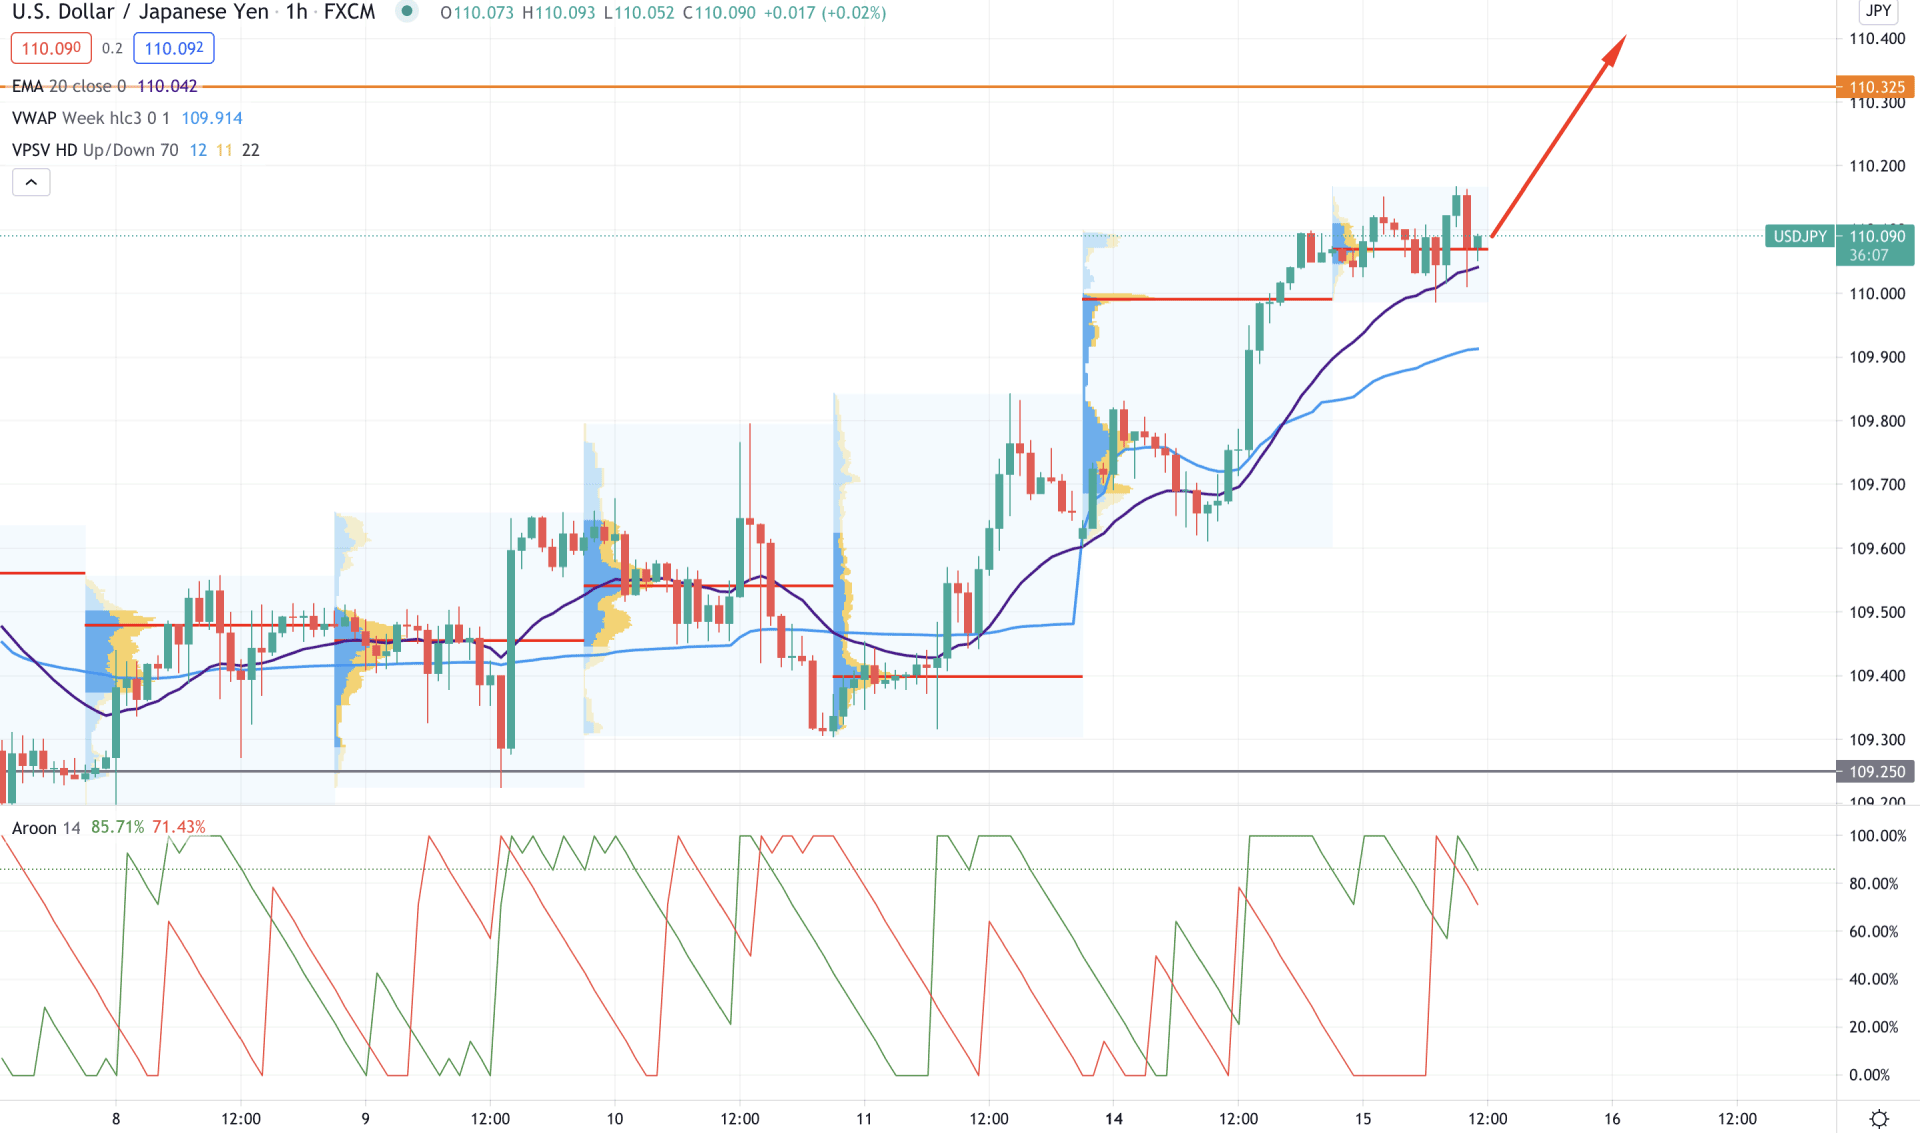
In the intraday chart, USDJPY is trading above the dynamic 20 EMA and vwap, pointing out that buyers are active in the price. Therefore, the bullish outlook may remain active as long as the price is trading above the dynamic vwap level.
In the above image, we can see the H1 chart of USDJPY, where the price is getting minor support from the dynamic 20 EMA. Moreover, the most recent high volume is at the 110.06 level, and the price is consolidating in this area. Therefore any strong bullish H1 close above the recent high of 110.16 may take the price sharply higher towards the 110.50 level.
On the other hand, if the price comes lower below the vwap level with a bearish H1 close, it may move more down towards 109.25 area.
As of the above discussion, we can say that USDJPY has a higher possibility of moving higher following the intraday buying pressure. The primary target of the bullish pressure will be 111.00 level, and above this level, the next target would be 112.21 level.
Conversely, a strong bearish H1 close below the intraday resistance 109.82 may alter the current market structure that may take the price down towards the 109.25 level.


