
Published: December 18th, 2025
The Japanese Yen (JPY) continued to lag its U.S. counterpart for the second day in a row, pushing the exchange rate above the weekly range. The JPY is being undermined by concerns about Japan's deteriorating fiscal situation and by some trade shifting ahead of significant central bank event risk. Nonetheless, a lower-risk tone and the rising consensus that the BoJ will raise interest rates on Friday may help limit declines in the safe-haven JPY.
The JPY bears may decide to hold off on making bold wagers in favor of waiting for additional clues regarding the BoJ's future course. Therefore, the subsequent press conference by BoJ Governor Kazuo Ueda will be the primary focus. Meanwhile, the US dollar's (USD) attempted recovery is constrained by growing expectations of additional interest rate reductions by the US Federal Reserve, which could be detrimental to the USD/JPY exchange rate.
Furthermore, before preparing for any significant devaluation of the lower-yielding JPY, some care should be exercised due to the conflicting BoJ-Fed policy outlooks.
Some repositioning trades ahead of the BoJ event risk are pressuring the Japanese yen. Ahead of this Thursday's start of a 2-day Bank of Japan conference, traders have become cautious and avoid making bold directional predictions about the Japanese yen. It is widely expected that the Federal Reserve will raise the interest rate to 0.75%, a three-decade high, when it announces its policy on Friday.
Let's see the further outlook from the USDJPY technical analysis:
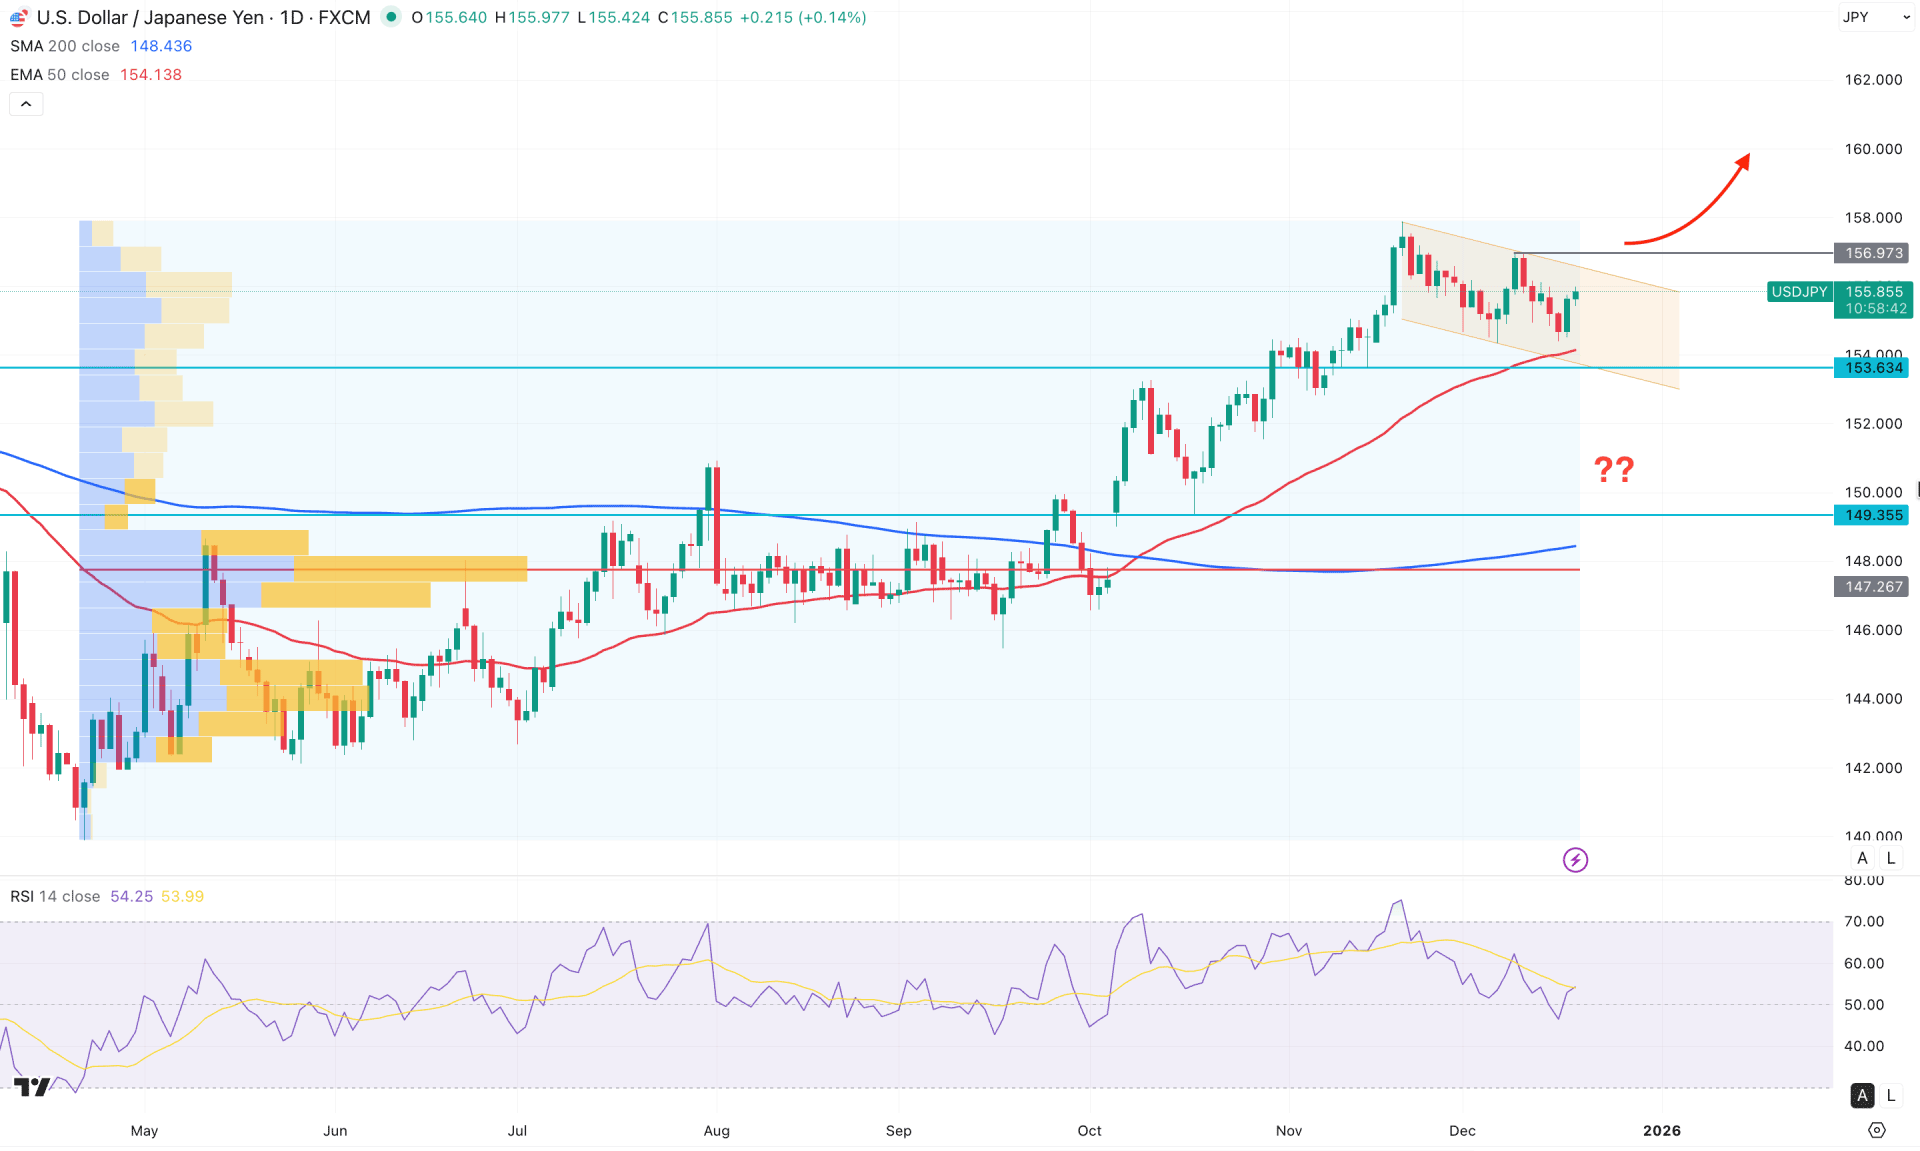
In the daily chart of USDJPY, overall market momentum is bullish, with the market currently sideways within the descending channel. In that case, investors might expect a bullish continuation opportunity after having a proper validation.
At the higher timeframe, buying pressure has persisted for three consecutive months, with no sign of a top formation. Moreover, the weekly timeframe shows sideways momentum at the top, from which additional confirmations are needed before anticipating a bullish expansion.
In terms of volume, the largest activity level is below the current price, and the wider gap suggests a potential downside correction as a mean-reversion pattern. However, as long as the high volume line remains below the current price, the major market momentum will be bullish.
In the main price chart, the 200-day Simple Moving Average is way below the current price, suggesting a major bullish trend. Moreover, the 50 EMA is having a bullish crossover in the descending channel support, signalling an immediate buying pressure.
In the secondary indicator window, the Relative Strength Index (RSI) remains at the 50.00 neutral line, signalling a sideways momentum. However, a rebound from the overbought 70.00 level with the ADX below the 20.00 line signals a limit to bulls.
Based on the overall market structure, the USDJPY is more likely to extend the major bullish trend once a channel breakout validates it. In that case, the immediate resistance to look at is the 160.00 psychological line. On the bullish side, a valid break with stable price action above 156.97 could extend buying pressure beyond 160.00.
On the bearish side, an immediate downside correction is pending as a channel extension, with immediate support at 153.63. Below this line, the next support to look at is the 150.00 psychological line.

In the H4 timeframe, the most recent price is trading sideways after having a valid bullish break above the cloud support. However, the Future Cloud is still bearish, where the Senkou Span A hovers below the Senkou Span B.
In the secondary indicator, the MACD Signal line formed a bullish crossover, following the dynamic Kijun Sen line. It is a sign of a major bottom formation from where a bullish rebound is possible. Moreover, the MACD Histogram hovers above the neutral line for an extended period, signalling a confluence of buying pressure.
Based on this outlook, the ongoing buying pressure is valid, as the price is more likely to extend the momentum above the 157.00 area. However, a struggle to maintain buying pressure above the cloud support area could be a challenging factor for bulls. In that case, a break below the 154.33 line with a consolidation might take the price even lower.
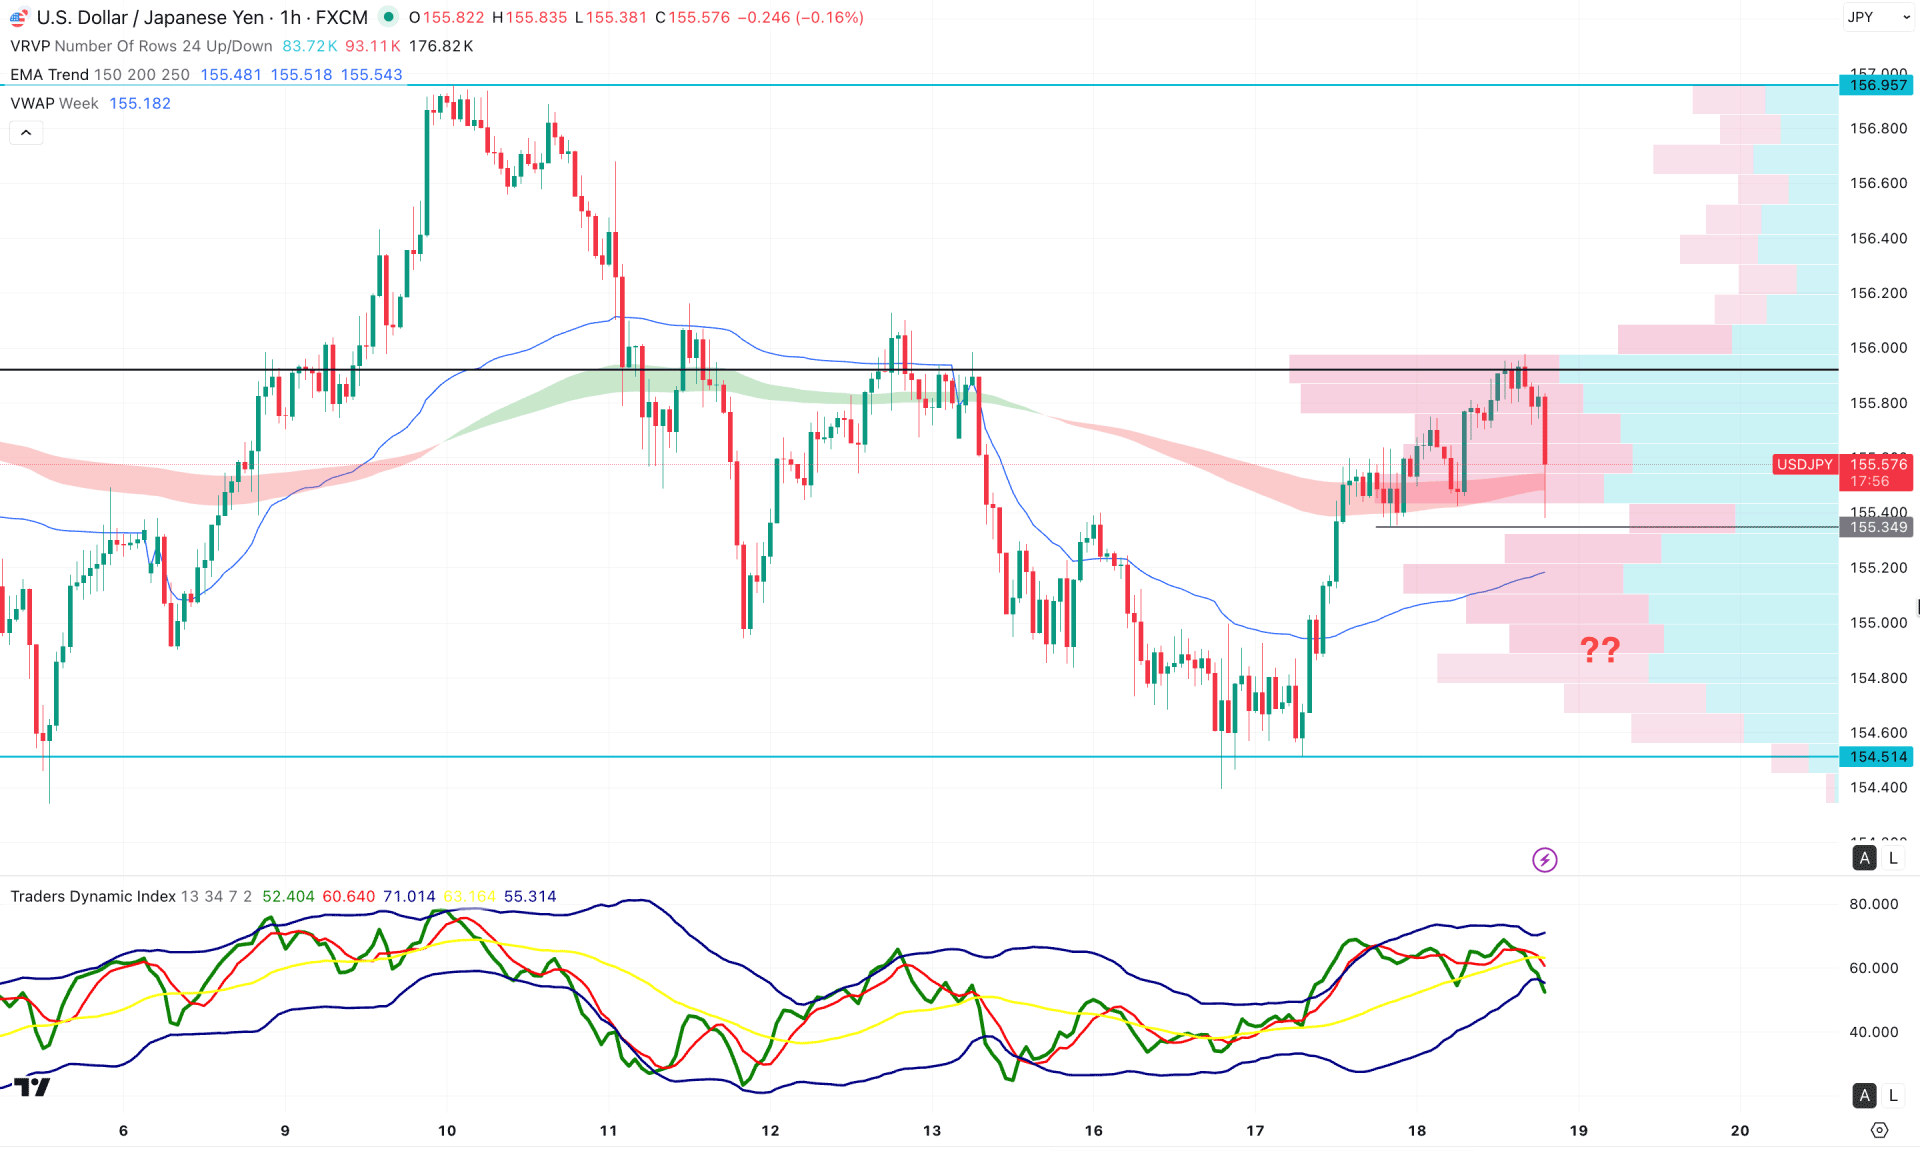
In the hourly timeframe, extended volatility is evident, with the current price hovering near the exponential moving average (EMA) wave. The weekly BWAP remains below the current price, displaying a bullish slope and acting as immediate support.
On the other hand, the high-volume level lies above the current price and must be breached to validate bullish continuation.
In the indicator window, the Traders Dynamic Index (TDI) has reversed and moved toward the lower peak area, indicating sustained selling pressure in the market.
Based on this outlook, sustained pressure below the 155.34 level within a broader bullish structure could present a long opportunity, targeting 156.00. Additionally, a strong bullish signal with an hourly close above 156.00 could offer another long opportunity, targeting the 156.96 resistance level.
From an overall market-structure perspective, USDJPY is trading within a bullish trend, with room for a corrective pullback. A short-term bearish correction is possible; however, the formation of a solid bottom could validate renewed long opportunities in line with the prevailing major trend.


