Published: March 29th, 2022
The bullish momentum towards the US Dollar found a path after the recent rate hike where the Fed mentioned more tightening policies in the coming quarters. Due to the intense buying pressure in the US Dollar, CHF found a bottom by influencing bulls to make the 2022 high at 0.9460 level.
On the other hand, the SNB showed a neutral sentiment at the recent meeting by leaving the interest rate unchanged at -0.75%. Moreover, the new inflation rate was set to 2.1% for 2022, which might reduce to 0.9% within 2024. Besides, the SNB is positive about the Swiss economy despite a clash between Ukraine and Russia. It also added that the global energy price might remain higher with no sign of reducing the supply.
The upcoming Non-farm payroll will be the price driving event for USDCHF, where the current expectation is 485K new Jobs against the previous report of 678K. Moreover, the unemployment rate may decline by 0.1%, with an increase in average hourly earnings by 0.4%. In that case, any better-than-expected report on NFP or average hourly earnings would be a bullish factor for USDCHF price.
However, investors should closely monitor the price action and market sentiment before taking any position in this pair. Let’s see the upcoming price direction from the USDCHF technical analysis:

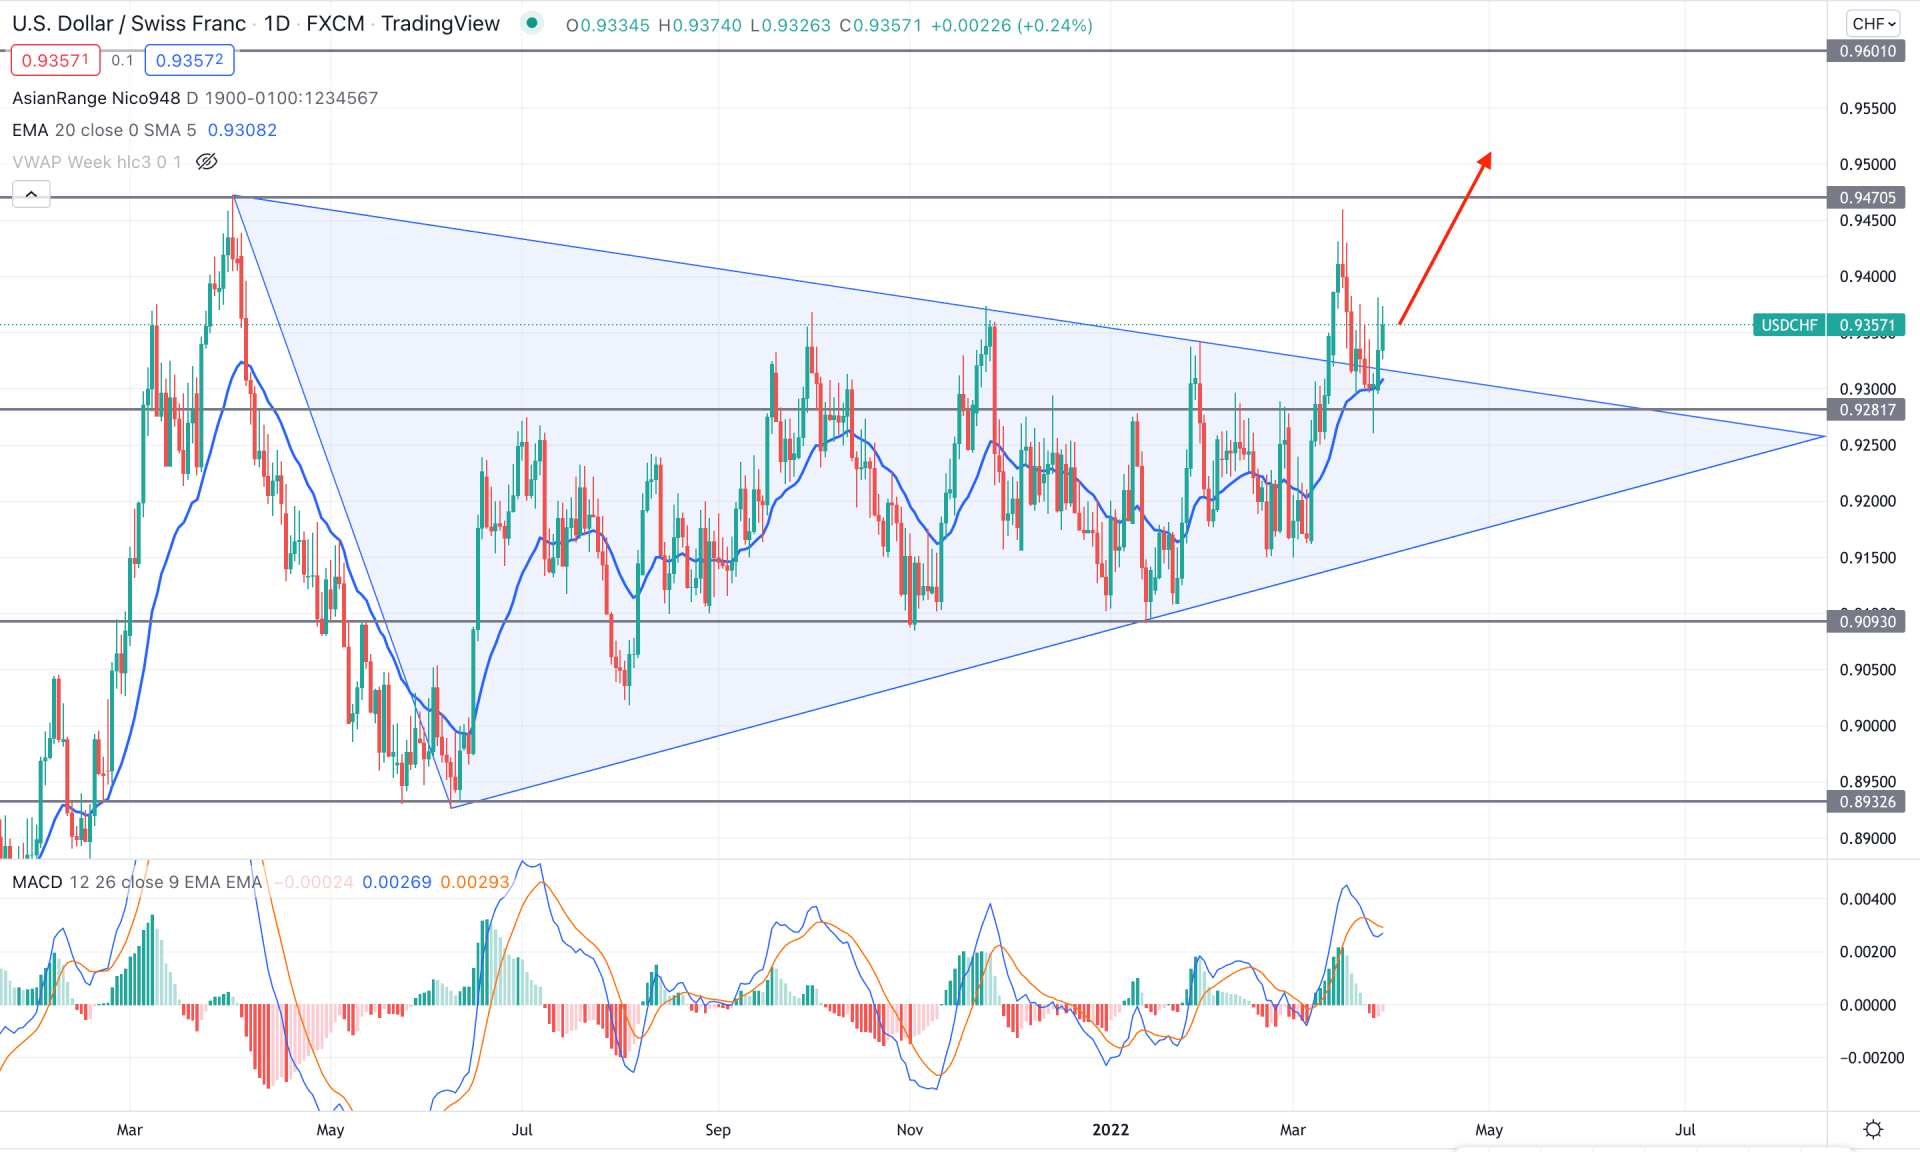
In the USDCHF daily chart, the price failed to show any significant movement after the March 2021 swing, which made a 537 pips downside movement. Later on, the price went corrective where the indecisive momentum became visible with the symmetrical triangle formation. However, the recent FOMC statement and Fed rate hike influenced investors to transfer their faith from CHF to USD. As a result, the price made a new swing high at the 0.9460 level since May 2021 with a symmetrical triangle breakout.
The above image shows how the price formed an impulsive bullish leg from the triangle resistance and corrected lower. Moreover, after completing the correction, the price formed bullish rejections from the dynamic 20 EMA with a confluence. The buying pressure failed to hold the bearish momentum in the MACD Histogram that reached the neutral zone from the bearish area.
Based on the current price structure, investors should find buying opportunities in the lower timeframes where the primary price target would be towards the 0.9470 level. On the other hand, the 0.9280 level would be the main barrier for bulls, where a bearish daily candle below 0.9280 would open room for testing the 0.9093 area.

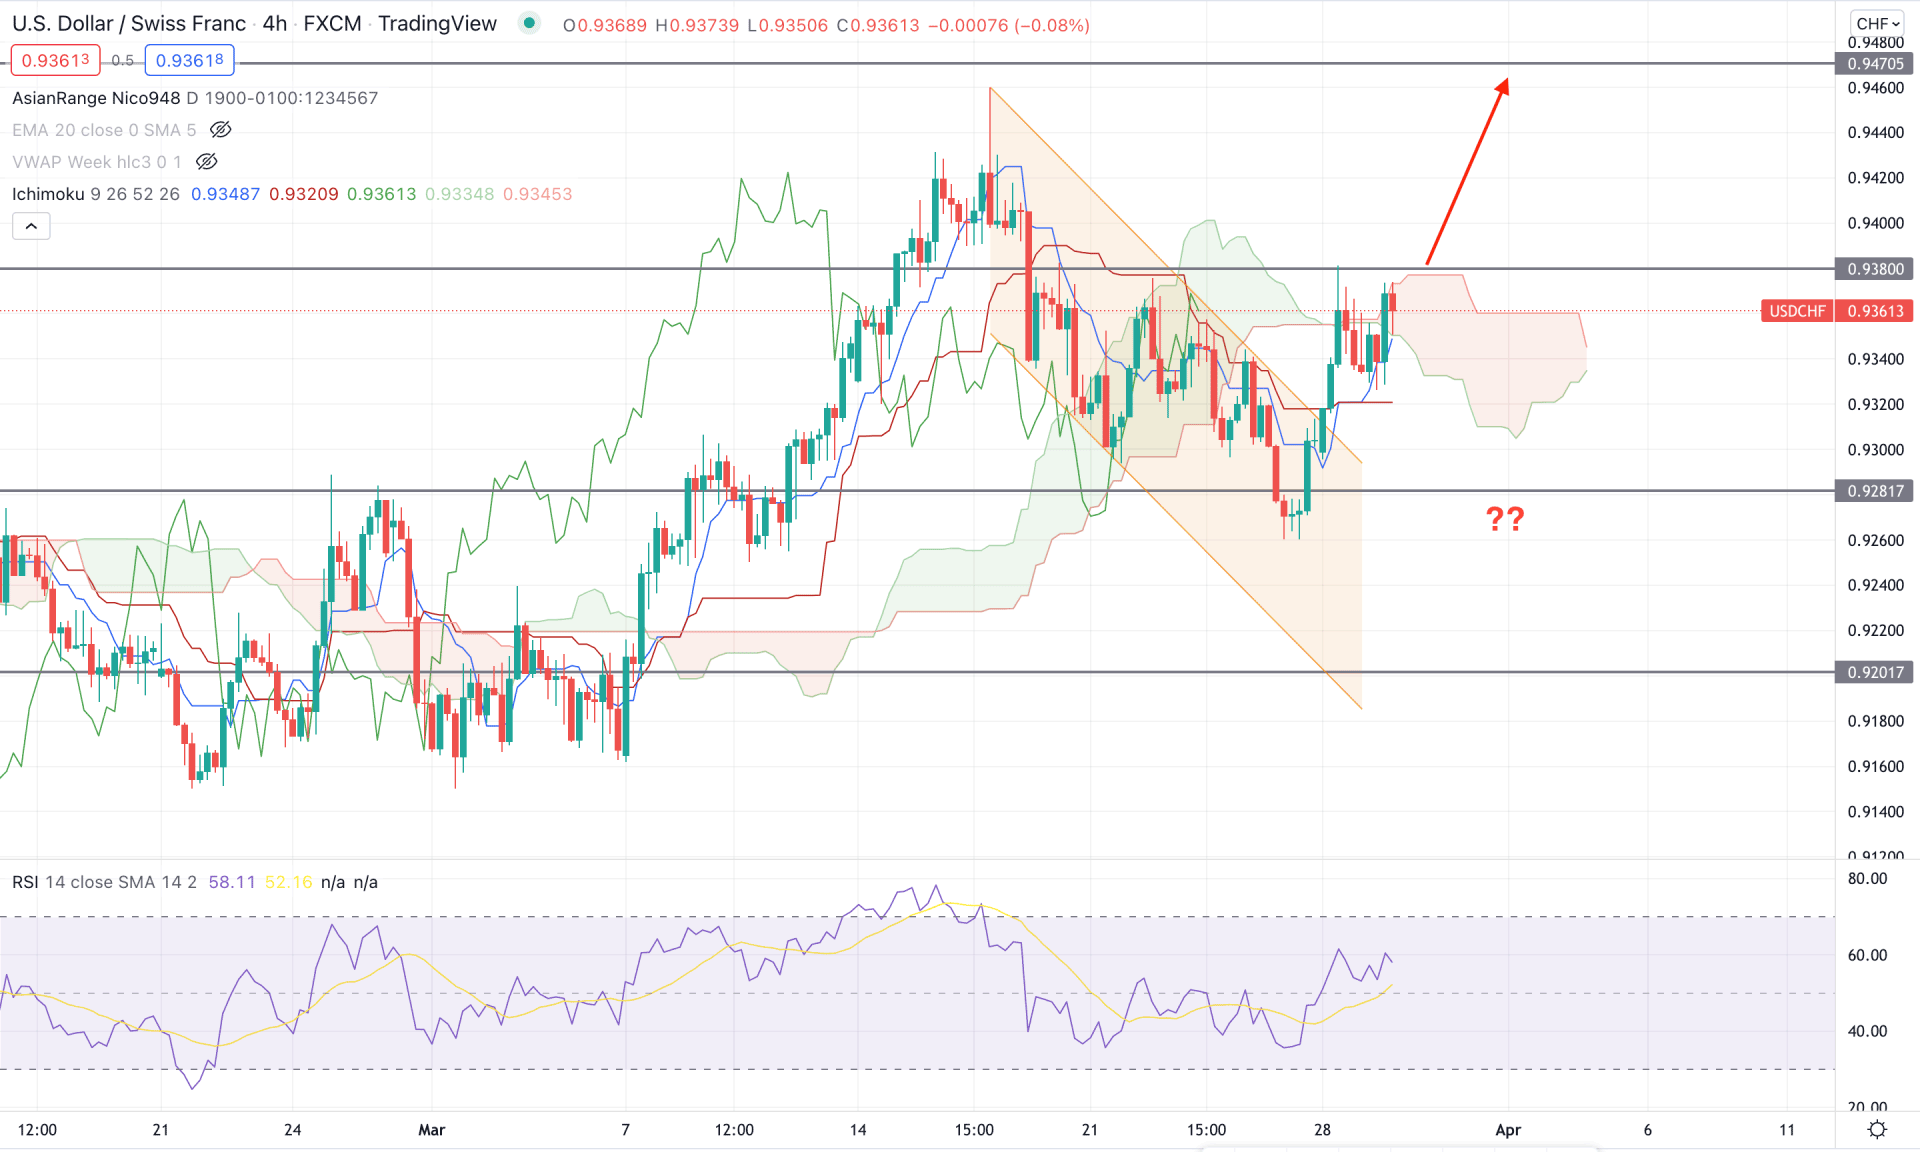
In the H4 timeframe, the USDCHF price moves within a crucial momentum where multiple buying signs are visible. The first is the most recent bearish channel breakout with an impulsive bullish pressure. Moreover, the second one is the golden cross in Ichimoku Tenkan and Kijun lines. On the other hand, the future cloud remains bullish while the Lagging Span awaits a bullish breakout.
The above image shows how the price trades at the Kumo Cloud area, where a bullish H4 candle above the 0.9380 static resistance level would be the first sign of possible buying pressure. On the other hand, the RSI line remained above the neutral 50 level with an open space to test the overbought 70 level.
Based on these findings, we can say that a bullish H4 close above the 0.9380 level would trigger USDCHF bullish position where the aim is to test the 0.9470 level. On the other hand, a strong rebound with a bearish candle below the dynamic Kijun Sen would be a bearish opportunity where the primary target would be towards the 0.9200 level.

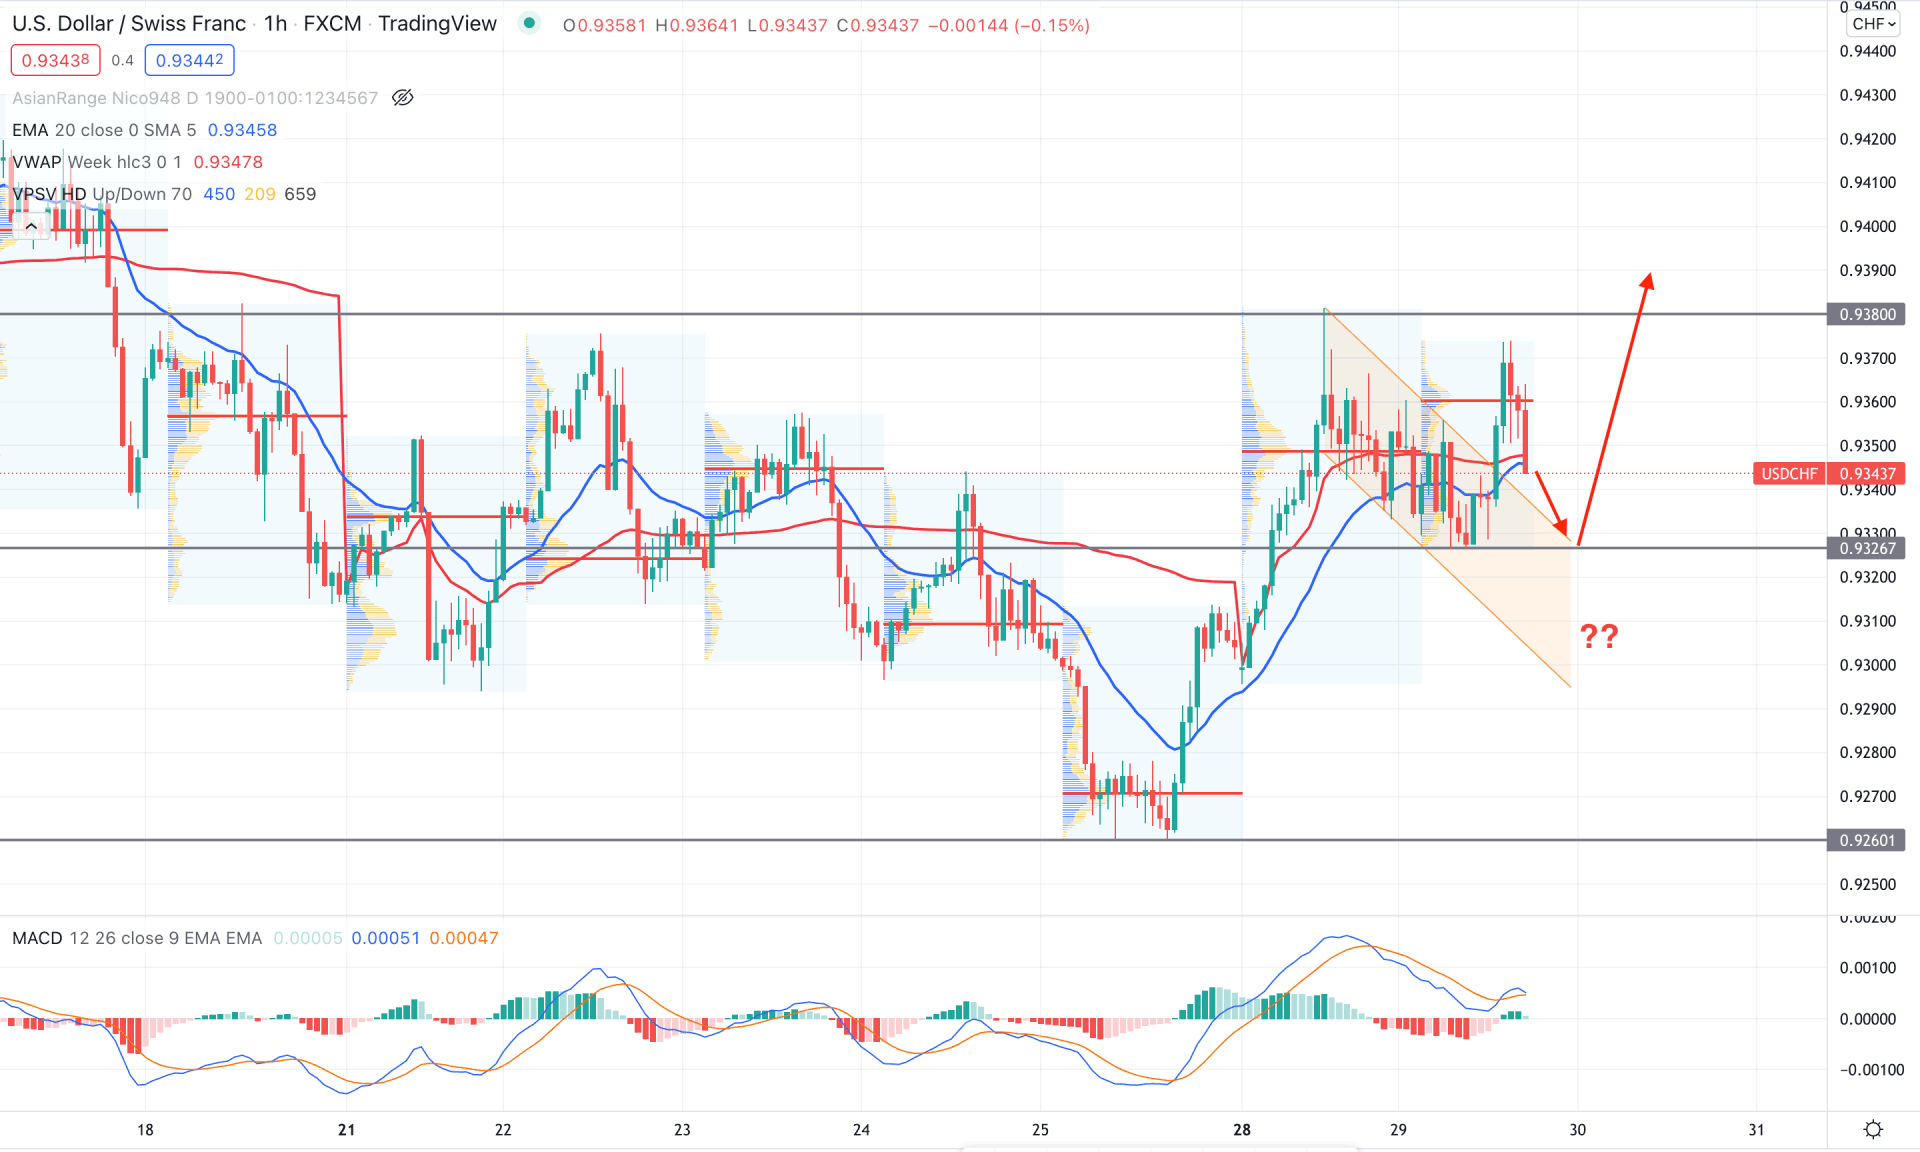
In the USDCHF intraday chart, the price is trading with higher volatility. Still, the recent buying pressure from the bearish channel breakout opened the possibility of following the broader market trend. However, the current price is struggling to stay above the dynamic 20 EMA support, while the latest intraday high volume level moved above the current market price.
The above image shows how the price trades within the 0.9380 to 0.9326 zone, where a bearish h1 close below the 0.9326 level would be an alarming sign for bulls. On the other hand, the MACD Histogram is still bullish with no sign of divergences. Therefore, any bullish rejection and H1 candle above the dynamic weekly VWAP would be a buying opportunity in this pair.
Conversely, if sellers take the price below the 0.9326 level in the intraday chart, it may visit the 0.9260 level before showing a buying sign.
Based on the current multi-timeframe analysis, USDCHF is more likely to extend the buying pressure based on the long-term pattern breakout. However, investors should monitor the intraday price closely before approaching buy, where the 0.9260 level would be the ultimate invalidation level for bulls.