Published: July 24th, 2025
The USDCHF pair enters a pessimistic consolidation stage and hovers around the 0.7920 region, which is near a three-week low reached the day before.
A significant reason operating as a tailwind for the USDCHF combination is the US Dollar's (USD) continued inability to draw in any significant buyers and its almost two-and-a-half-week decline. Investors appear unsure about when and how quickly the Federal Reserve will likely lower interest rates. Furthermore, the USD bulls remain on the defensive due to concerns that growing political meddling may jeopardise the central bank's liberty.
Jerome Powell, the chairman of the Federal Reserve, has been under fire from Donald Trump, the US president, for failing to reduce borrowing costs. Trump has also demanded the resignation of the central bank's head on numerous occasions. The new Fed Chair candidate is expected to be revealed in December or January, according to US Treasury Secretary Janet Yellen. This increases uncertainty and prevents the USD from showing any real recovery, which hurts the USDCHF exchange rate.
Nevertheless, current trade optimism discourages traders from making strong bullish wagers on the safe-haven Swiss franc (CHF) and continues to maintain a positive risk attitude. While reports indicate that the US and the European Union are moving toward a 15% trade deal, Trump declared on Tuesday that the Trump administration had reached a trade agreement with Japan. This is regarded as a crucial element that, at least for the time being, helps keep the USDCHF pair from declining too much.
Let's see the upcoming price direction from the USDCHF technical analysis:

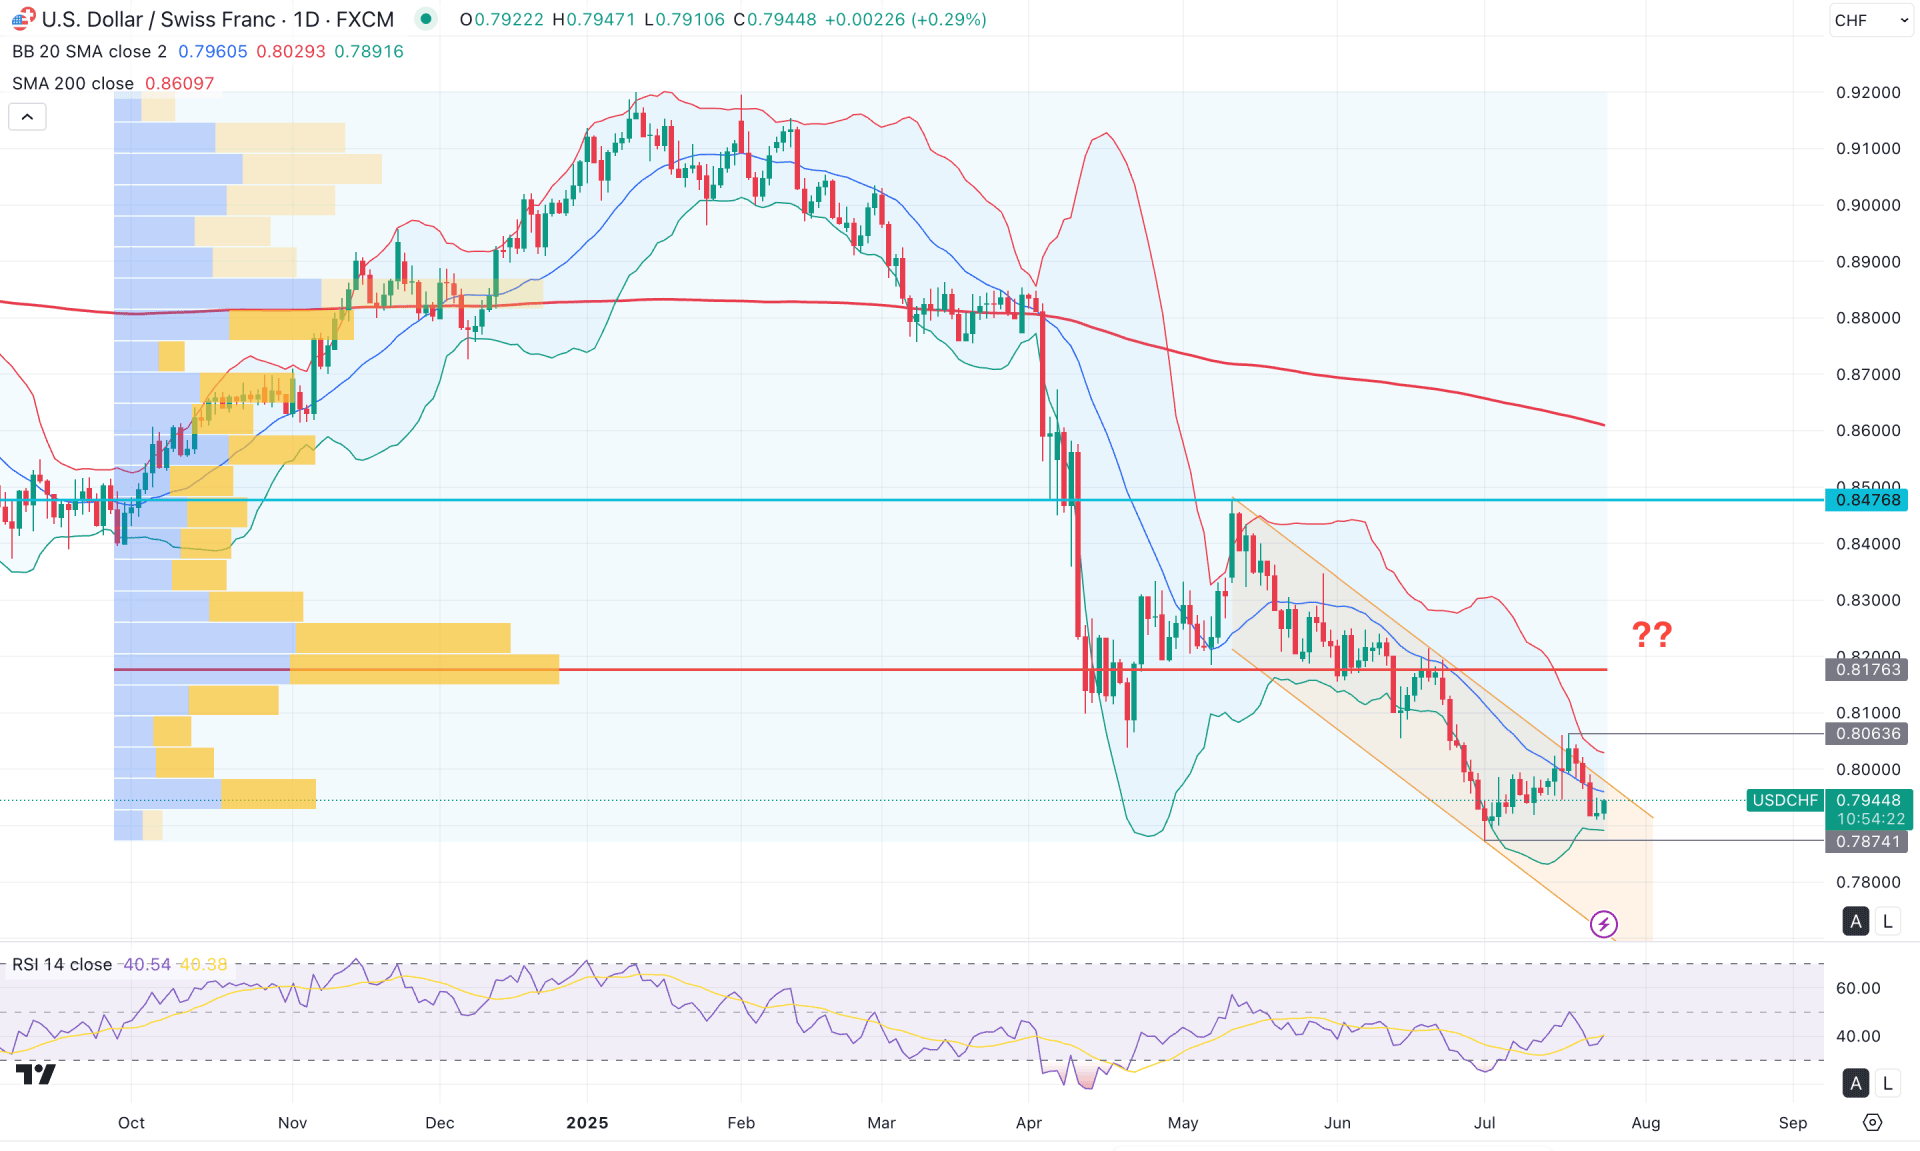
In the daily chart of USDCHF, ongoing downside pressure is evident as recent prices continue to trade within a descending channel. Since a rejection from the channel resistance is possible, investors should remain cautious before considering any long positions.
Looking at the higher time frame, the bearish pressure is valid, as the monthly chart shows five consecutive red candles. The current price action is extremely bearish, with the pair reaching a 12-year low. Moreover, the weekly chart shows no signs of a bullish reversal at the bottom, indicating no significant buying interest at this stage.
Analyzing the volume structure, the last major activity level from September 2024 remains above the current price, further supporting the downside bias. Since the higher time frame structure is still bearish, investors may expect the price to decline further until a valid bottom is formed.
In the daily chart, the Bollinger Bands are narrowing, suggesting a potential corrective phase. However, the price is still trading below the upper band, and a valid reversal candlestick pattern may signal a continuation of the bearish move. From a long-term perspective, the 200-day SMA is well above the current price and the crucial swing level at 0.8476. As long as the price remains below the 200-day SMA, the downside momentum could continue—even if short-term bullish corrections appear.
In the secondary indicator window, the Relative Strength Index (RSI) has rebounded from the oversold zone and is currently hovering between 30 and 50. As long as the RSI remains below the 50.00 neutral line, extended downside pressure is likely.
Based on the broader market outlook, the long-term trend remains bearish, as confirmed by the daily 200-day SMA and the positioning of the Bollinger Bands. A daily candle close below the 0.7873 level could offer a high-probability short opportunity, with a potential target toward the 0.7600 area. However, a bullish breakout above 0.8066 might encounter resistance at the high-volume node before resuming the downtrend.
On the other hand, any immediate bullish reversal with stable price action above the 0.8476 level could invalidate the bearish scenario and indicate a potential long-term trend reversal toward the 0.9200 level.

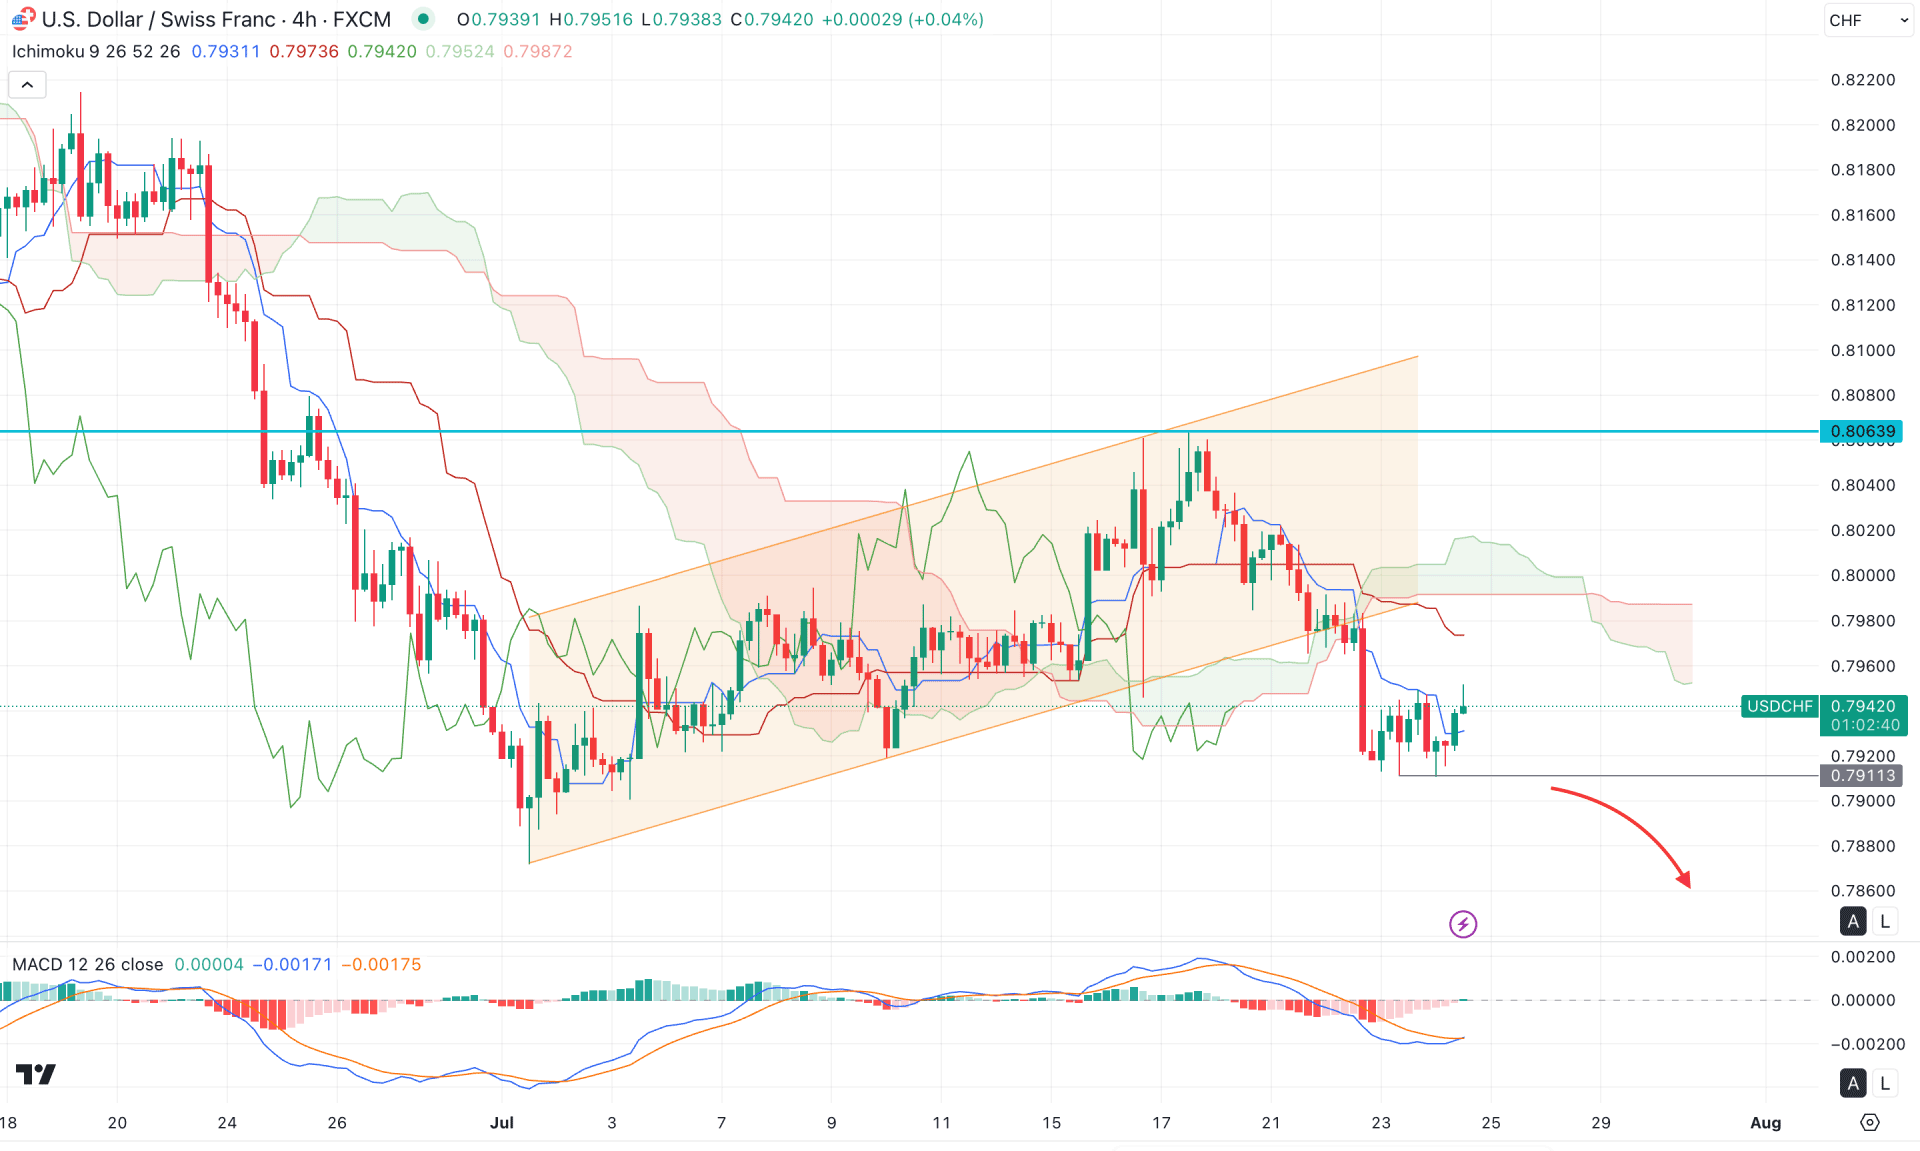
In the 4-hour timeframe, the recent price is trading below the Kumo cloud area, indicating a valid continuation opportunity for sellers. After a bullish correction within a descending channel, the price broke below the channel support and established a stable position beneath the Kumo cloud. Meanwhile, the future cloud also supports the bearish outlook, as the Senkou Span A line remains below Span B.
On the other hand, the near-term dynamic lines are positioned above the current price and are acting as resistance levels. However, a bullish recovery above the Tenkan-sen line, along with a bullish crossover in the MACD signal line, suggests a possible short-term upward correction.
Based on the current market outlook, the downside pressure requires further confirmation, as the price is currently trading around the Tenkan-sen line. In this scenario, a bearish reversal with a 4-hour candle closing below the 0.7911 level may confirm a short opportunity, targeting the 0.7800 area.
Conversely, if the MACD histogram flips bullish and the price stabilises above the 0.8000 level, it may indicate an intraday correction, with the ultimate objective of testing the 0.8158 imbalance high.

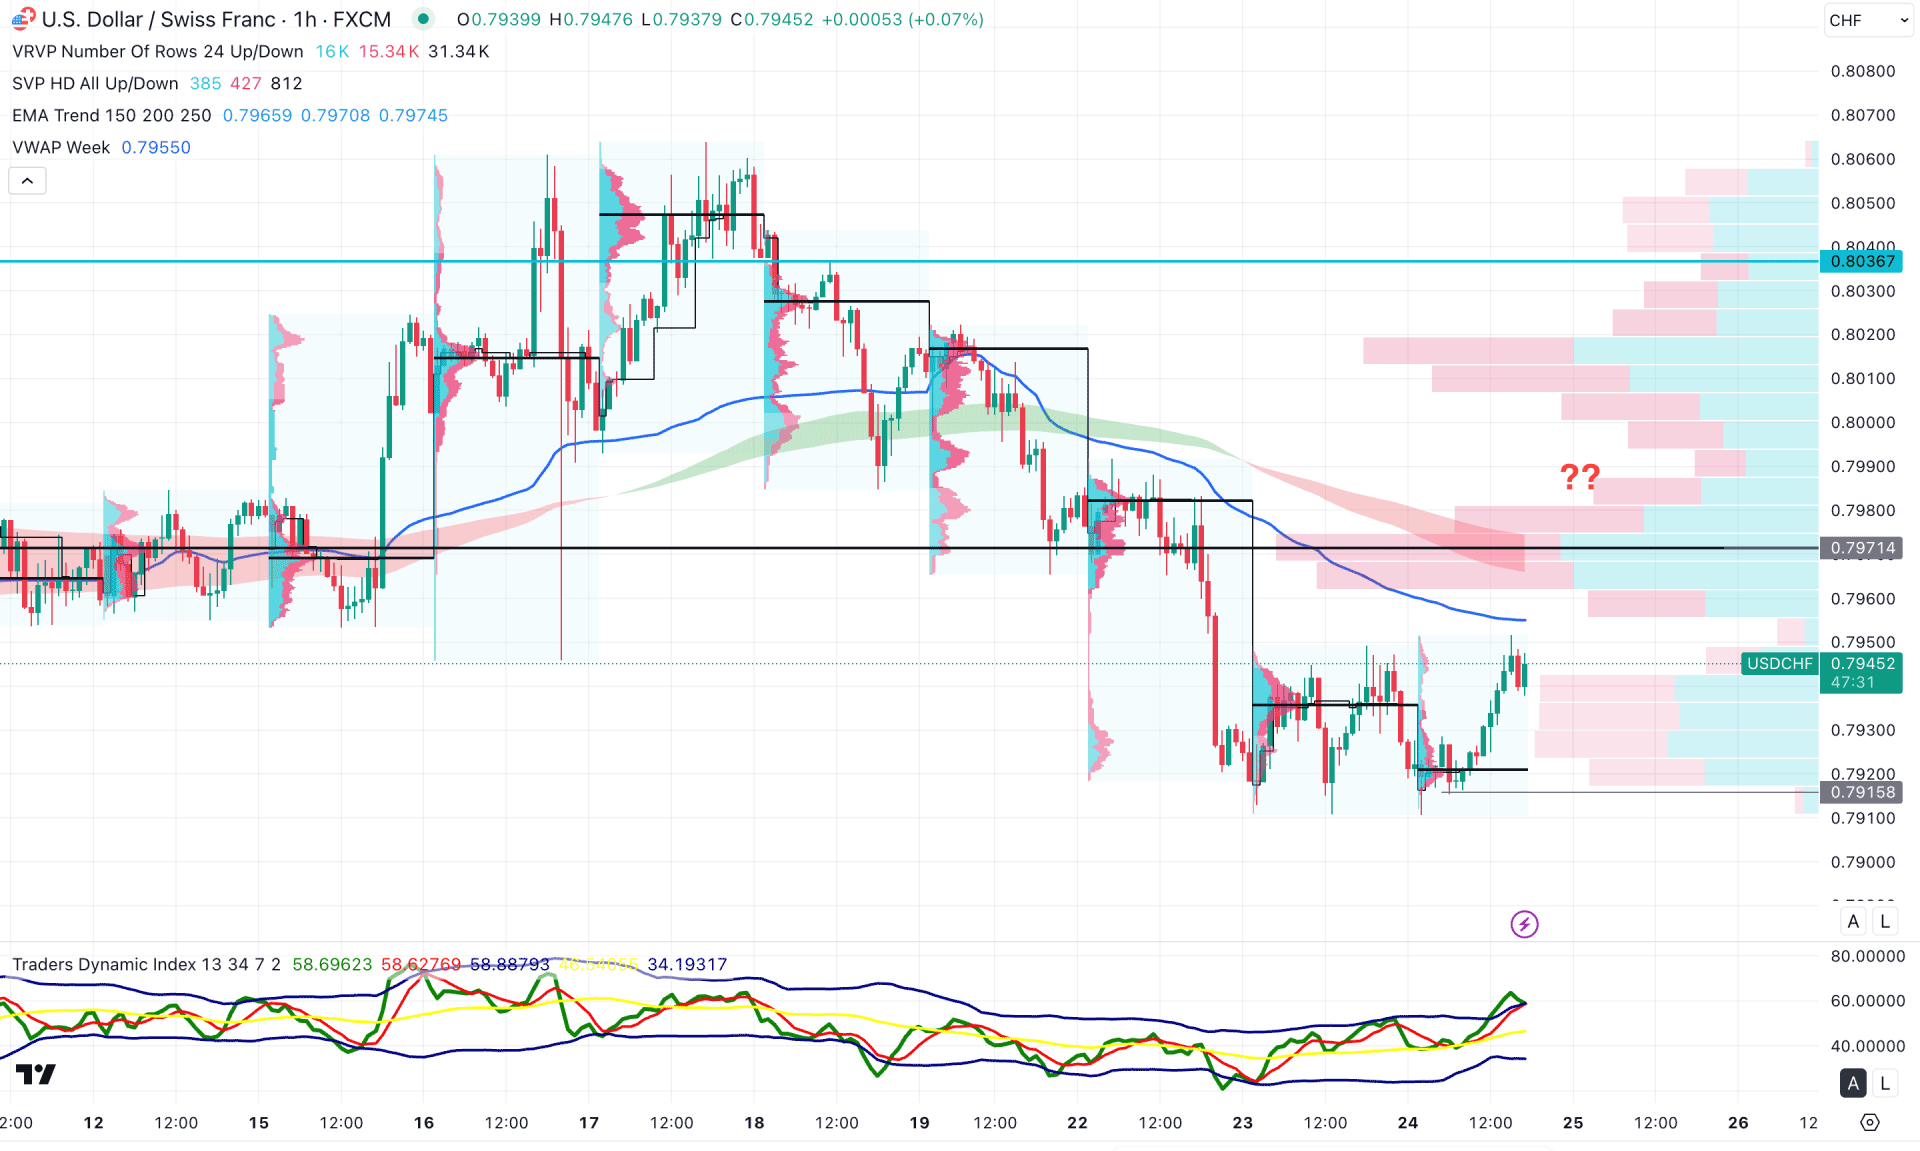
In the hourly timeframe, bearish continuation is evident as the recent price action shows consecutive lower lows from the 0.8000 top. Additionally, the latest price has found resistance at the weekly VWAP level, from where selling pressure has resumed. Both the high volume level and the moving average wave are positioned above the current price, further supporting the downside momentum.
In the indicator window, the Traders Dynamic Index has reached a bullish peak, suggesting a possible top formation in the main price action.
Based on the current market structure, a bearish continuation with an hourly candle close below the 0.7920 level could offer a short opportunity targeting the 0.7850 area. Moreover, if extended bullish pressure appears above the 0.7980 level, another short opportunity may arise depending on the price action. On the bullish side, sustained upward pressure above the 0.8000 level is required before expecting further bullish momentum.
Based on the overall market outlook, USDCHF is trading near a multi-year low, with no significant buying pressure observed. Since the price remains under bearish control, a continuation to the downside remains possible. However, any signs of buyer exhaustion or reversal signals near the bottom area could be the first indication of a potential trend change.