

Published: July 30th, 2026
Due to ongoing tensions in the Middle East and investor caution, the Swiss franc remained near its lowest level against the US Dollar.
Citing no serious harm to Swiss banks, the Swiss National Bank is anticipated to maintain its policy rate at zero per cent through 2027. Any reversion to negative interest rates is viewed as a backup rather than the baseline situation.
For the first time since the start of the conflict, Swiss investor mood significantly improved in July.
Markets for currencies are signalling a rise by March of next year, even though most economists only anticipate the initial SNB rate hike in early 2028.
Swiss inflation dropped to 0.5% in June and is expected to peak at just 0.8%, remaining comfortably within the SNB's 0%–2% target range, despite a brief increase linked to the conflict.
In the meantime, the Trump administration imposed further tariffs on Swiss imports, but they remained within the previously established 12.5% ceiling.
As was generally anticipated, the US monetary policy kept rates in the 3.50%–3.75% range, although disagreements among policymakers have increased uncertainty about the Fed's future actions.
Markets maintain high expectations for a September rate hike, which continues to support the dollar. However, the post-FOMC sentiment helped CHF to gain a bit against the US Dollar.
Let's see the further aspect of this instrument from the USDCHF technical analysis:
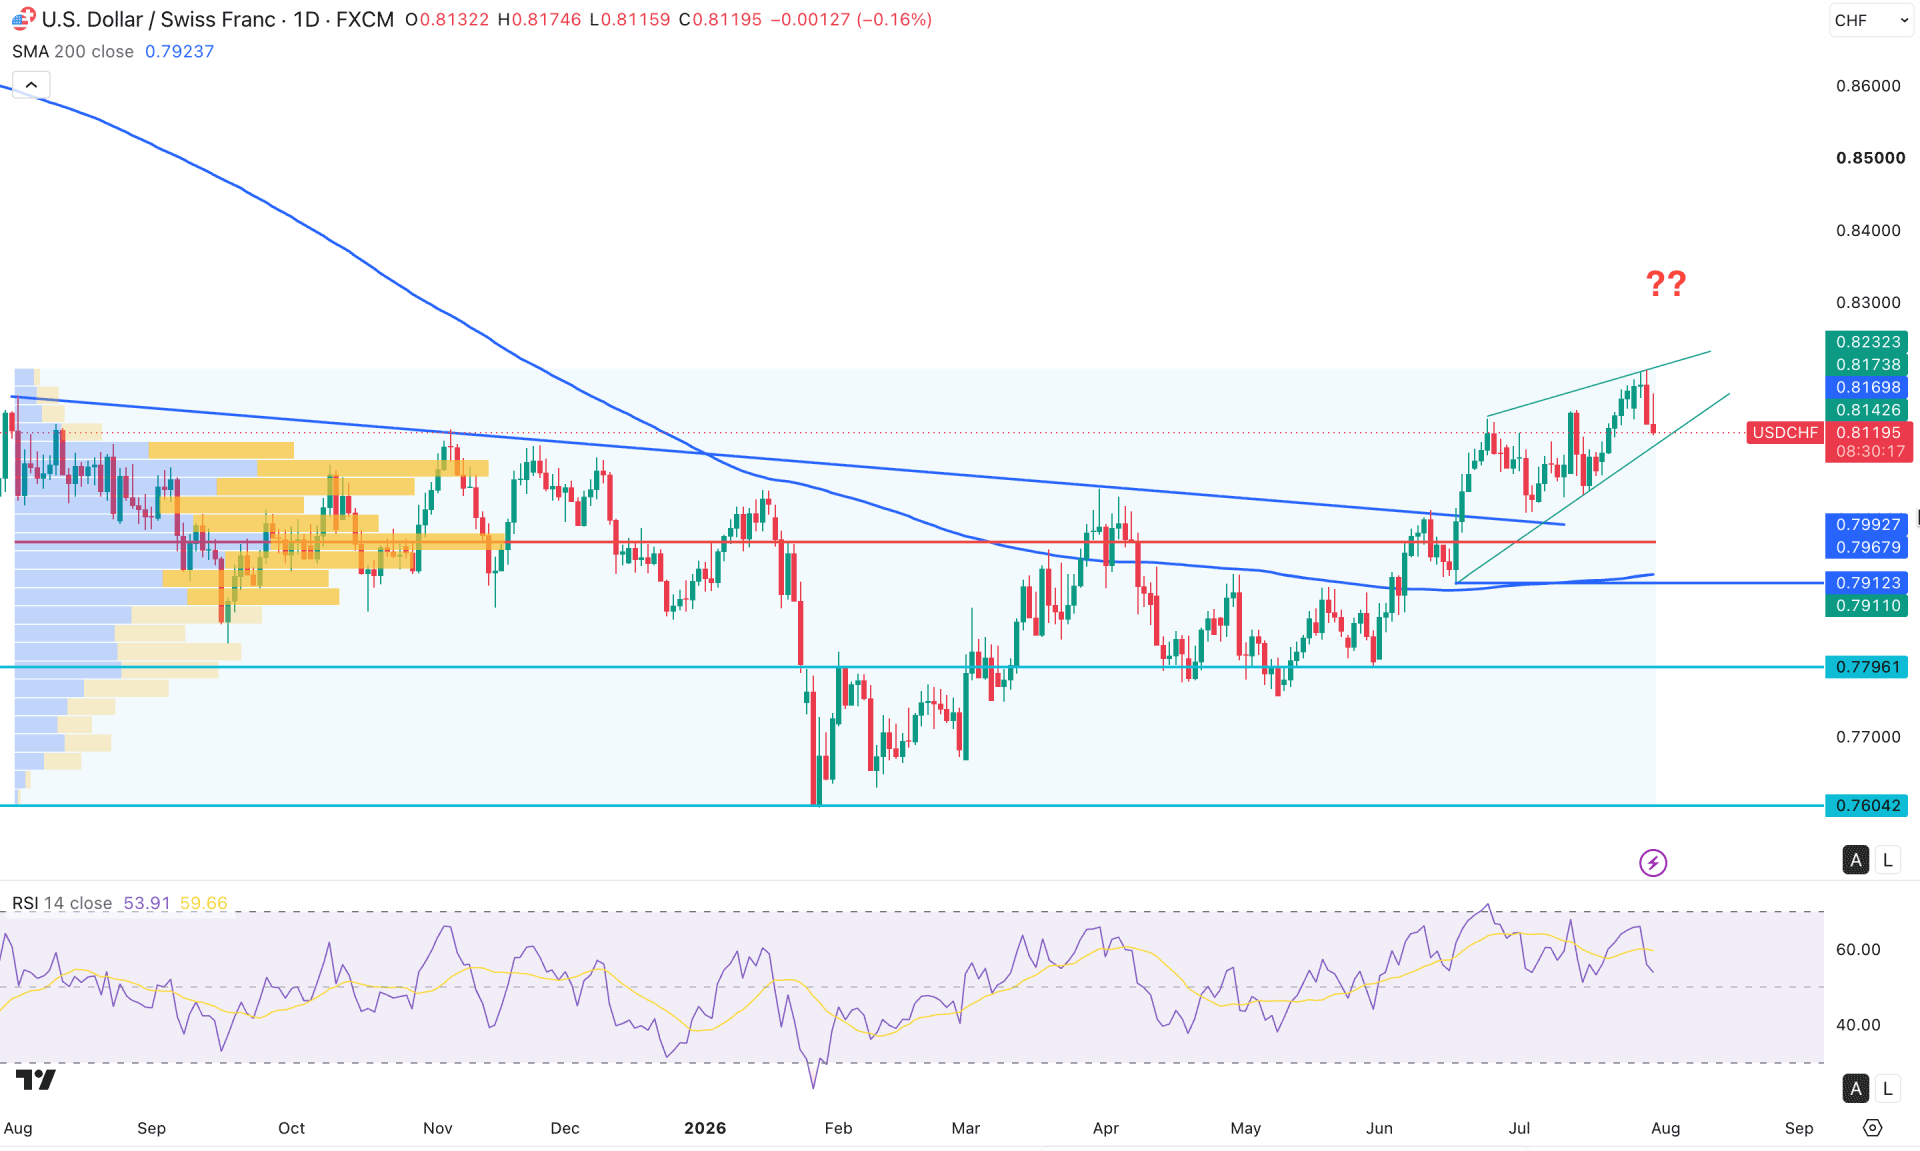
In the daily chart of USDCHF, a corrective bullish rebound is visible. After setting a bottom in January 2026, the price rebounded and created a new yearly high above the 0.8168 swing level. As the recent price is moving sideways near the extreme liquidity zone, a considerable downside correction is pending.
Looking at the higher timeframe, the recent bullish rebound is significant as it came with a valid breakout from the long consolidation. A bullish monthly close is visible, followed by an inside-bar breakout, which could work as a crucial long signal. The weekly timeframe shows a similar outlook: the recent price formed an inverse head-and-shoulders breakout, and the current price is trading above the neckline.
In terms of volume, the recent breakout is also significant as it came with a valid range breakout, taking the price out of consolidation. However, the gap between the current price and the high-volume area has expanded, creating a considerable correction possibility.
Coming to the main price chart, the bullish swing from the 0.7796 bottom became weaker after creating a swing high above the August 2025 high. Instead of extending the buying pressure with impulsive momentum, the price moved sideways and formed a rising wedge pattern. The premium zone, together with corrective market momentum, suggests a possible recovery, but proper validation is needed.
The 200-day SMA is below the current price and just above the 0.7912 static support level. As this crucial dynamic support level is holding from the support area, we may consider the major market momentum as bullish.
In the Relative Strength Index, we can see the recent line hovering within the overbought area above 70.00 without any significant attempt to break higher. Instead, the line moved sideways, and the most recent point is marked around the 55.00 level. As a result, potential divergence is also visible, as the new higher high in price was not followed by the oscillator.
Based on the current market structure, the long-term bullish rebound from the valid bottom is still too early to consider a trend reversal. Moreover, the recent trendline resistance breakout, along with the sideways market at the top, signals a possible downside correction anytime. Investors should closely monitor how the price trades at the pivotal support, as a break below this line could create a short opportunity with a target near the 0.7912 level. However, a break below the 0.7912 area might open room for a new swing low below the 0.7796 area.
The alternative trading approach is to observe the price action at the high-volume support area for a bullish rebound from 0.7966 and 0.7900. This may confirm the trendline breakout and invalidate the break from the rising wedge. In that case, price could resume the existing bullish momentum and create a new swing high above the 0.8200 area.
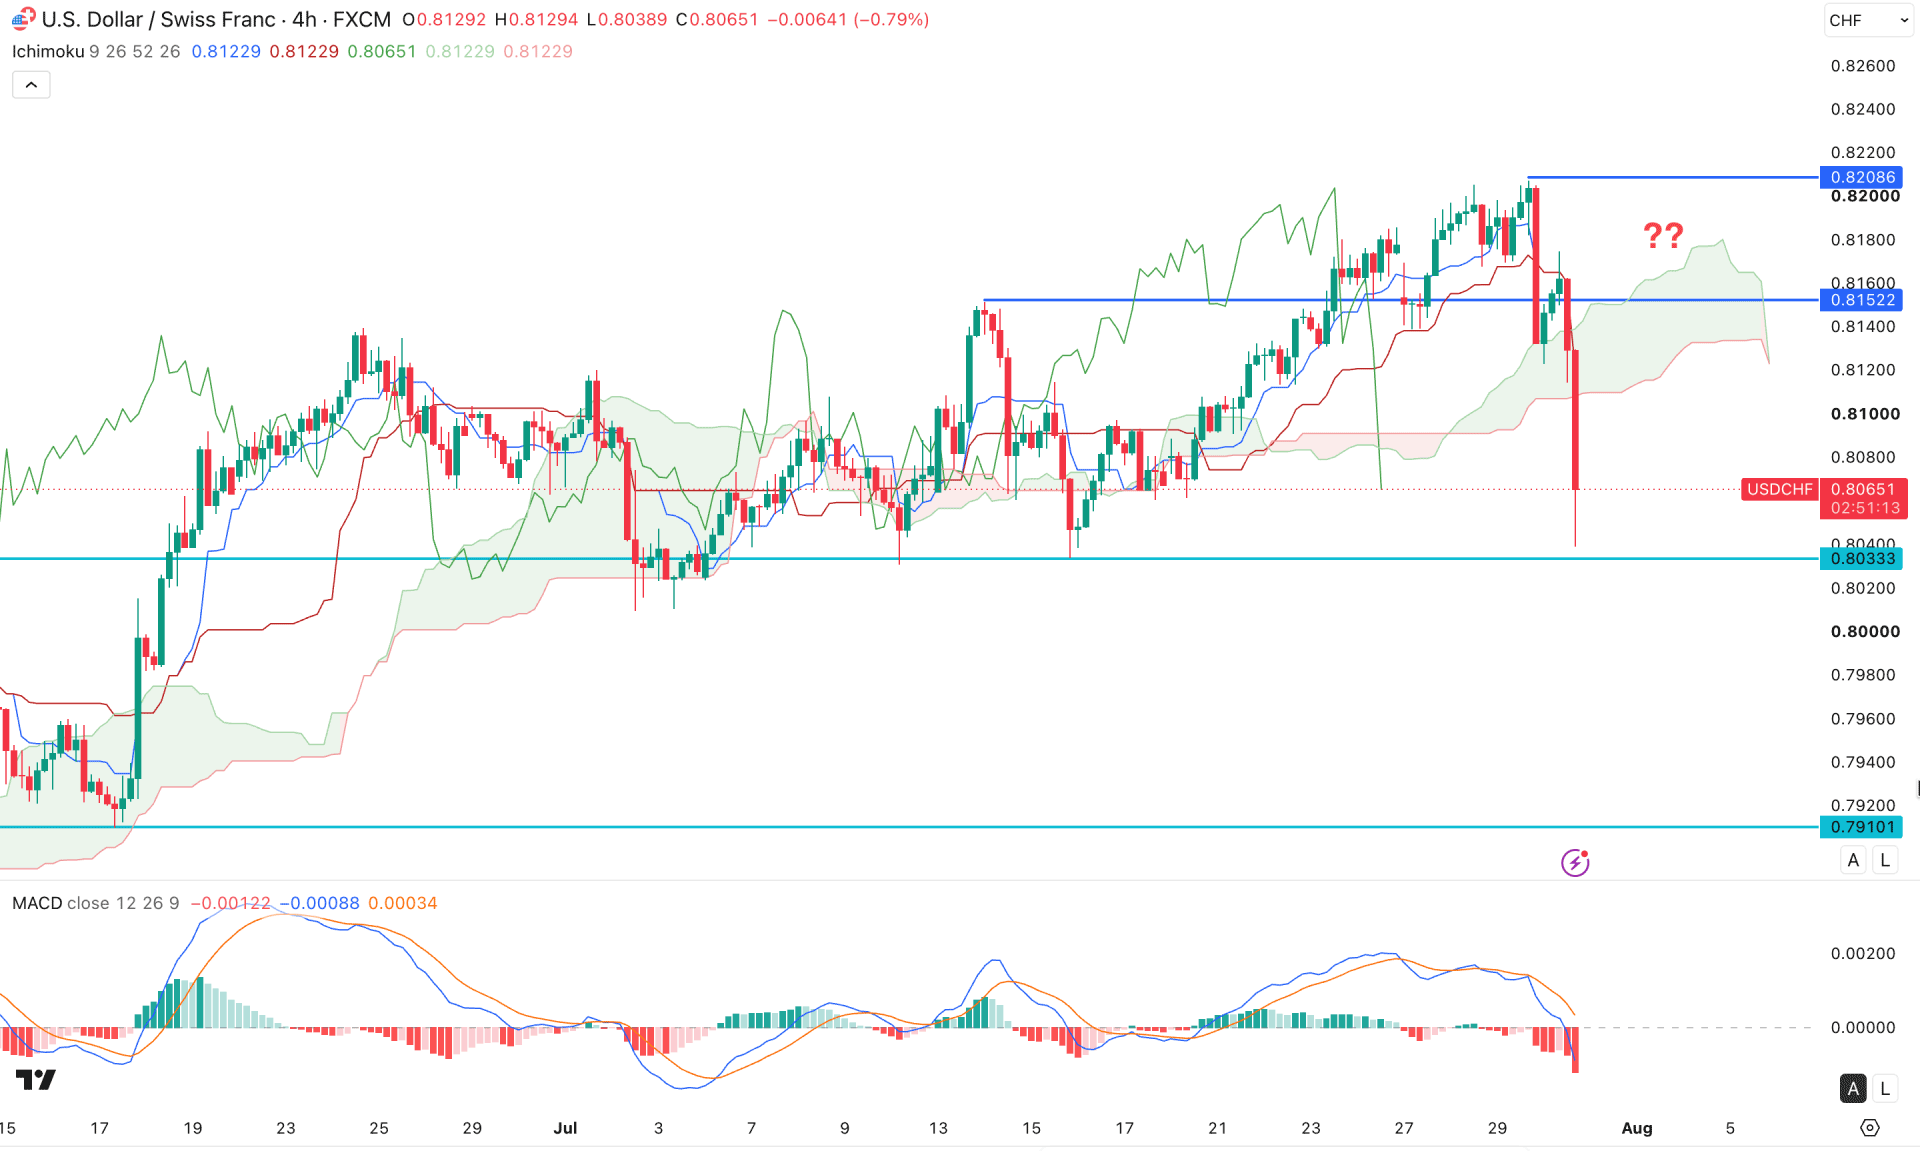
In the four-hour chart of USDCHF, the price shows extensive selling pressure, creating a valid break below the Kumo cloud area. Primarily, this is a sign of a bearish breakout from the Ichimoku cloud, though more confirmation is pending from other Ichimoku functions. The future cloud is still corrective. Both lines are closer together, signalling potential trend exhaustion. Moreover, the recent selling pressure has created a gap with the dynamic resistance level, signaling a pending bullish correction.
In the indicator window, the MACD histogram moved lower and reached its lowest level in a week, signaling ongoing selling pressure in the market. Moreover, the signal line is also sloping downward with more room to move lower.
Based on this outlook, the primary anticipation for this pair would be to look for short setups only as long as the 0.8152 swing high is protected. A valid rebound above this line would invalidate the bearish outlook at any time.
On the other hand, the price is trading with impulsive pressure from the important support level marked at 0.8033. As long as the price remains near this support level, a potential bullish correction is pending toward the dynamic resistance level. However, breaking below the 0.8033 level with a valid breakout could increase the short opportunity and test the 0.7910 key support level.
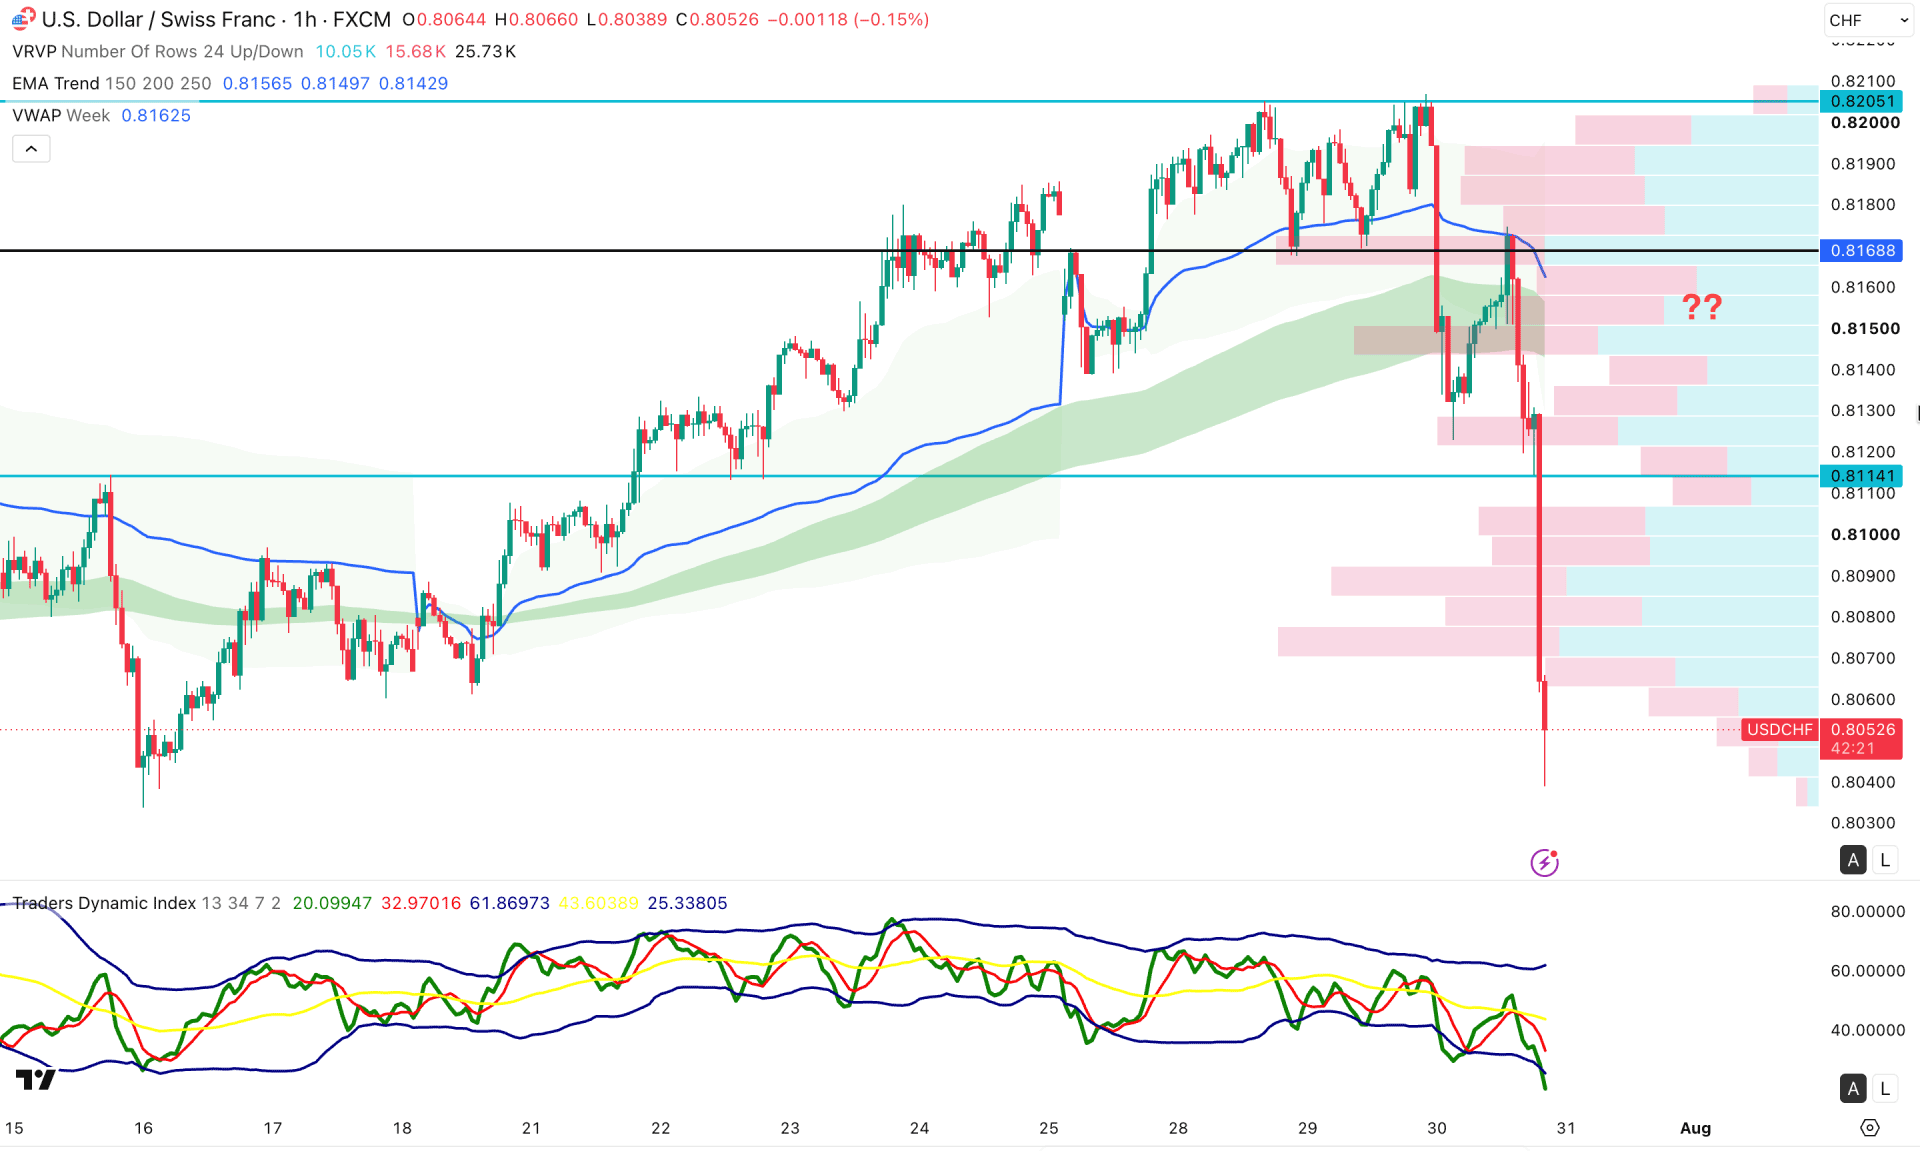
On the hourly timeframe, the current price is trading within a bearish trend, and massive selling pressure is seen from the recent high. The price moved lower with impulsive momentum and created multiple lower lows in the daily and hourly charts.
As it is, the price moved below the EMA wave, where the gap between the current price and the weekly VWAP level has expanded.
In the secondary indicator window, the Traders Dynamic Index has reached the lowest level in a month, signaling an extreme bearish condition in the market.
Based on this outlook, taking a short opportunity from the ongoing bearish market needs attention. However, the downside continuation is valid as long as the price remains below the 0.8114 resistance level. Although a minor bullish correction is possible as a reversion, the price is likely to extend lower and create a new low below the 0.8000 level.
The alternative approach is to look for counter-bullish momentum, which requires the price to stabilise above the 0.8168 level. This could invalidate the current bearish opportunity.
Based on the market structure, USDCHF shows selling pressure from the crucial premium zone, and there is still more room for the price to move toward the daily support area. Investors should closely monitor how the price forms a bullish correction in the intraday chart before following the bearish continuation opportunity.


