Published: December 27th, 2022
From the weekly opening, the USDCHF has to carry forward its topsy-turvy movement of Friday in a range of 0.9310-0.9330. The Swiss Franc holds critical support near 0.9300, despiting bullish sentiment in the FX universe. At the press time, the major sensed obstacles while attempting to cross the crucial resistance of 0.9330.
The risk profile seems strong as the S&P 500 index provided a decent delivery on Friday after the decline in the preferred inflation tool from the Fed. The United States PCE index remained upside down than expected at 5.5% but significantly downside than the previous 6.1%. A fall in consumer expenditure by households trimmed down further inflation expectations.
Meanwhile, the Dollar index trading choppily near 104.00, declaring volatility contraction signs. The USD index is anticipated to remain further sideways amid less activity due to the global market holiday mood. In early trade, U.S. treasury yields have declined marginally below 3.75%.
A follow-up decline in demand for U.S. durable goods has also infused expectations of further decline in the U.S. CPI data ahead. The economic data 2.1% contracted against the expected contraction of 0.6%. A durable goods demand decline will force manufacturers to shift prices downside to equilibrium maintenance, resulting in a further inflation decline.
In this situation, a USD bull is still pending, and investors' attention might shift to the US from the safe haven CHF.
Let’s see the complete price prediction from the USDCHF technical analysis:
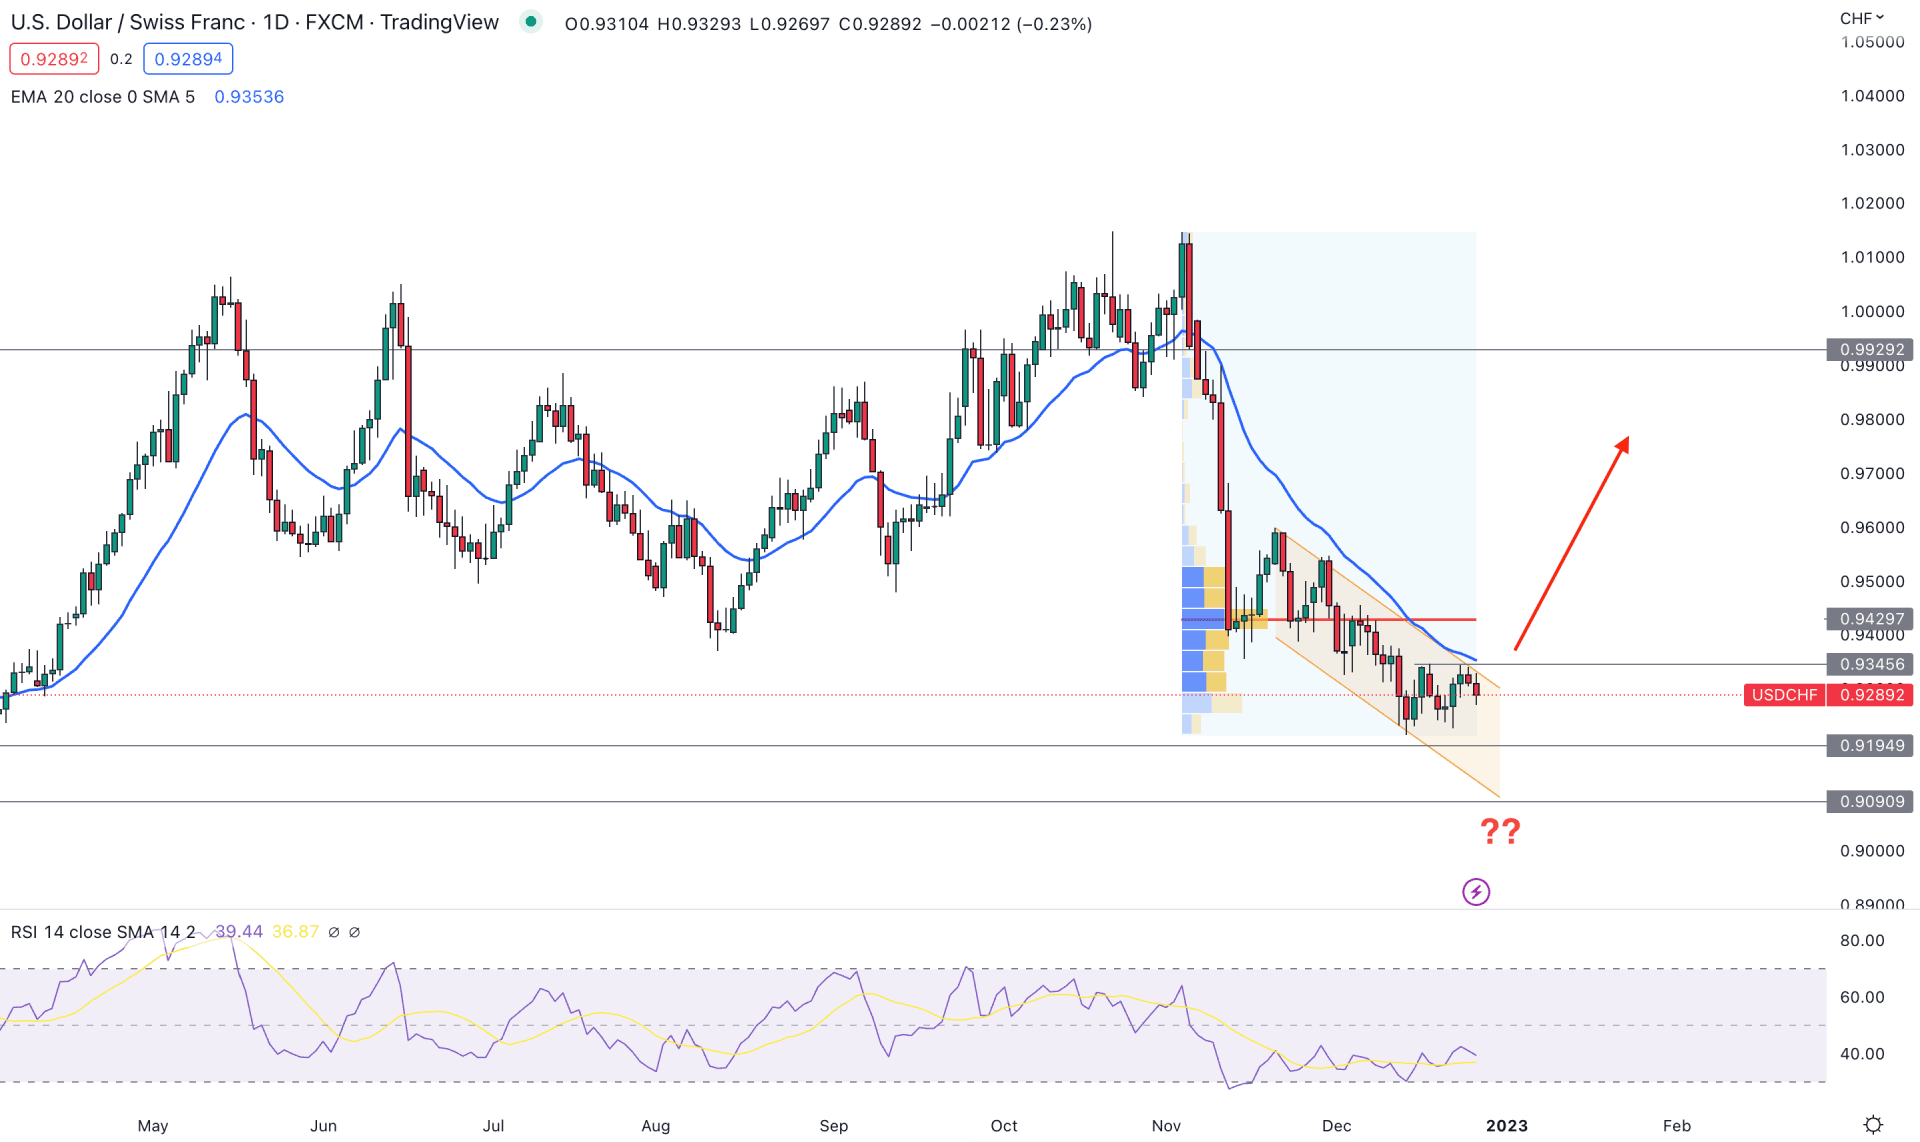
In the USDCHF daily chart, the current price action is clearly bearish where the recent selling pressure came from the 1.0147 swing high with a bearish engulfing candlestick formation. Since then the price keeps pushing down with an impulsive bearish pressure, which has become corrective in the recent trading days.
As per the current price behavior, the top of the tradable range is set at the 1.0147 level, which is the current limit for the upside target. However, on the downside, there is no bullish Quasimodo formed below the near-term support level, which indicates that there is no solid bottom.
The current price is extremely corrective within a descending channel, where the primary aim is to wait for a bullish channel breakout to open a long opportunity as a mean reversion. However, the dynamic 20 DMA is still above the price, which needs to recover before offering a conservative buying approach.
The high volume level from November 2022 high to December 2022 low is above the price, which is a strong level to break for bulls. Moreover, the Relative Strength Index (RSI) is still corrective below the 50% level, which is a sign of a bearish trend.
Based on the daily price outlook, a bullish recovery and daily candle above the dynamic 20 EMA would be the aggressive approach for buying this pair. However, a proper channel breakout and retest could offer a conservative opportunity for targeting the 0.9929 resistance level.
On the downside, any bearish rejection from 0.9345 could extend the current range, where the main aim is to test the 0.9090 key psychological level.
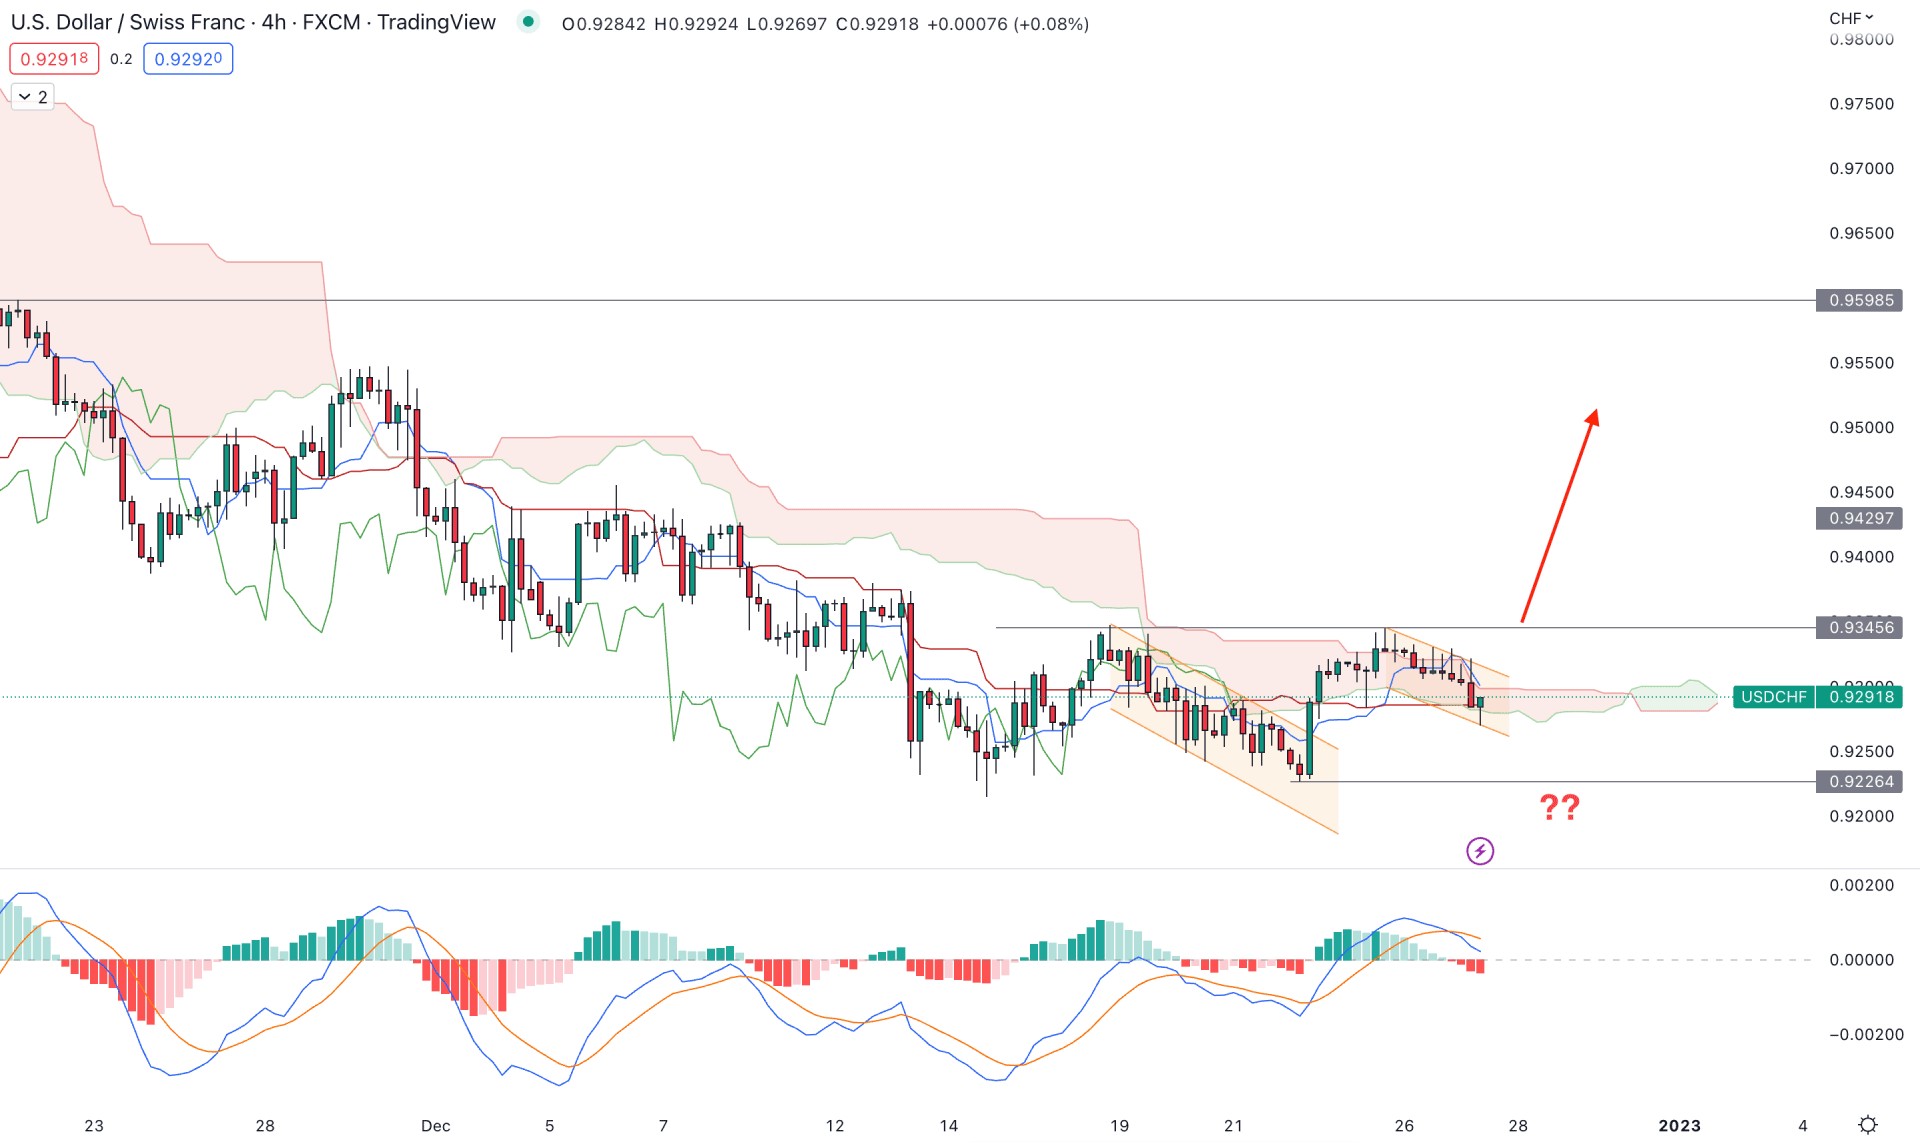
The bullish possibility has become potent in the H4 price of USDCHF, where the current bearish trend has become extremely corrective.
An attempt to move above the Cloud resistance was seen on 28 November 2022, from where the bearish trend was extended to the 0.9226 bottom. However, the selling pressure has become obsolete with a descending channel breakout with an H4 candle above the Kumo Cloud. Later on, the price has become corrective and another channel breakout could offer a decent buying opportunity in the pair.
In the future cloud, the Senkou Span A is above the B, signaling a buyers presence in the market, where the Tenkan Sen and Kijun Sen are closer together to the price.
Based on the H4 outlook, a bullish attempt and an H4 close above the channel resistance would validate the buying possibility, toward the 0.9598 resistance level. On the other hand, the bearish possibility is potent where a new H4 candle below the Cloud zone would resume the existing trend, towards the 0.9200 area.
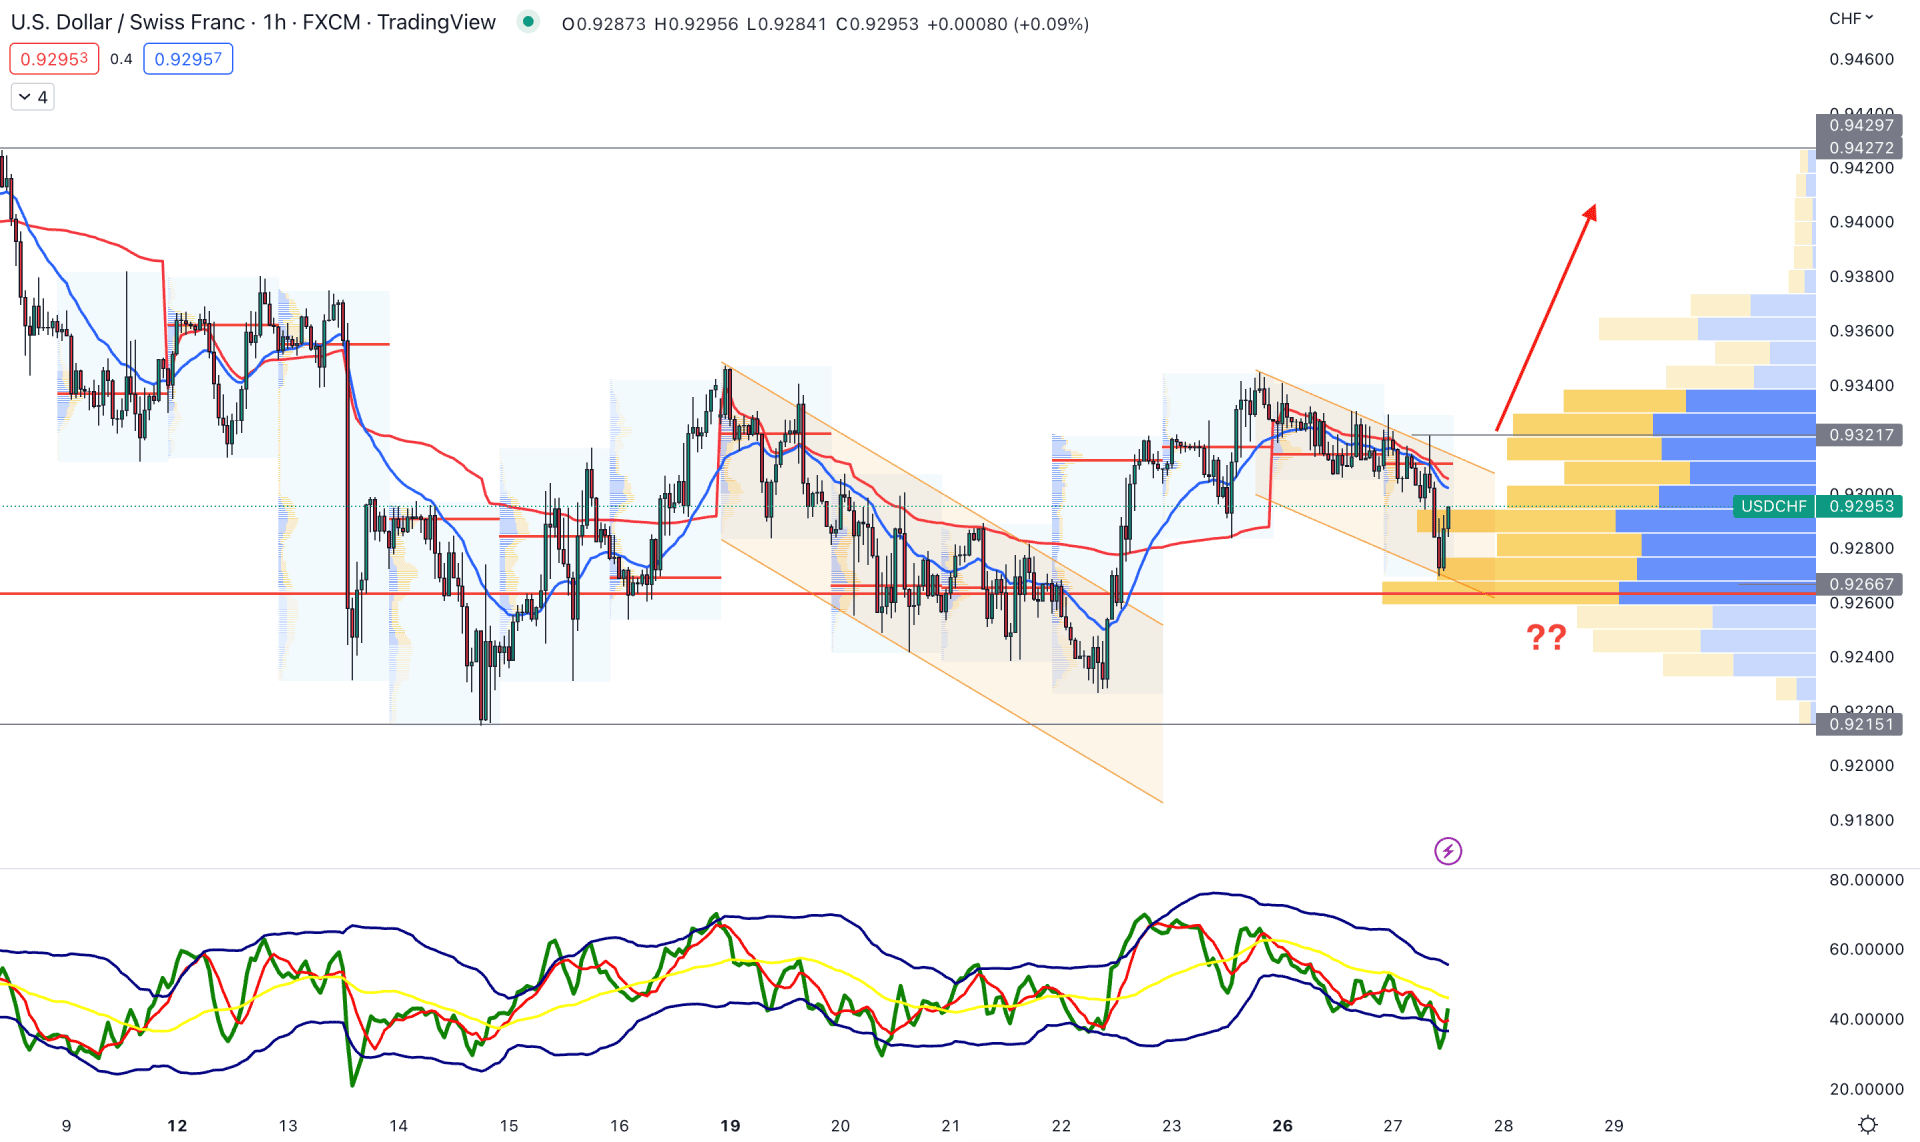
In the hourly time frame, the buying possibility is potent as the current price is trading above the visible range high volume level of 0.9266. Moreover, the formation of a descending channel above the high volume level is a sign that bulls are still interested in taking the price higher.
In the indicator window, the Traders Dynamic Index shifted its direction from the lower band but the dynamic 20 EMA is still above the price.
Based on this structure, a bullish channel breakout and an H1 candle above the weekly VWAP could offer a long opportunity, where the main aim is to reach the 0.9427 resistance level. However, the buying possibility is potent as long as it trades above the 0.9266 level. A bearish break below the 0.9215 level with an H1 candle could extend the loss toward the 0.9100 area.
Based on the current multi-timeframe analysis, the broader outlook of the USDCHF is bearish where a bullish breakout is needed to form a high probable buying opportunity from the bottom. In that case, investors should closely monitor the intraday price action where a bullish H4 candle above the Kijun Sen support would be a best opportunity to join the bullish market.


