
Published: June 29th, 2023
During Thursday's Asian session, the USD/CHF pair attracted investors for the second consecutive day, approaching the psychological level of 0.9000.
The U.S. Dollar (USD) maintained its upward momentum from the day before, reaching a new high not seen since June 15. This increase was prompted by the hawkish remarks made by Federal Reserve (Fed) Chair Jerome Powell at a European Central Bank (ECB) conference.
Powell reaffirmed the likelihood of two rate hikes in 2019 and stated that inflation would not achieve the Fed's 2% target until 2025. These statements strengthened market expectations of a 25 basis point increase at the forthcoming FOMC policy meeting on July 25-26, bolstering the US Dollar and the USD/CHF pair.
In addition, the positive sentiment on equity markets has diminished the allure of the Swiss Franc (CHF) as a safe-haven currency, thereby bolstering the USD/CHF pair. Concerns about a potential global economic downturn and allegations that the United States plans to impose additional restrictions on semiconductor exports to China have dampened optimism.
In addition, investors are exercising caution ahead of the publication of official Chinese PMI data on Friday, which is anticipated to shed light on the slowing post-COVID recovery in the second-largest economy in the world. These factors have restrained bullish activity around the USD/CHF pair, prohibiting the establishment of new positions.
Let's see the upcoming price direction from the USDCHF technical analysis:
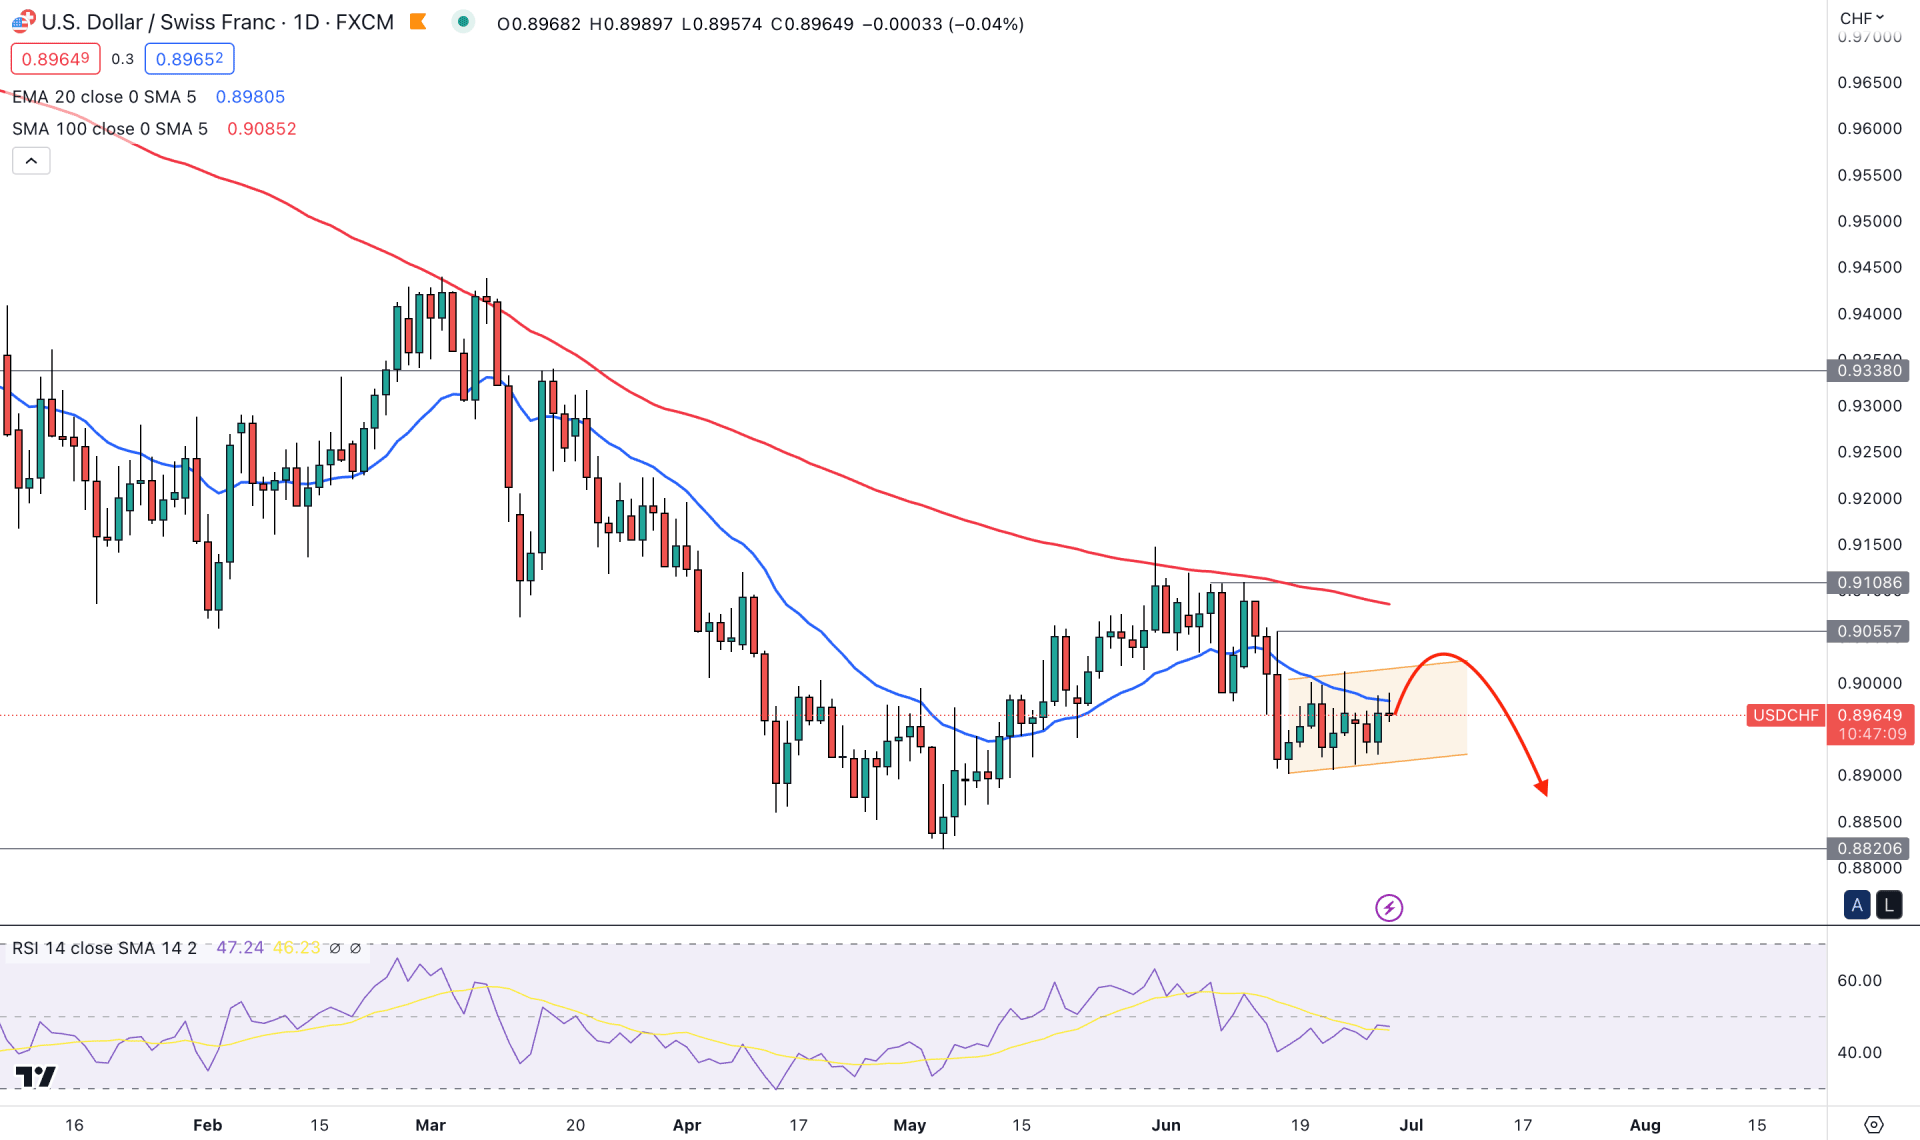
The current daily price of USDCHF shows a strong bearish trend, whereas a simple trend trading strategy could provide a huge gain until bulls appear.
The monthly candle is clearly bearish, and if bears hold the momentum until this Friday, we may expect a drop base drop formation in the USDCHF price. However, the weekly candlestick is still indecisive, backed by a bullish week, which may need a breakout before opening a short trade.
In the daily chart, the current price is trading within an ascending channel, where the dynamic 20-day Exponential Moving Average is the immediate resistance. Moreover, the 100-day Simple Moving Average is above the 0.9055 static resistance level, which signals a broader bearish trend for the instrument.
In the secondary window, the 14-period RSI shows a sell signal as it remains below the 50.00 neutral line. As per the current reading, the RSI is at 46.00 level, within an ascending channel formation.
Based on the current price outlook, the broader market outlook is bearish, and a daily candle below the ascending channel support could offer a strong selling opportunity, targeting the 0.8820 support level.
The selling pressure is backed by two critical resistances- 0.9055 and 0.9108. As long as bears hold the price below these levels the downside possibility could be intact. However, an immediate bullish recovery could make the entire price action from these resistances as obsolete, indicating a bullish signal. A strong D1 candle above the 0.9108 level could be the first sign of the buying pressure, where the main aim is to test the 0.9338 resistance level.
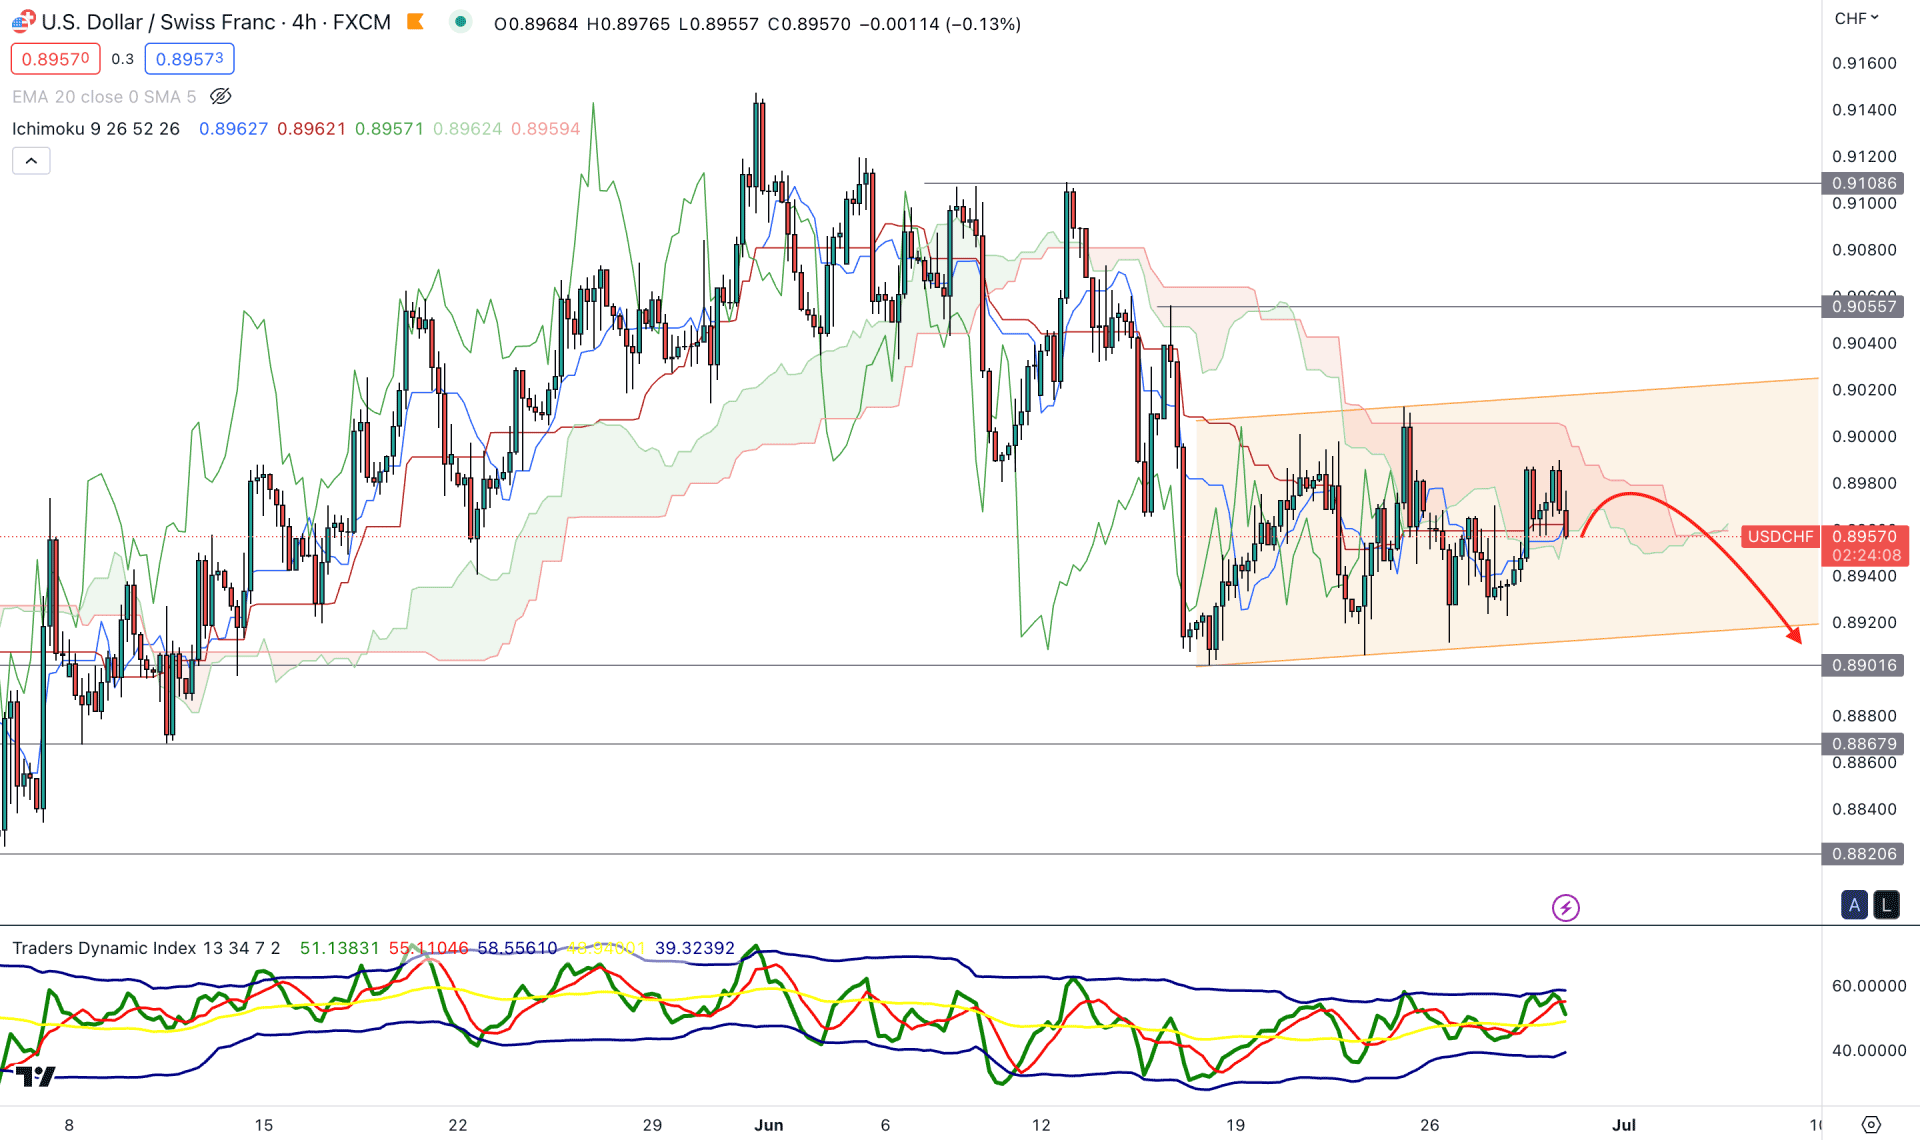
In the H4 timeframe, the bearish possibility is potent as the recent price showed a selling pressure from the Ichimoku Cloud resistance zone. Moreover, the existing bearish trend is backed by several swing high formations at 0.9055 and 0.9108 levels, which is a sign of a long-term trader's presence in the market.
In the indicator window, the current TDI indicator shows a possibility of a bearish recovery as a bearish reversal is present at the upper TDI limit.
Based on the current market outlook, a strong bearish H4 candle below the dynamic KIjun Sen support could increase the possibility of a channel breakout, where the main aim is to test the 0.8820 support level.
On the bullish side, a strong bullish recovery with a stable price above the 0.9100 level is needed before forming a bullish trend reversal. In that case, a long opportunity is open, where the ultimate target is to test the 0.9300 area.
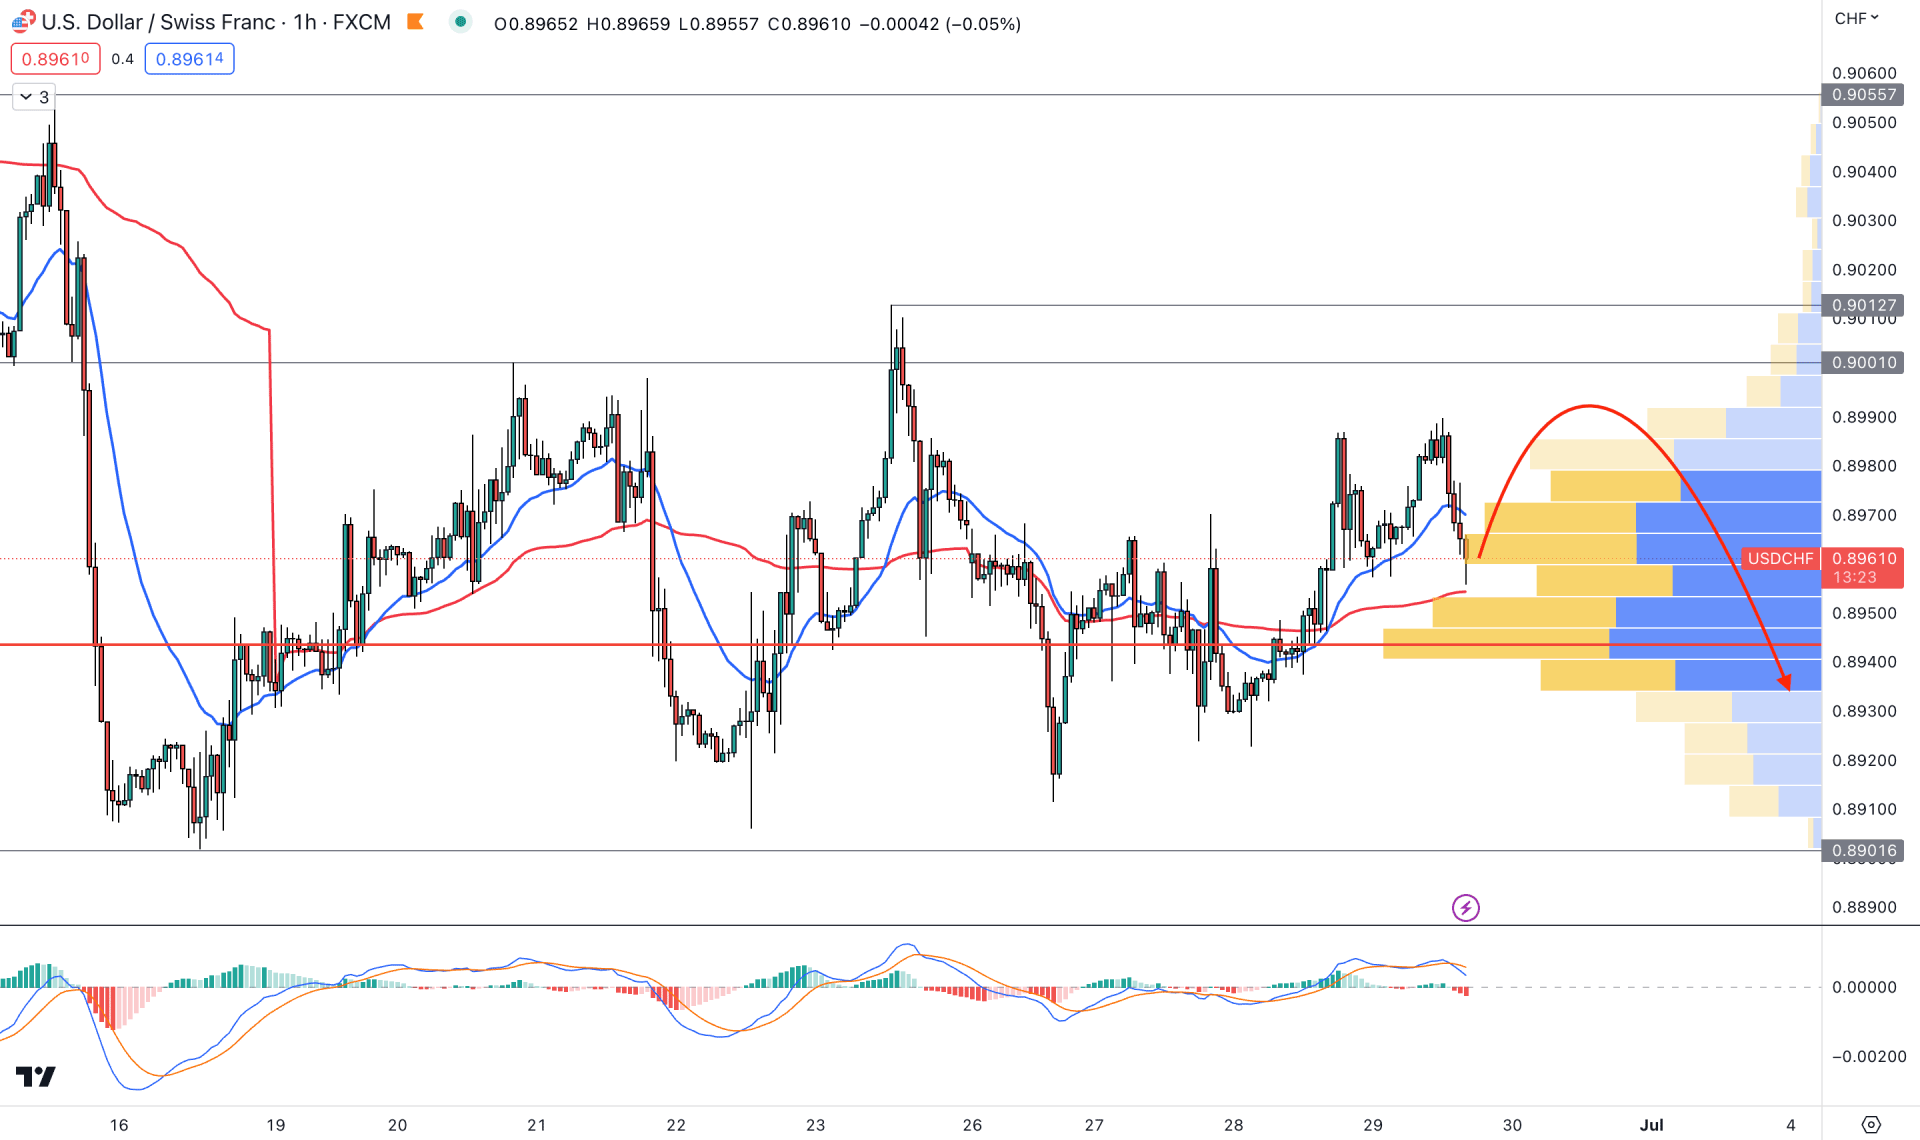
In the H1 chart of USDCHF, the current market outlook is extremely corrective, where a strong breakout is needed before aiming for a stable trend.
In the main chart window, the currently visible range high volume level is below the current price, while the dynamic 20 EMA is acting as a support level.
The MACD Histogram shows a bearish possibility from the divergence formation, while the current Histogram is in the sellers zone.
Based on the hourly price structure, a strong bearish breakout with an H1 candle below the 0.8922 support level is needed before anticipating a strong bearish impulsive pressure.
As the current price holds the bullish bias above the visible range high volume support level, a further upward pressure with an hourly candle above the 0.9012 level could increase the price towards the 0.9100 area.
Based on the current market structure, USDCHF is more likely to extend the downward pressure until a massive bullish counter-impulsive pressure exists. As of now, an early selling opportunity is available if there is a strong channel breakout in the intraday chart.


