
Published: November 24th, 2021
The rising inflation in the US increased the possibility of raising interest rates by the Fed. Therefore, investors have seen the US Dollar become stronger against the basket of currencies except for the loonie.
The hawkish tone from the Bank of Canada put some wind on the Canadian Dollar’s wings, although there was a modest pullback on the Crude Oil price. Still, analysts believe that the USD/CAD price could move lower towards the 1.2000 level in the coming days.
The possibility of the rate hike after the COVID-19 pandemic clamped down supply and potential growth. Currently, the central bank believes that Q2 or Q3, or 2022 would be the perfect time to raise the interest rate. As a result, the series of rate hikes would return the interest rate from 0.25% to 1.75% within 2023.
Let’s see the upcoming price direction from the USD/CAD technical analysis:
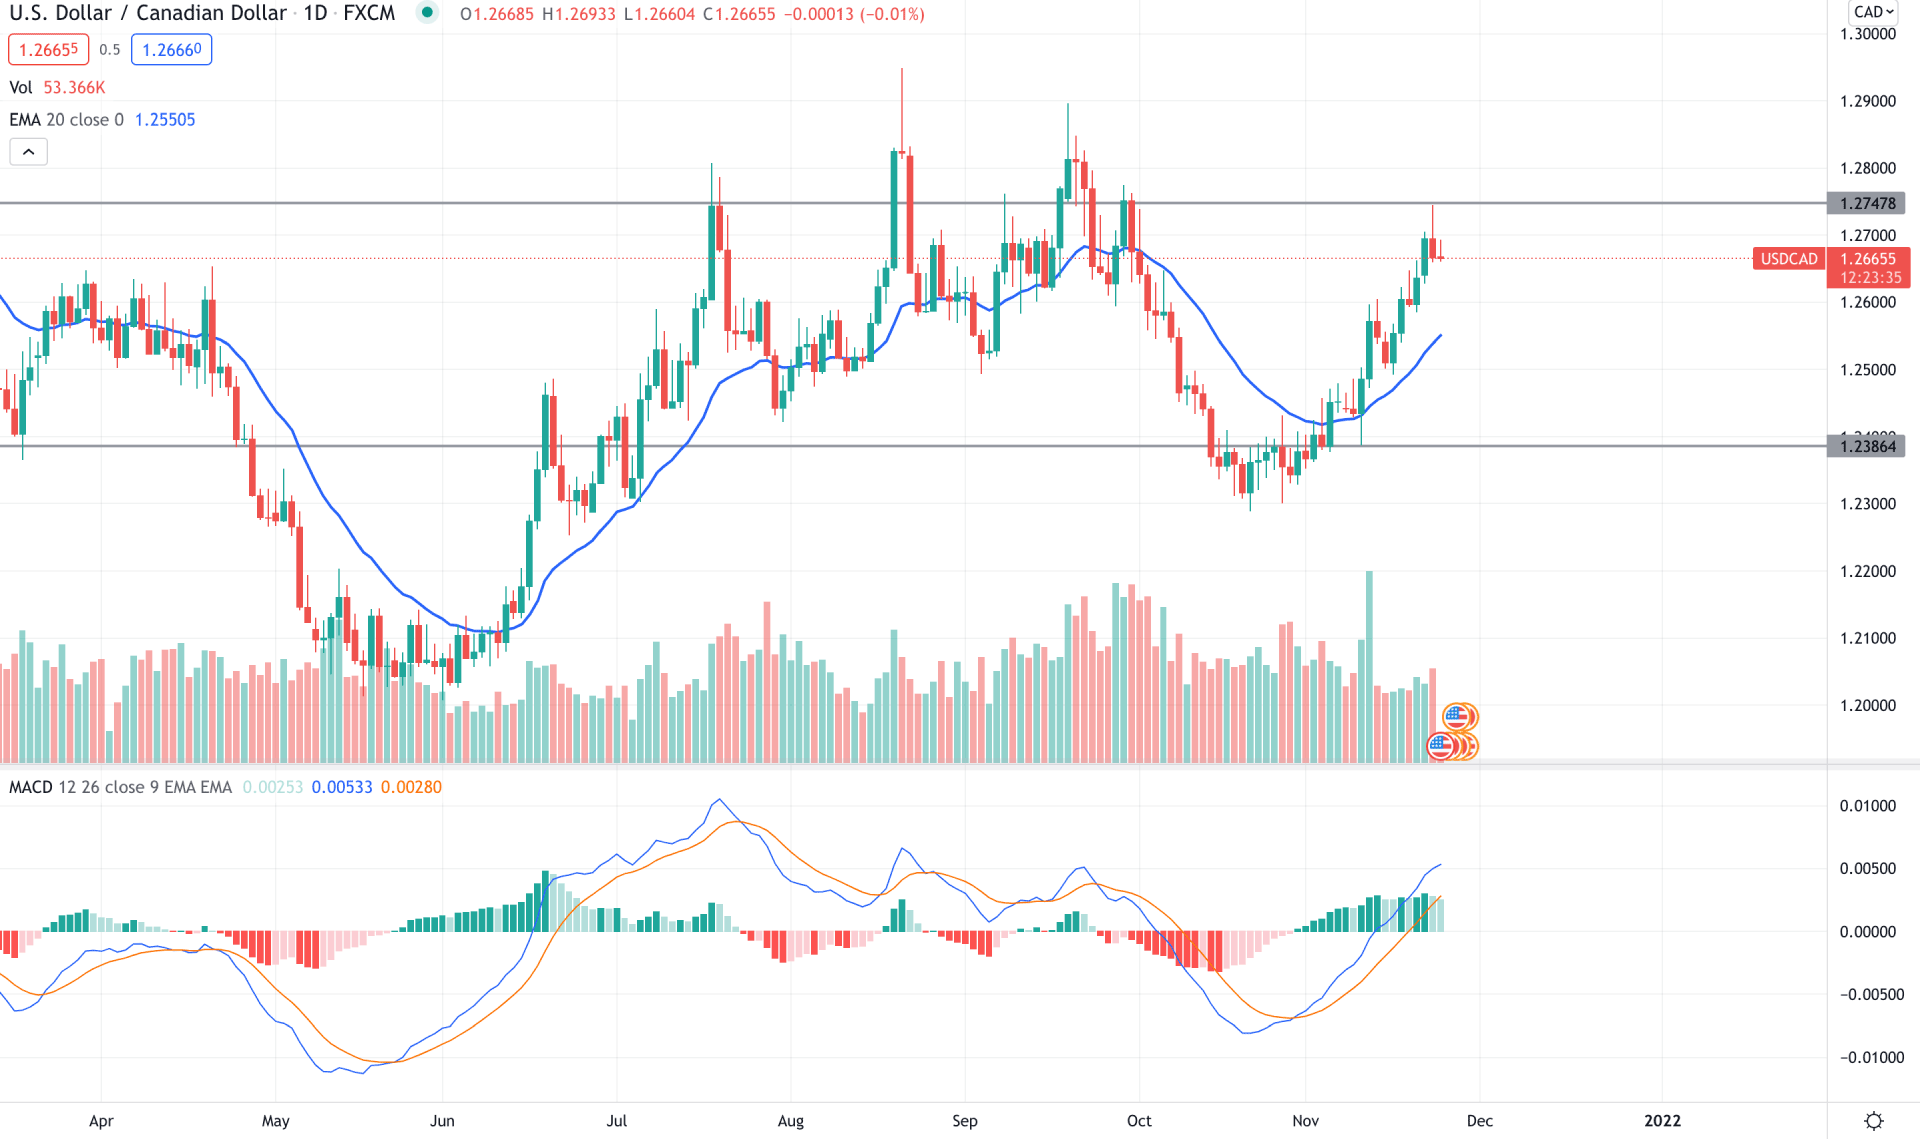
USD/CAD remained volatile throughout the year, where the price tried to become stable above the 1.2747 level in the second half of 2021 but failed. Moreover, the recent surge in the Crude Oil price pushed the price lower from the 1.2747 supply level and reached a 1.2300 swing low.
Later on, from the beginning of November, the price became volatile and moved above the dynamic level with an impulsive bullish pressure where the current supply level at 1.2747 has become important. As per the current price action, any selling pressure from 1.2747 to 1.2800 would be a potential selling opportunity in this pair.
The above image shows how the price reached the 1.2747 key resistance level where the gap with the dynamic 20 EMA is extended. As a result, the flat bullish MACD Histogram with the mean reversion possibility increased the bearish possibility in the USD/CAD price.
Based on the daily context, the bearish possibility is valid as long as the price trades below the 1.2800 level, where the primary bearish target would be 1.2500 level. On the other hand, a bullish break above the 1.2800 with a bullish daily candle may alter the current market structure and take the price towards the 1.2900 area.
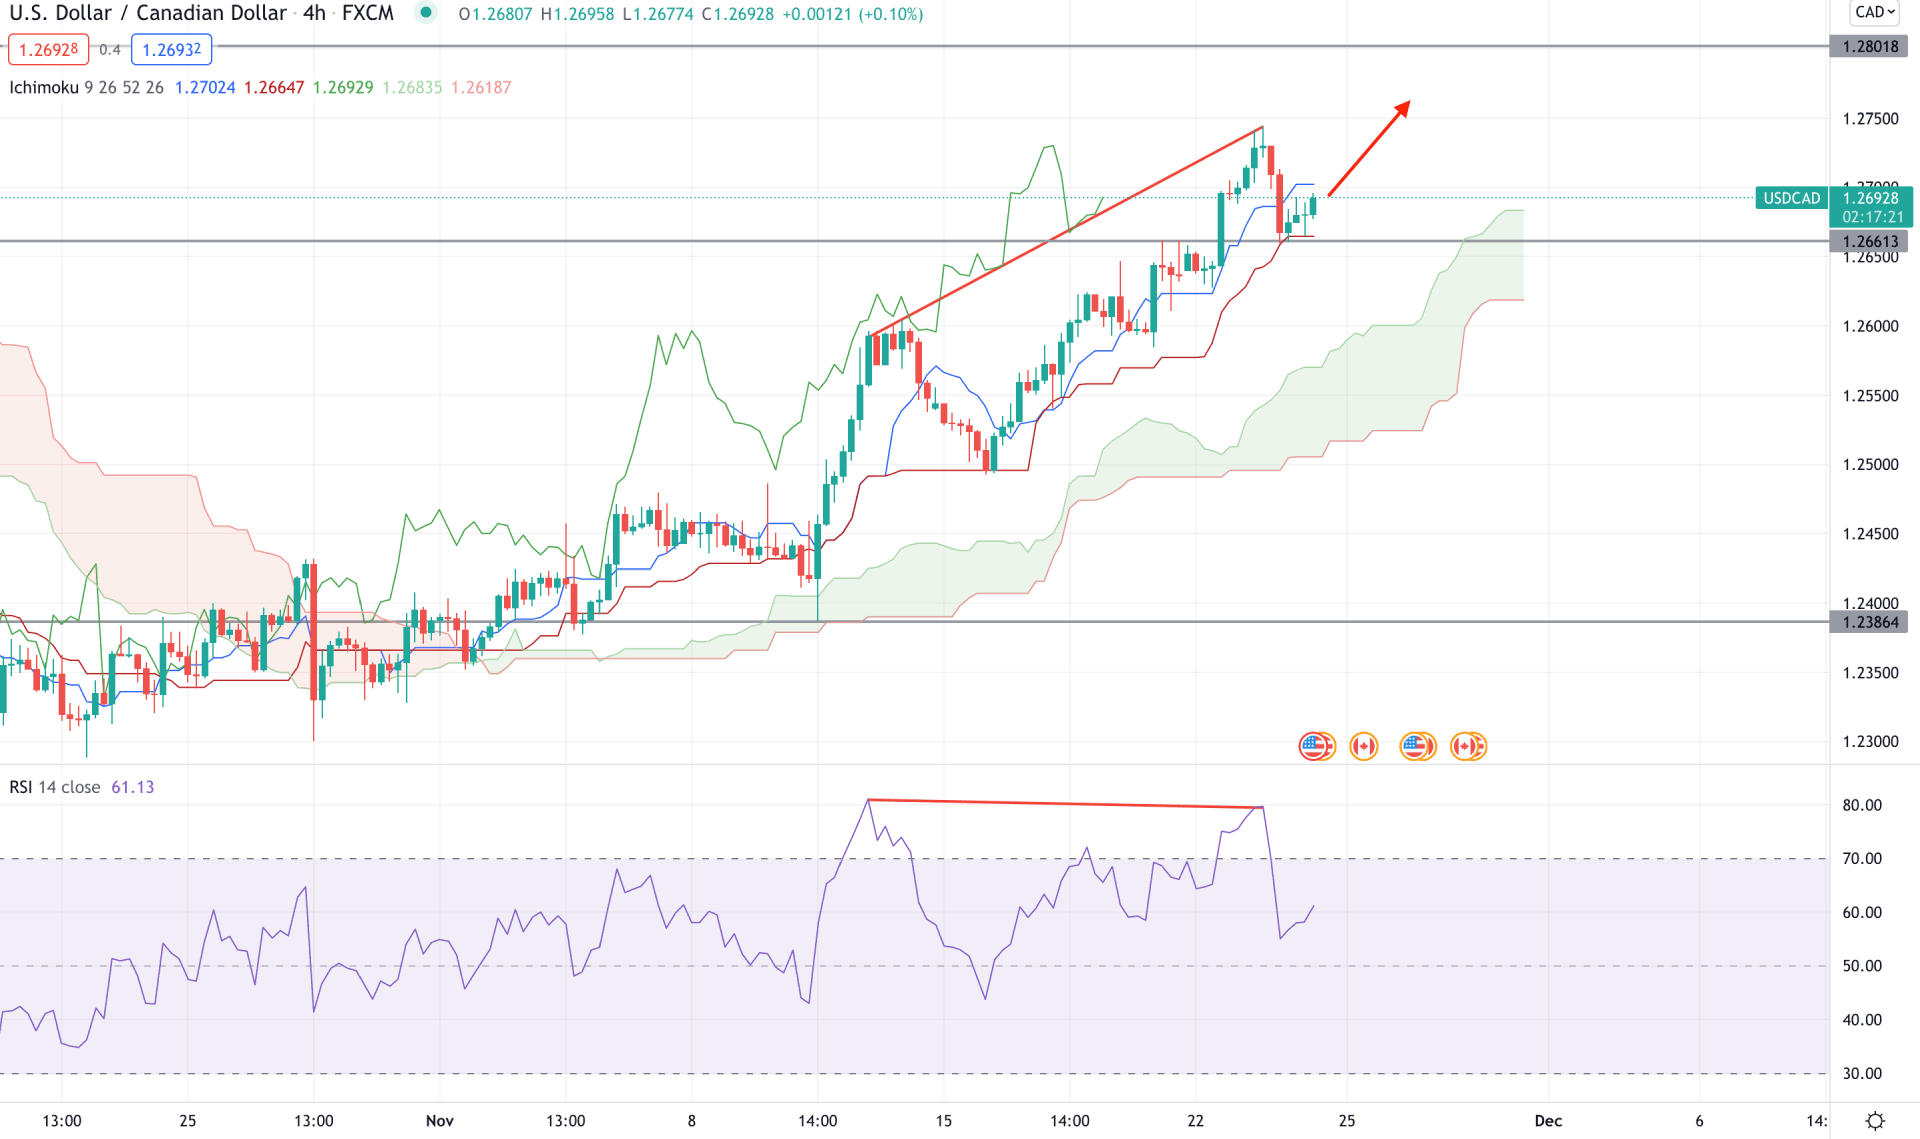
In the H4 timeframe, USD/CAD is trading within an extreme bullish pressure as the current price is above the Kumo Cloud, where the Future Cloud is bullish. Senkou Span A is above Senkou Span B in the future cloud where the Lagging Span aims higher. Moreover, the price is trading above the intraday event level of 1.2660, from the dynamic Kijun Sen provides support.
The above image shows how the regular divergence formed with the price and RSI where the current RSI level moved below the overbought 70 levels with strong selling pressure. Meanwhile, the Dynamic Tenkan Sen is above the Kijun Sen and supports the price. Therefore, based on the H4 context, any bullish H4 close above the dynamic Tenkan Sen would increase the buying pressure towards the 1.2800 area. On the other hand, bears should find the price below the 1.2660 level with a strong bearish H4 candle to consider the upcoming price direction as bearish towards the 1.2500 area.
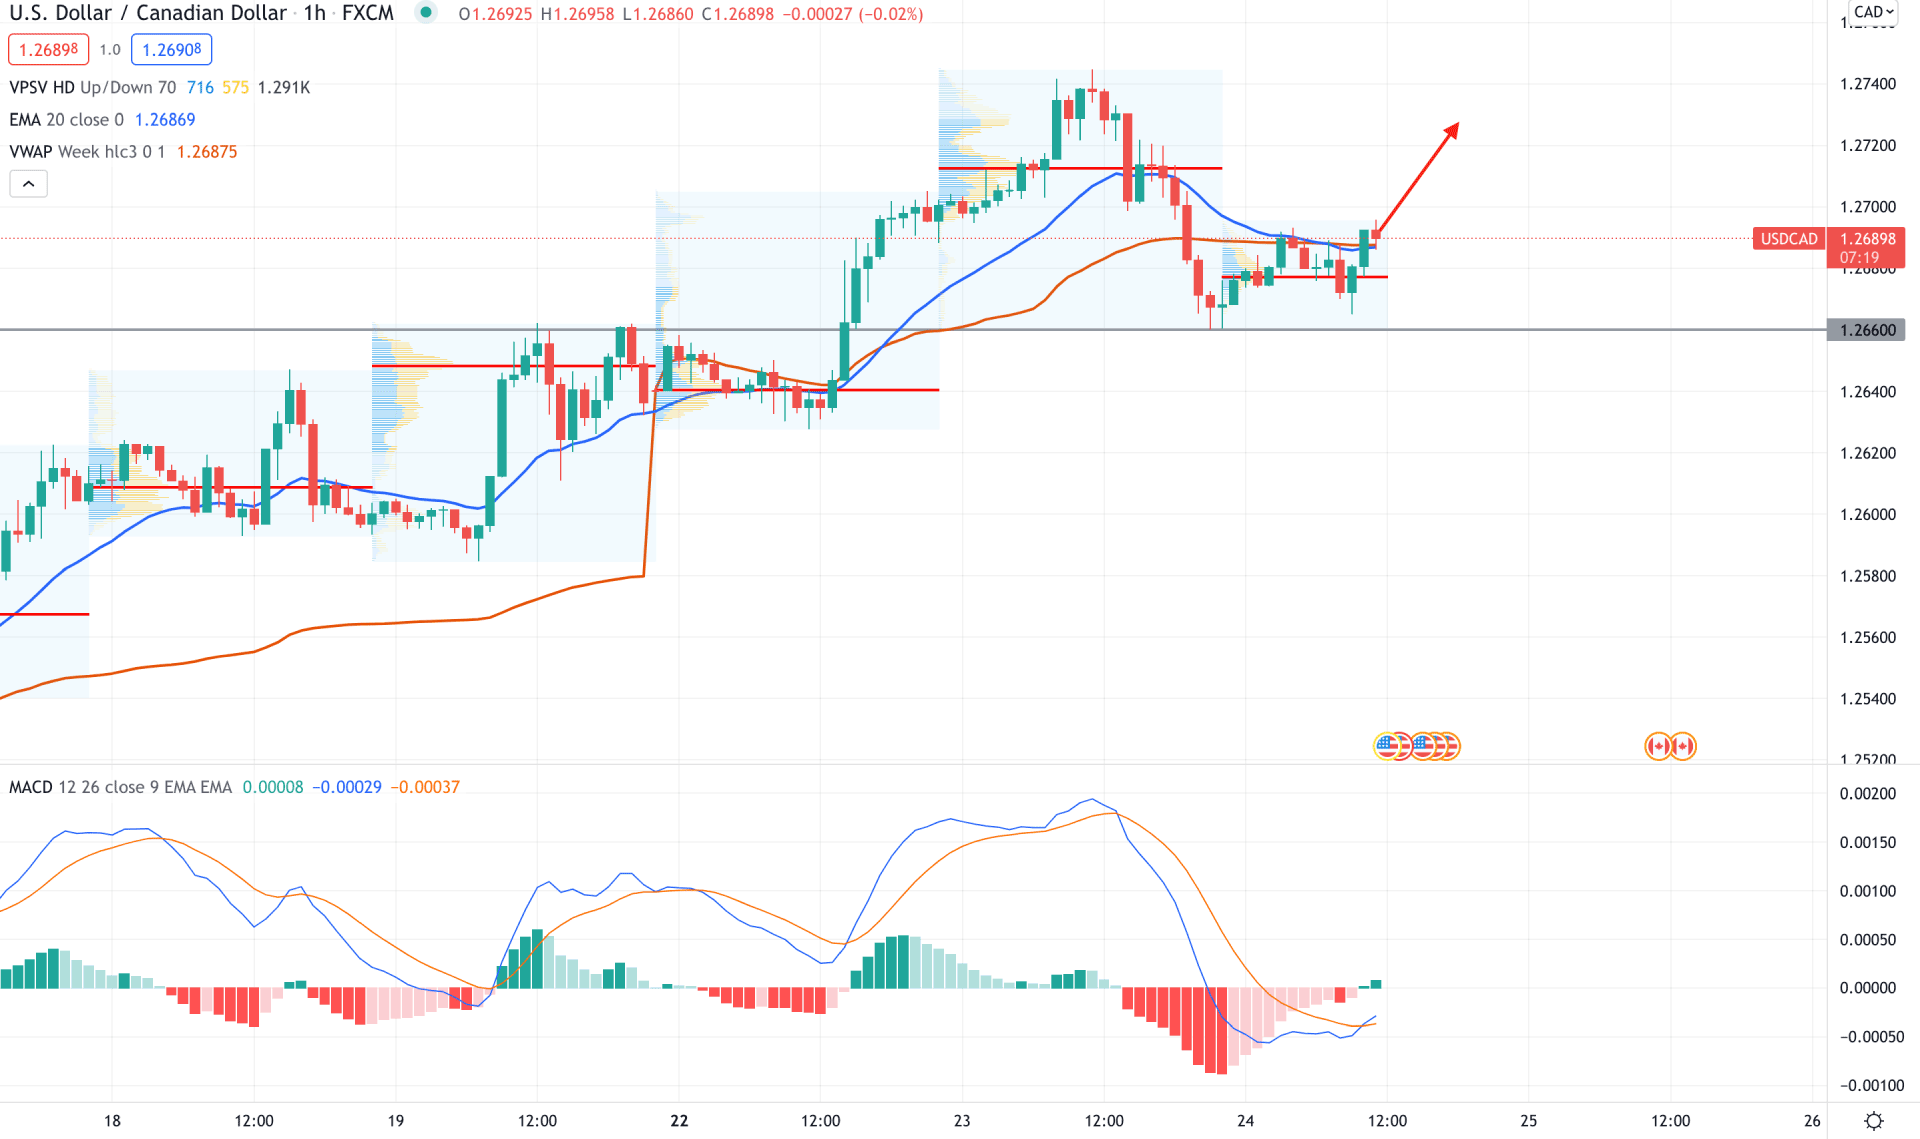
In the intraday chart, USD/CAD bulls are aggressive as they push the price above the 1.2660 intraday support level. Moreover, the most recent price moved above the intraday high volume level of 1.2676, with a bullish H1 close above the dynamic 20 EMA.
TheMACD Histogram showed PNP formation in the indicator window where the current Histogram is bullish and aiming higher. Meanwhile, the dynamic weekly VWAP is below the current bullish H1 candle, where a new swing high above the 1.2700 would increase the buying possibility.
Based on the H1 context, the bullish possibility is intact as the price is above the 1.2660 level. In that case, the ultimate bullish target would be at 1.2800 area. On the other hand, a break below the 1.2660 level may lower the price towards the 1.2500 area.
As per the current market condition, USD/CAD may move lower, followed by the fundamental outlook and technical price structure. In that case, a stable bearish price action below 1.2660 would increase the selling pressure in the coming days. However, the bearish possibility towards the 1.2386 level is valid as long as the price trades below the 1.2800 level.


