
Published: March 5th, 2026
After reaching a new three-month peak of 99.67, the USD Index started to decline after reporting that Iran was open to discussing a settlement with the US. Tehran, however, refuted the accusations and promised a protracted conflict, which seems to have rekindled interest in safe-haven assets.
The US dollar has been bolstered by positive US ADP employment numbers and unexpectedly high ISM Service PMI data for February, in addition to renewing risk-off bets.
According to the ADP, the United States private sector added 63K new jobs in February, a substantial increase over the previous data of 11K and projections of 50K. According to the ISM report, the Services PMI was predicted to be down at 53.5 after 53.8 in January, but it ended up higher at 56.1.
On the other hand, the Canadian dollar performs even against the US dollar; yet, in the face of rising oil prices, the former trades strongly against other currencies. Higher oil prices are good for the Canadian dollar because Canada is the country that exports the most oil to the United States.
Let's see the further outlook from the USDCAD price analysis:
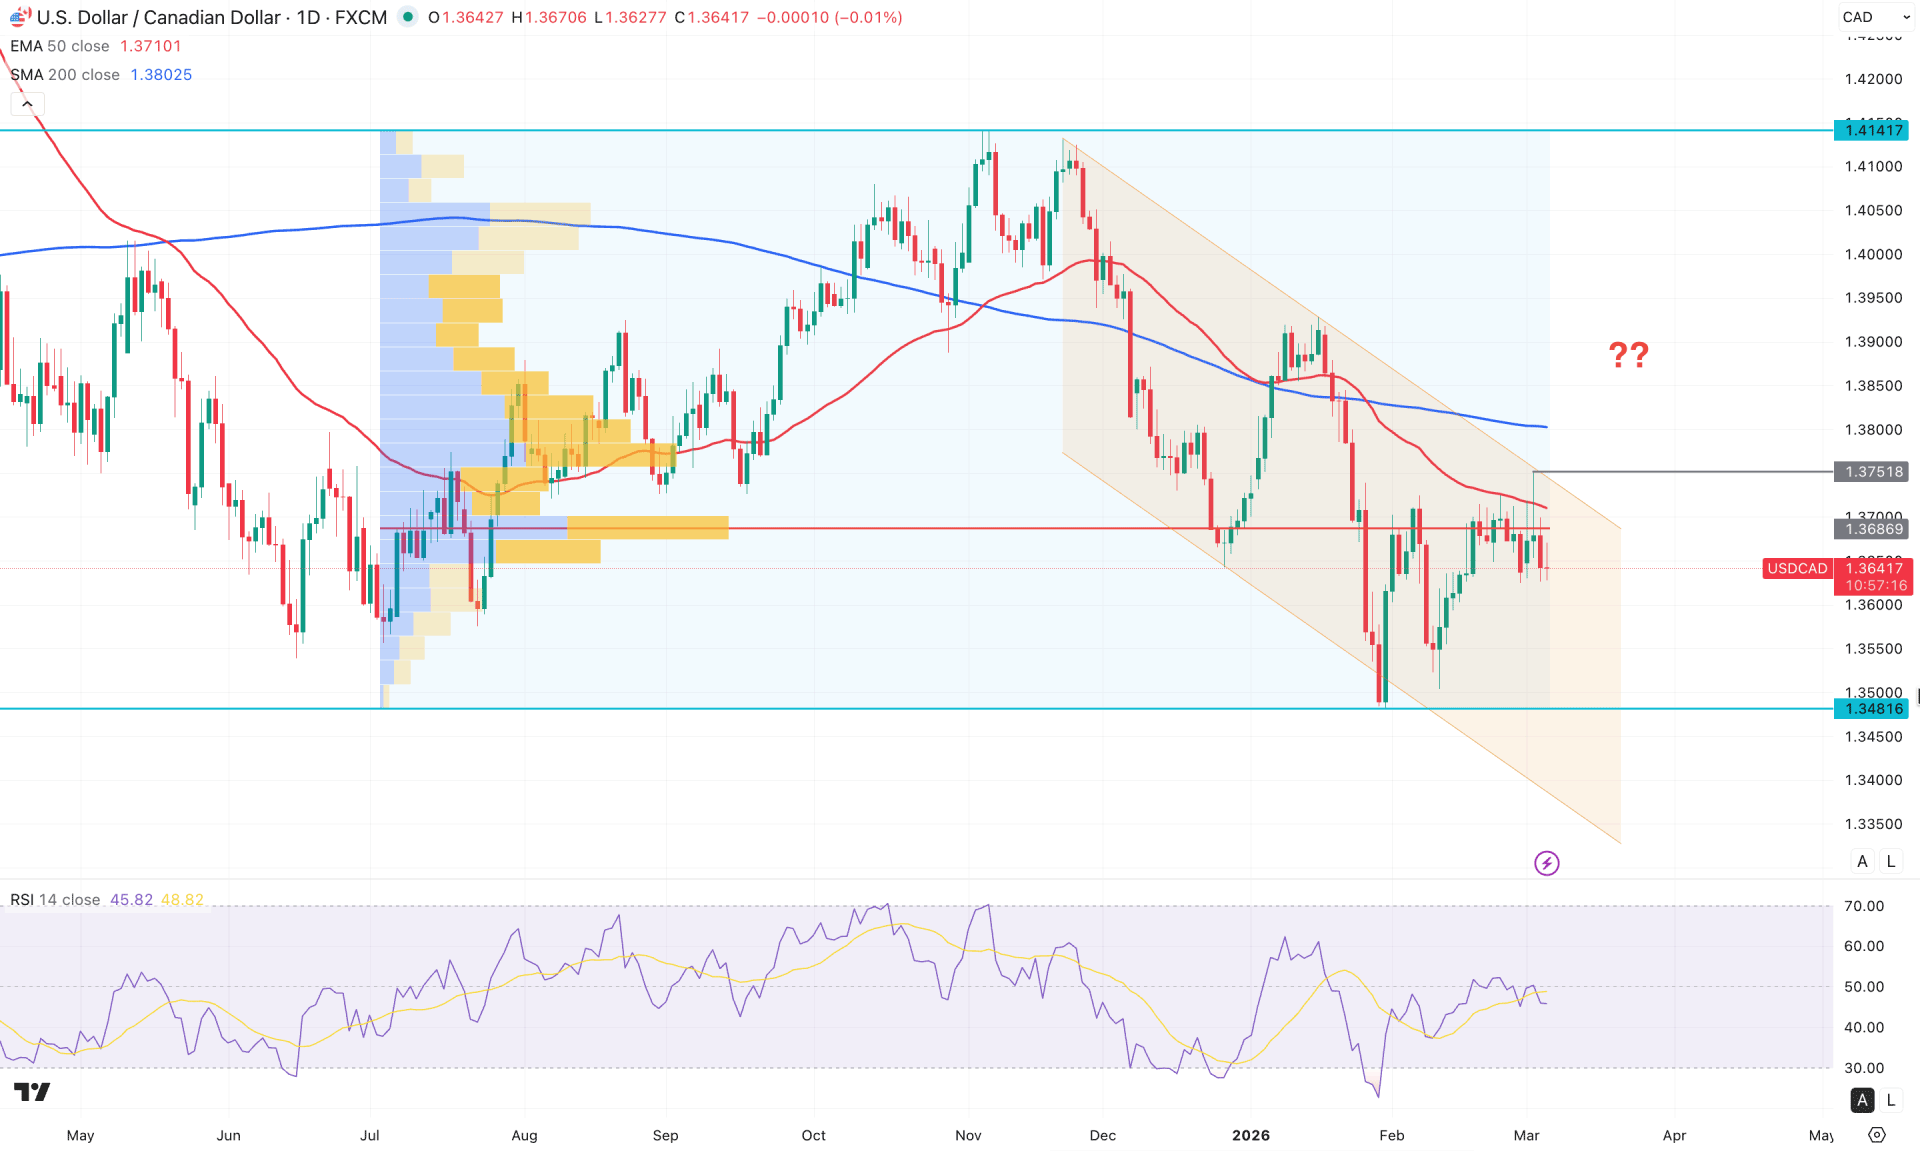
In the daily chart of USDCAD, corrective bearish momentum is visible, as the price is currently trading sideways within a drop–base–drop formation. With multiple resistance levels positioned above the current price, the primary expectation is continued bearish pressure before any long opportunity becomes viable.
On the higher timeframe, the price action remains highly sideways, while the pump-and-dump move from July 2025 is still influencing the structure. The price completed the 50% Fibonacci Retracement of the 2025 swing and has since moved sideways after forming a bottom at the 1.3481 level. As the current price consolidates following a monthly bearish inside bar formation, further downside continuation may occur after testing the existing monthly low.
In terms of volume, the price is trading within a crucial order-building zone, where multiple rejections have occurred at higher levels, followed by consolidation. The most active level since July 2025 is 1.3686, which is positioned just above the current price.
The 200-day SMA has a downward slope, signaling a major bearish trend. The 50-day EMA is also sloping downward and has formed a bearish crossover with the 200-day SMA. Since both dynamic averages remain above the current price, further downside continuation is likely.
In the indicator window, the Relative Strength Index (RSI) reflects the same structure, showing corrective momentum around the 50.00 neutral level.
Based on the daily outlook, USDCAD is trading within a descending channel, and a channel extension remains highly probable. The price may initially move lower to test the 1.3482 support level before presenting any long opportunity. Within this structure, the 1.3751 level could act as a crucial resistance zone, aligned with the channel boundary.
However, if the price breaks above 1.3750 with a strong bullish daily close, a fresh bullish trend could emerge, targeting the 1.4000 psychological level.
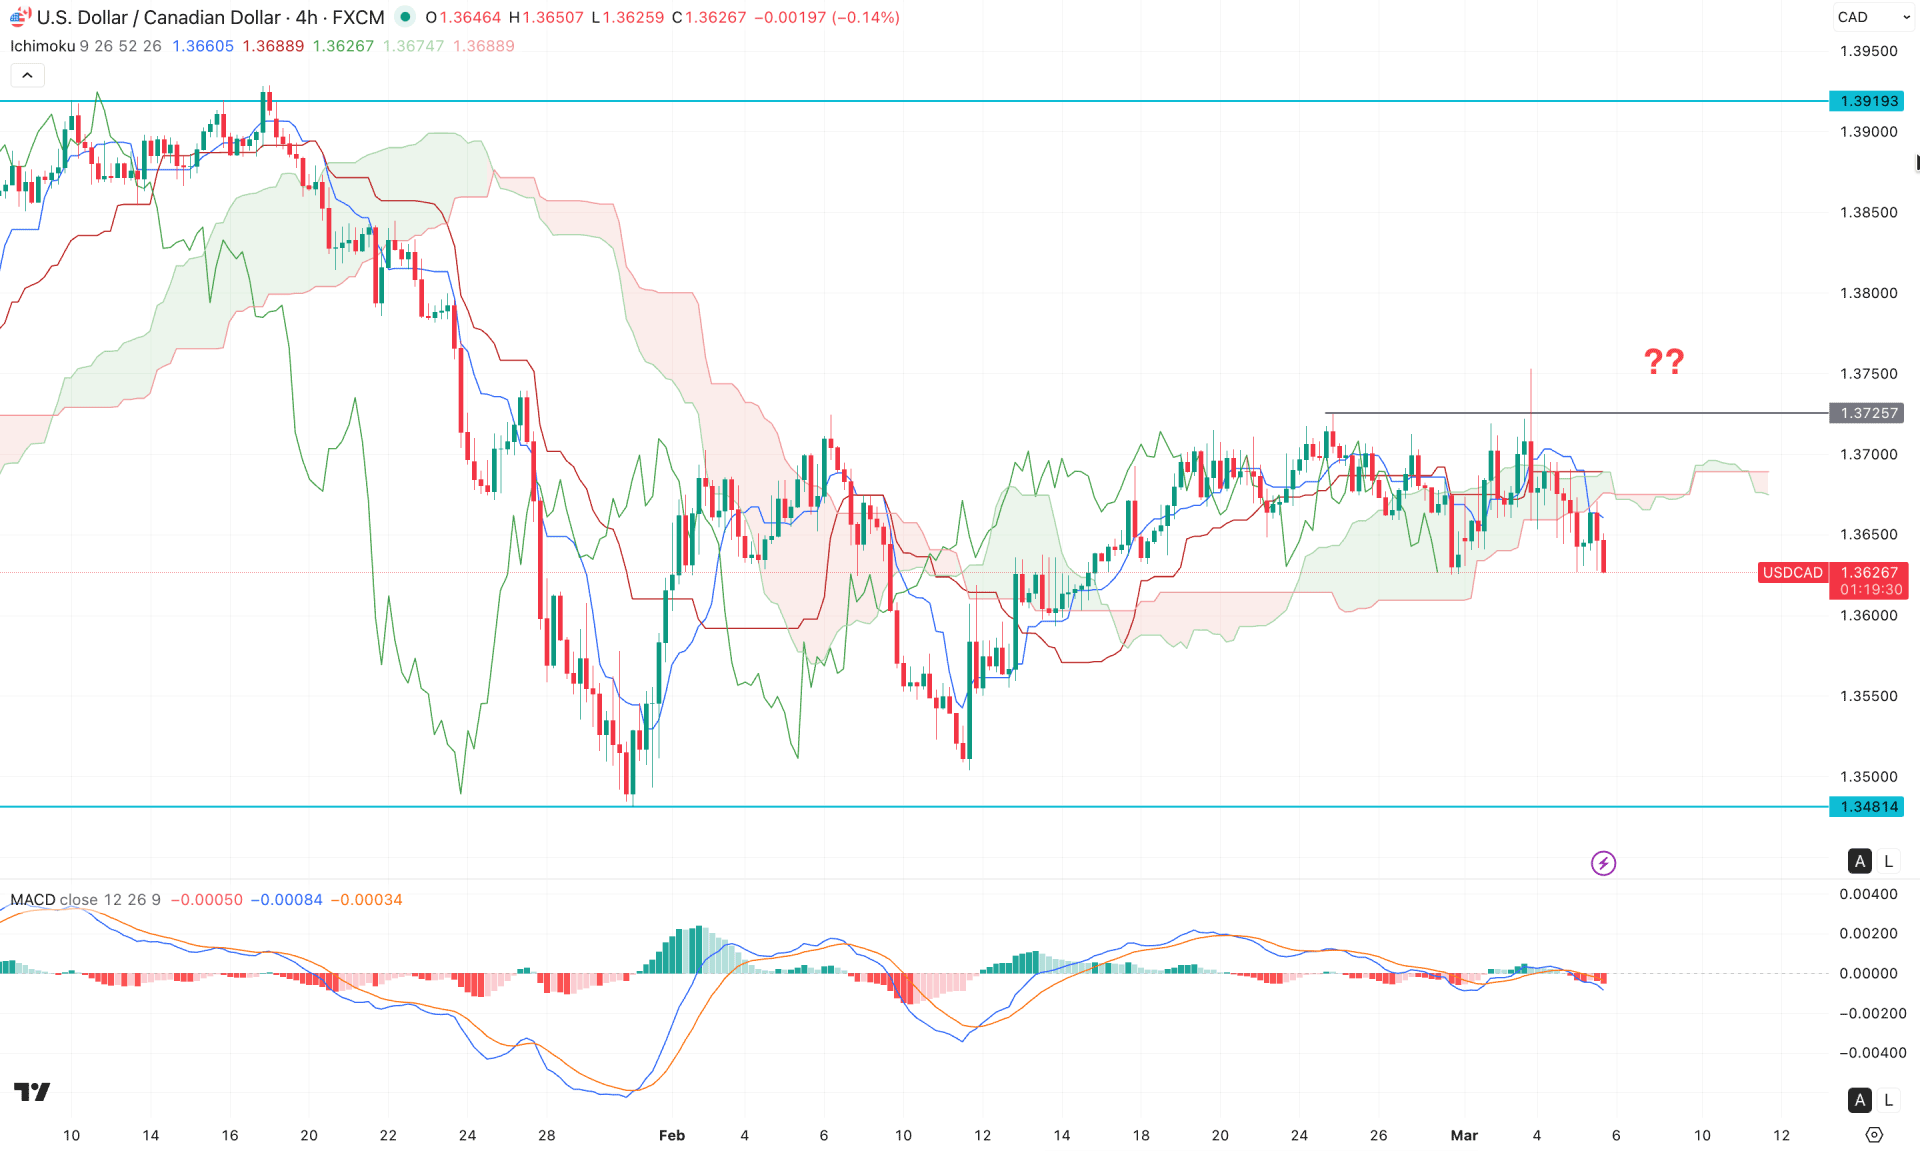
On the H4 timeframe, the price remains in consolidation, with multiple violations around the Ichimoku Cloud zone. Moreover, Senkou Span A has started to move downward below the flat Senkou Span B. This signals intraday selling pressure, while the medium-term market trend remains sideways.
In the indicator window, the MACD histogram is moving sideways, remaining close to the neutral line for an extended period. This indicates a corrective market structure, from which a clear breakout is required before confirming a new impulsive trend.
Based on the H4 outlook, the recent buy-side liquidity sweep above the 1.3725 level, followed by a bearish H4 candle closing below the cloud, signals a potential short opportunity. On the bearish side, immediate support is located at the 1.3481 level, which could serve as the primary downside target.
On the other hand, failure to sustain the price below the cloud may indicate renewed buying pressure. In that case, a bullish recovery above the 1.3725 level, supported by consolidation, could open the path toward the 1.3900 area.
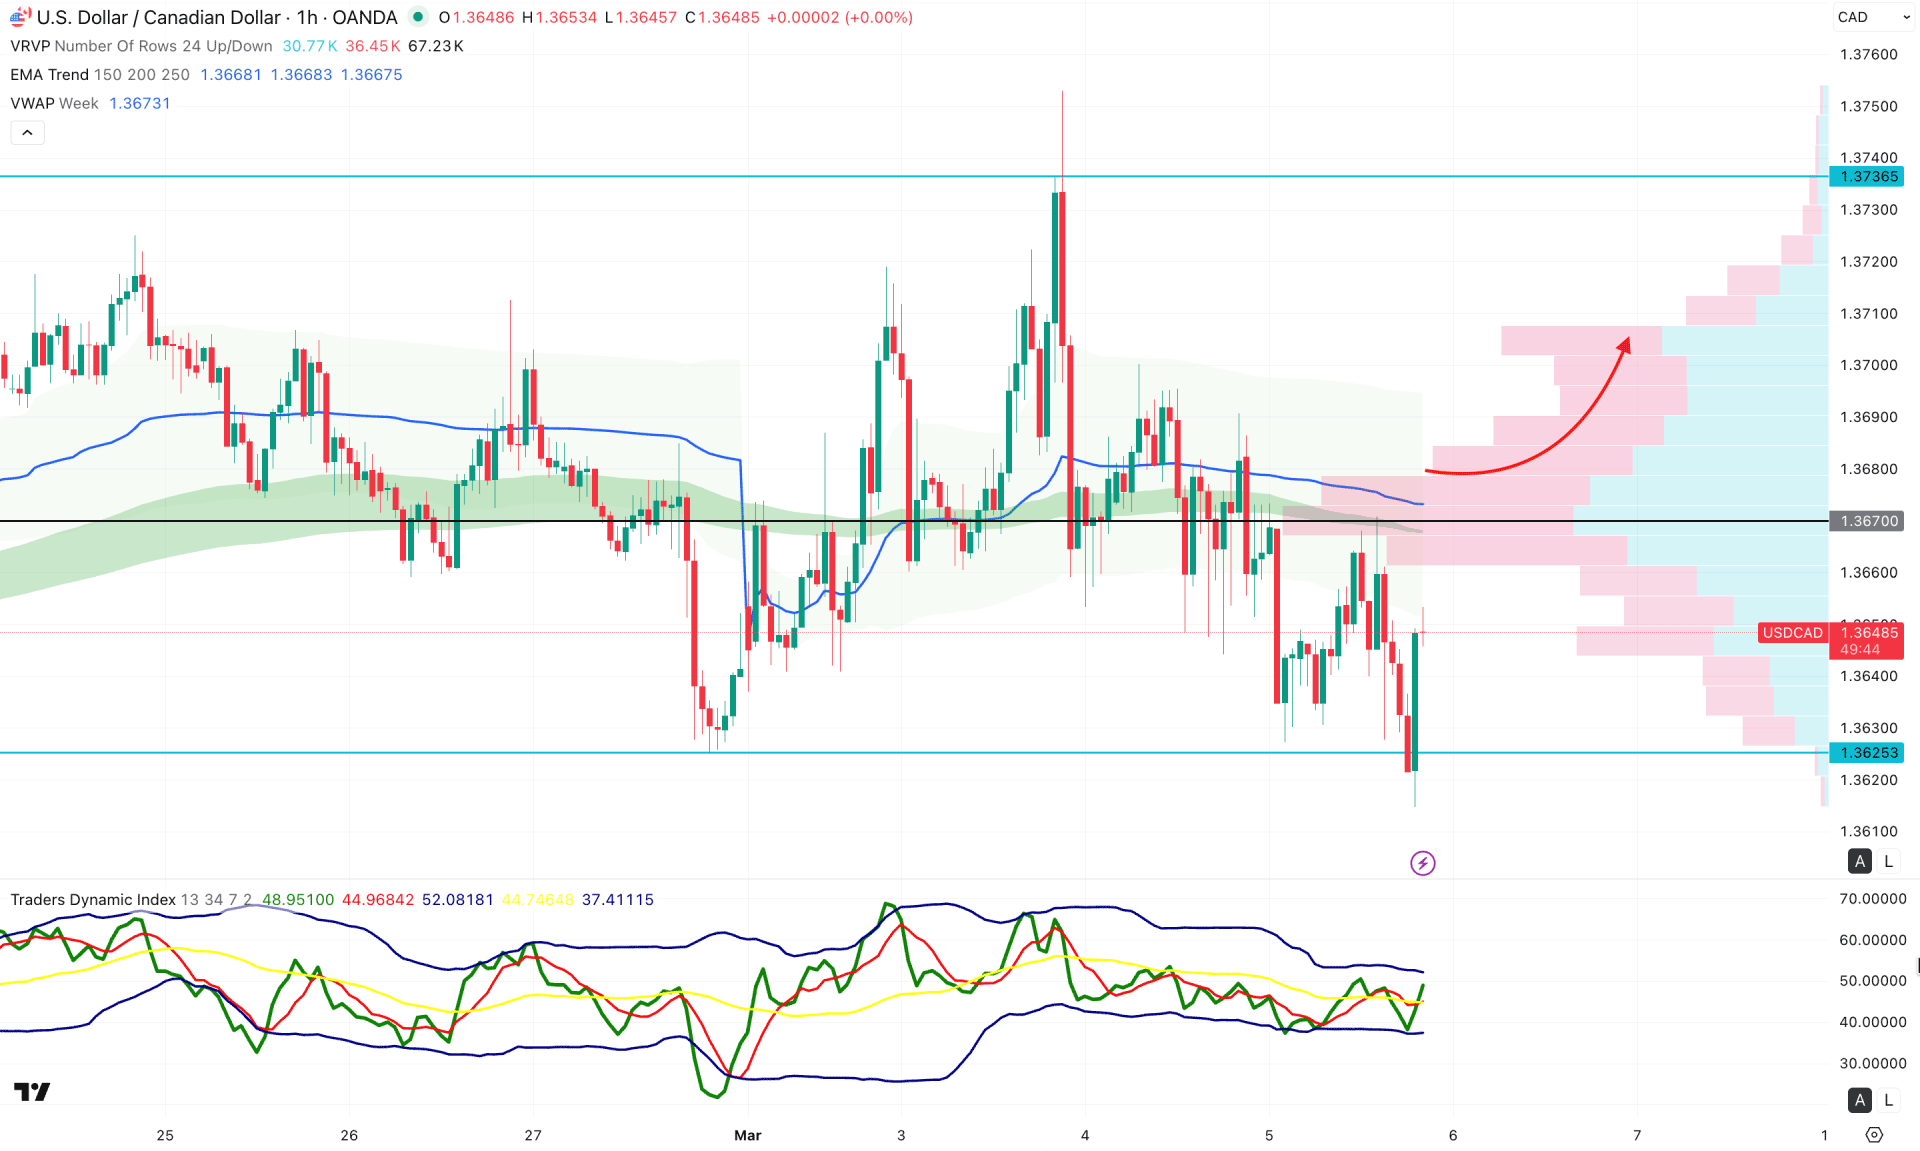
In the hourly timeframe, the price is trading under extremely volatile conditions due to recent developments related to geopolitical tensions. As a result, multiple violations have been observed in recent swings, while the latest bullish recovery has emerged from the 1.3625 level.
In the secondary indicator window, the weekly VWAP and the EMA wave are positioned above the current price, acting as immediate resistance. Additionally, the prior high is aligned near the VWAP around the 1.3670 level, reinforcing this resistance zone.
Although the price has recently bounced from the 1.3625 support level, investors should closely monitor how it reacts at the short-term resistance area. A sustained bullish move above 1.3680 could push the price toward the liquidity zone, potentially extending buying pressure above the 1.3710 area before forming a short opportunity.
On the other hand, failure to break above the weekly VWAP could provide a bearish signal, increasing the probability of forming a new low below the 1.3600 level.
Based on the overall market structure, USDCAD is trading in an extremely volatile environment amid rising uncertainty in the Middle East, which could act as a bearish catalyst. Investors should closely monitor oil prices, as they are strongly correlated with the Canadian dollar. Currently, the price remains range-bound, and a breakout from this range could initiate a fresh directional trend.


