
Published: March 7th, 2024
The inconsistent signals from the Federal Reserve's (Fed) position regarding interest rates impeded the US Dollar's (USD) substantial recovery from its lows in early February.
Wednesday, Fed Chair Jerome Powell told US legislators that rate cuts are probable this year. The central bank is awaiting evidence that inflation has reached the 2% target. In contrast, Neel Kashkari, president of the Federal Reserve Bank of Minneapolis, downplayed expectations of aggressive policy easing. He also suggested that the number of rate cuts could be reduced in the wake of stronger US economic data.
On the contrary, the Canadian Dollar (CAD) gained strength due to the hawkish position adopted by the Bank of Canada (BoC) after its recent meeting. Despite weakening crude oil prices, which normally strengthen the loonie, the currency maintained its strength.
In addition, a cautious tone in equity markets and a recovery in the yield on 10-year US government bonds from a one-month low bolstered demand for the USD as a safe-haven currency, thereby containing downside pressure on the USDCAD pair.
Investors are awaiting economic data releases, such as Weekly Initial Jobless Claims and Trade Balance figures from the United States and Canada. In conjunction with US bond yields and overall market sentiment, these factors are expected to impact USD demand and provide guidance for the USDCAD pair.
Let’s see the upcoming price direction from the USDCAD technical analysis:
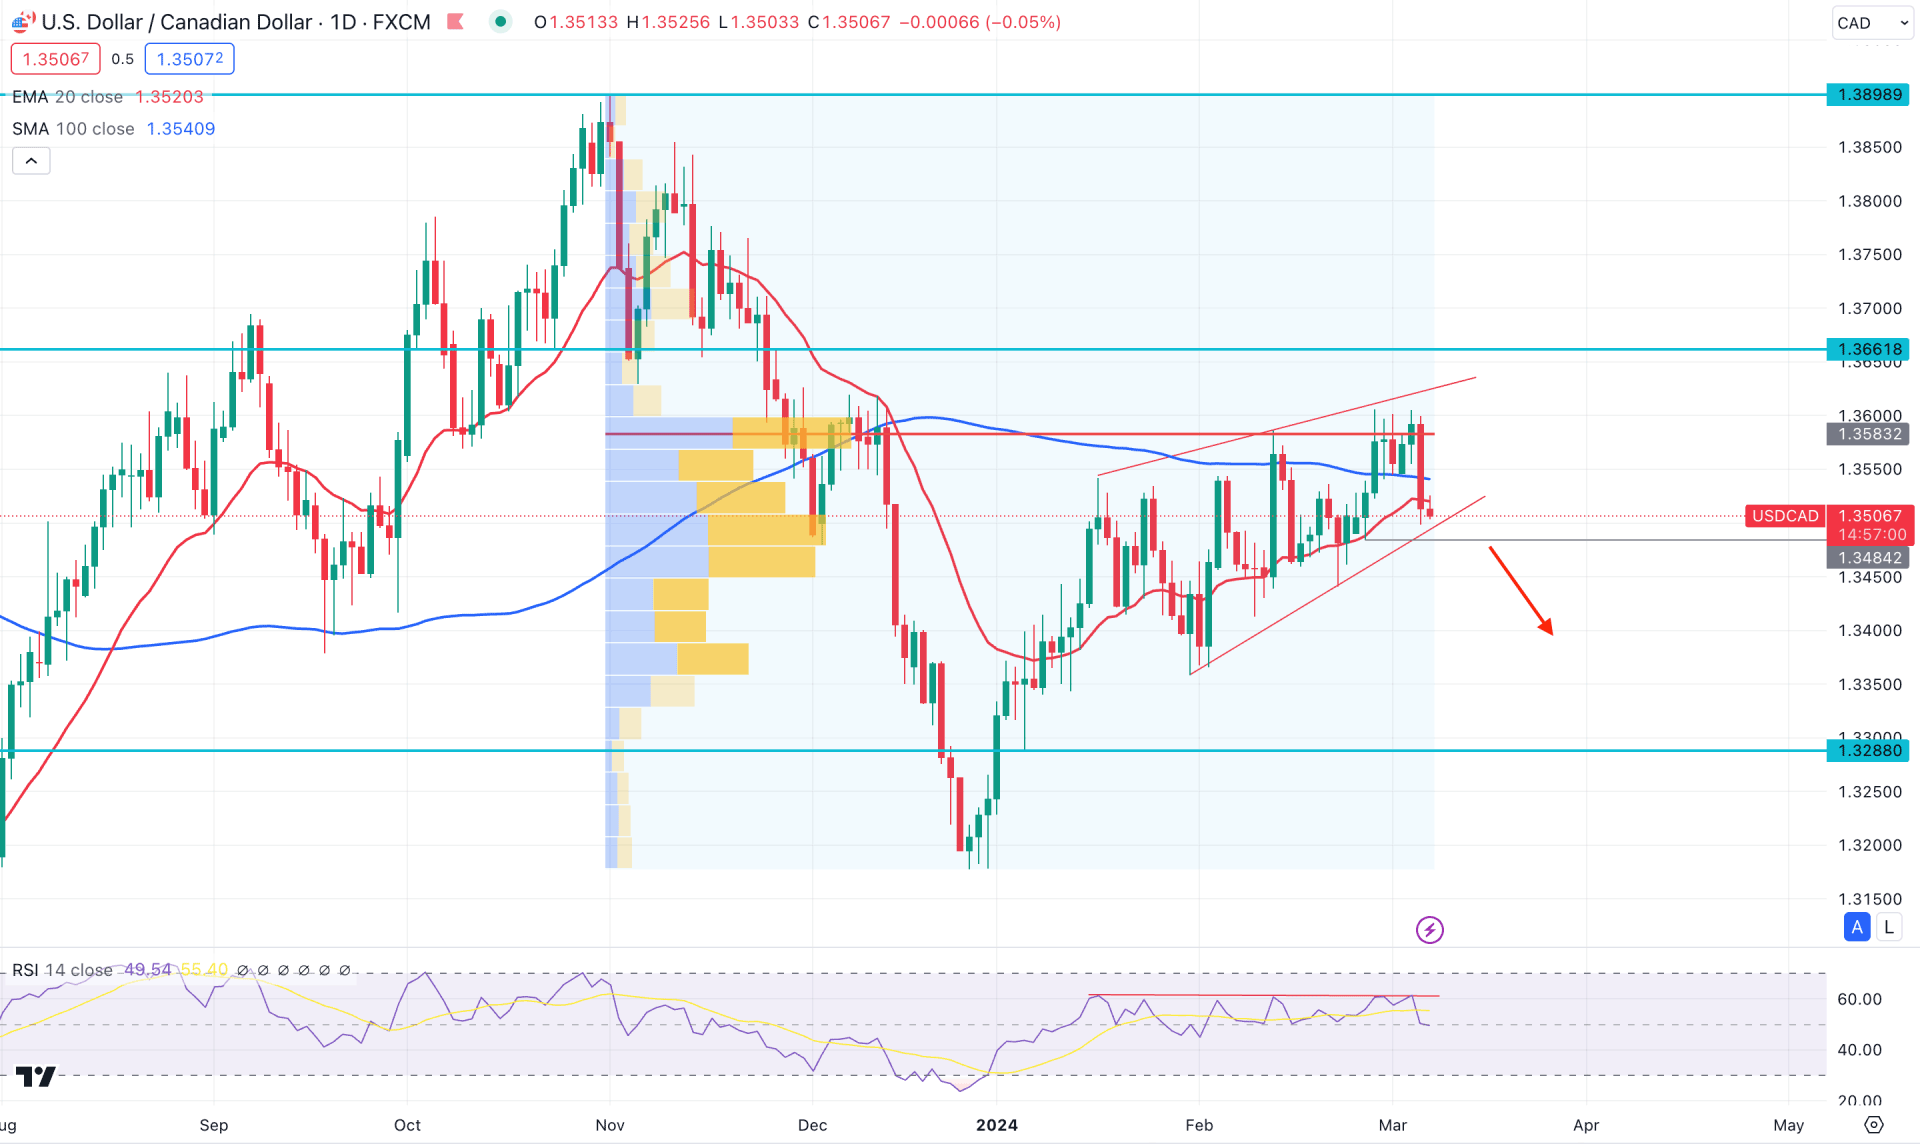
In the daily chart of USDCAD, the ongoing price action shows a corrective pressure, which needs more clues before a stable trend is anticipated. Primarily, downside pressure, which came from fundamental factors, could be positive for CAD, but investors should keep a close eye on upcoming US releases.
A macro view is visible on the monthly candlestick pattern, where the current candle trades bearish after a prolonged bullish sentiment from January. In that case, a downside reversal needs more clues. A continued selling pressure with a monthly candle below the 1.3366 level could validate the long-term sell signal. However, an early opportunity is visible from weekly candles, which have been extremely corrective for the last two months.
Looking at the highest activity level- the most significant price level since October 2023 is at 1.3583 level, which is above the current price. Moreover, a strong range breakout with a bearish daily candle is visible from this line, which could work as an early bearish sign.
In the daily price. A rising wedge pattern is visible, where a valid break below the wedge support could be a potential short opportunity. Moreover, the 100-day Simple Moving Average is above the current price, working as a confluence resistance. The 20-day Exponential Moving Average is also above the current price, which might work as a confluence bearish factor.
An RSI divergence is in play, suggesting a bearish signal. In that case, a valid downside pressure with a daily close below the 1.3484 level could be a high probable short opportunity, targeting the 1.3288 support level.
On the other hand, a range extension is possible towards the 1.3625 resistance level. However, a continued bullish momentum with a daily close above the 1.3661 level could open the room for reaching the 1.3800 psychological level.
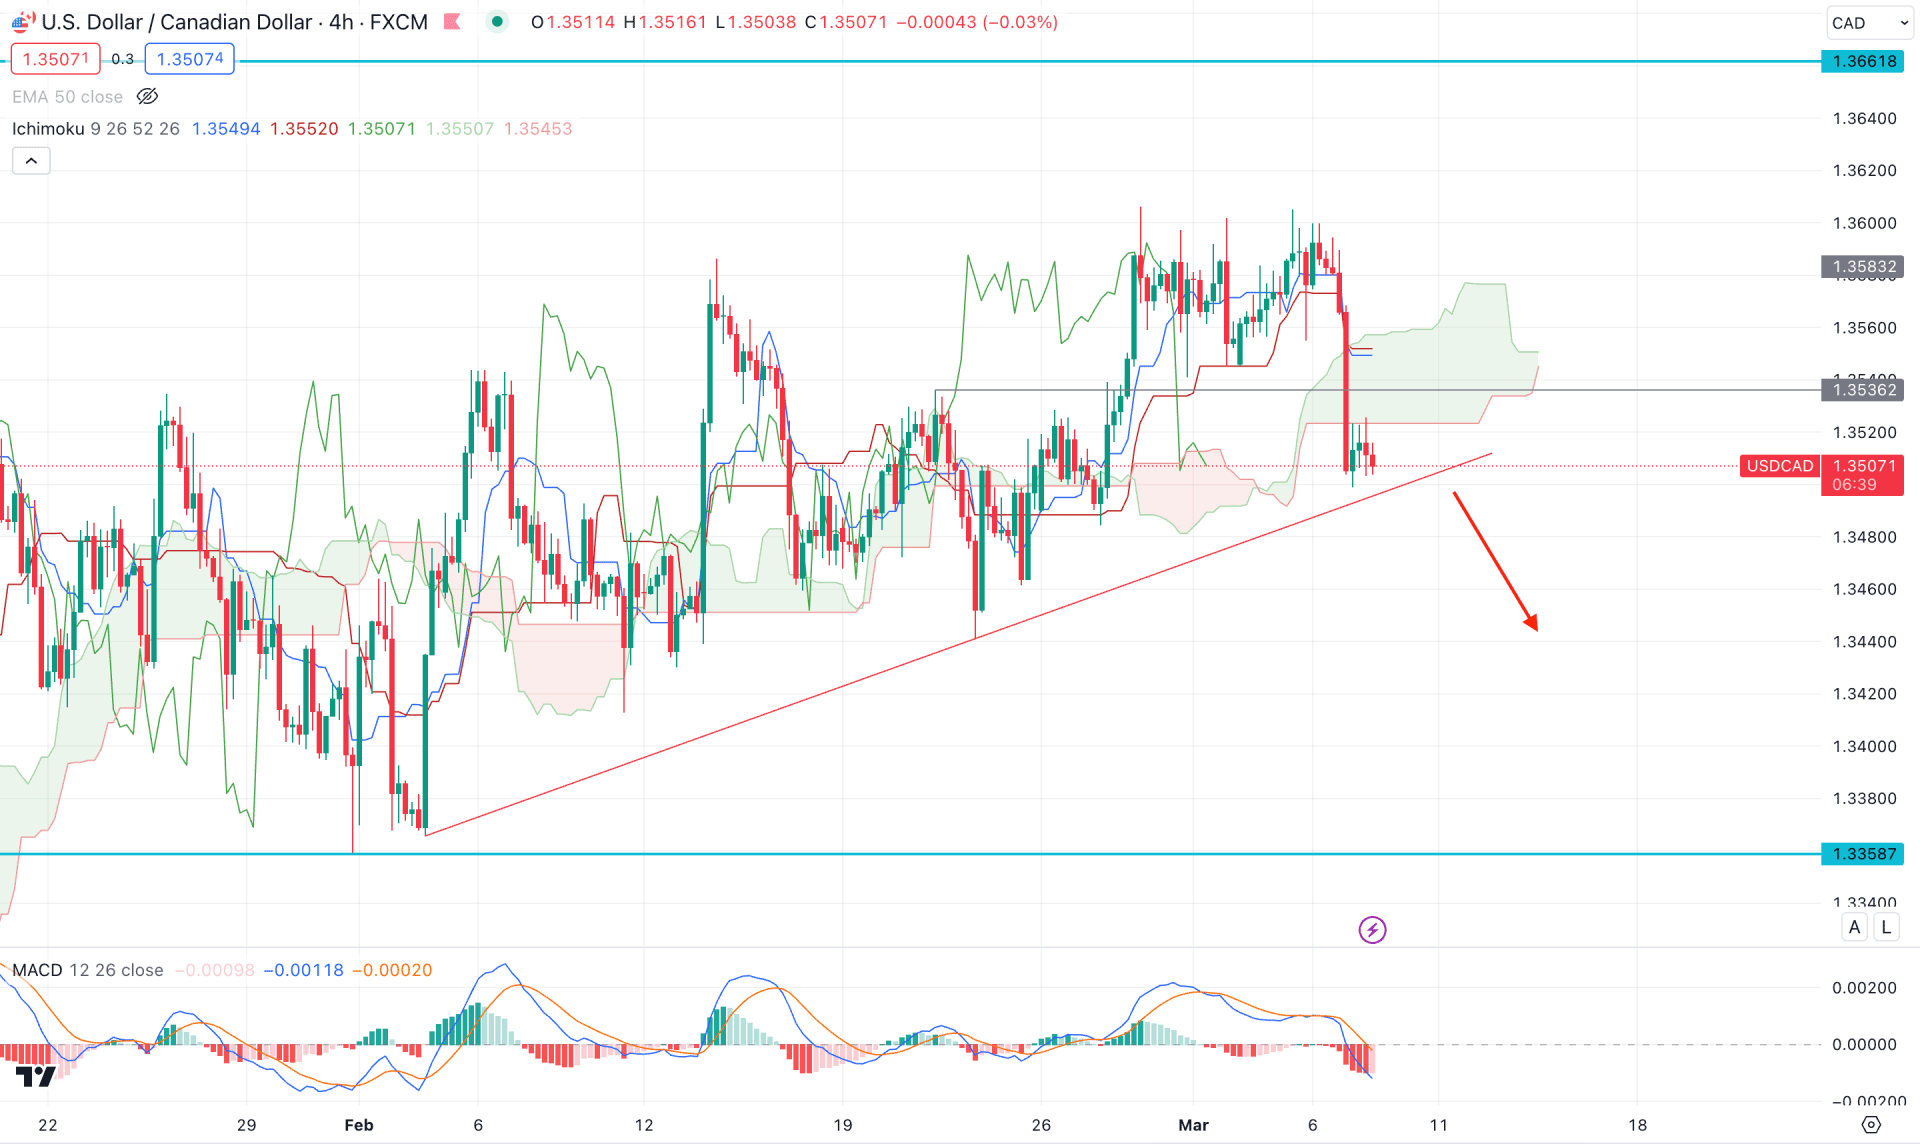
In the H4 timeframe, the overall market momentum is corrective for the USDCAD price. Moreover, the future cloud is sideways, which signals a possible breakout in the coming hours.
In the secondary indicator window, the recent reading suggests a selling pressure from the bearish Histogram. Moreover, there is extensive downside pressure with a bearish H4 candle, which is slightly below the dynamic Kijun Sen level.
Based on this outlook, investors should closely monitor how bears hold the selling pressure below the Ichimoku Cloud zone. A corrective momentum below the dynamic Kijun Sen level could signal a bearish possibility to grab the sell-side liquidity from the rising trendline.
On the bullish side, an elimination of the recent bearish H4 candle with a stable price above the cloud high could signal a long opportunity, targeting the 1.3640 resistance level.
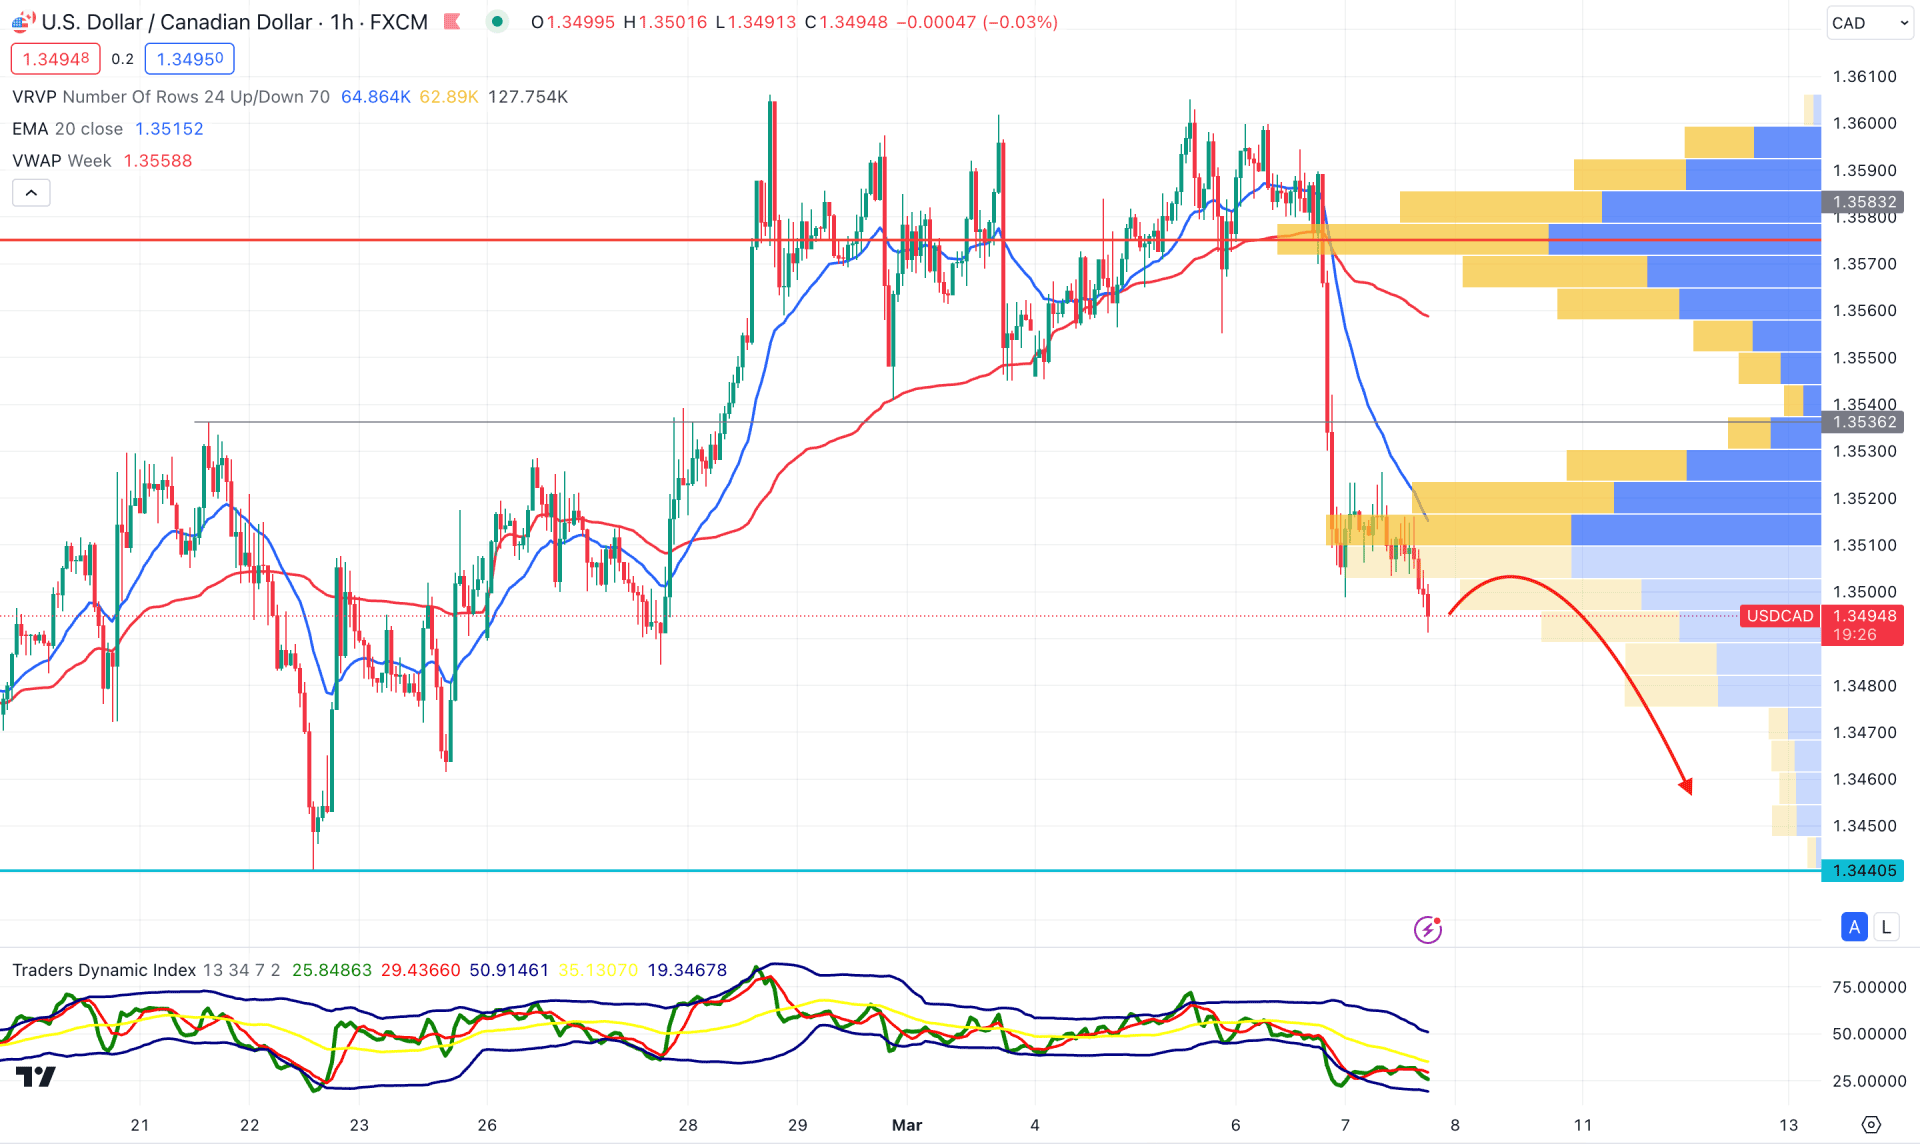
In the hourly chart of USDCAD, extensive selling pressure is visible as the current price trades below the dynamic 20 EMA. Moreover, the VWAP level is above the current price with a bearish slope, suggesting a confluence sell signal.
Considering the high volume level position above the current price and the TDI level below the 50.00 level, we may consider the ongoing selling pressure to extend in the coming hours toward the 1.3440 support level.
On the other hand, an immediate bullish pressure with a daily candle above the 1.3590 level could alter the current market outlook and initiate a bullish continuation towards the 1.3700 area.
Based on the current market outlook of USDCAD, investors might expect a strong bearish opportunity after a potential rising wedge breakout. However, an early show opportunity is possible from the lower timeframe, depending on the price action.


