
Published: October 5th, 2021
USD/CAD is going to face a volatile week where Canadian and US job numbers might provide a stable direction about the economy. However, the broader weakness in the Canadian dollar with the recent surge in the energy price might change the direction soon.
According to the National Bank of Canada, the correlation between the Canadian dollar and energy price is unusual, and the loonie should strengthen with a decline in the energy price. The Bank of Canada’s index for commodities and energies produced in Canada reached the multi-year high in Q4. Despite the surge, the loonie became weaker in recent months. Therefore, it is unprecedented to see the CAD more fragile now. Thus, the divergence between the loonie and energy price might end with strength in the CAD or weaker energy prices. According to the National Bank of Canada, the possibility of a downside pressure in energy prices is low. Therefore, only CAD can eliminate the divergence by showing strength.
Investors will see important releases from BoC and FED regarding the employment data where the US Dollar is favorable as the US economy may show more job numbers than before. In that case, investors should remain cautious about the market volatility that may cause a sharp move in either ways.
Let’s see the upcoming price direction from the USD/CAD technical analysis:
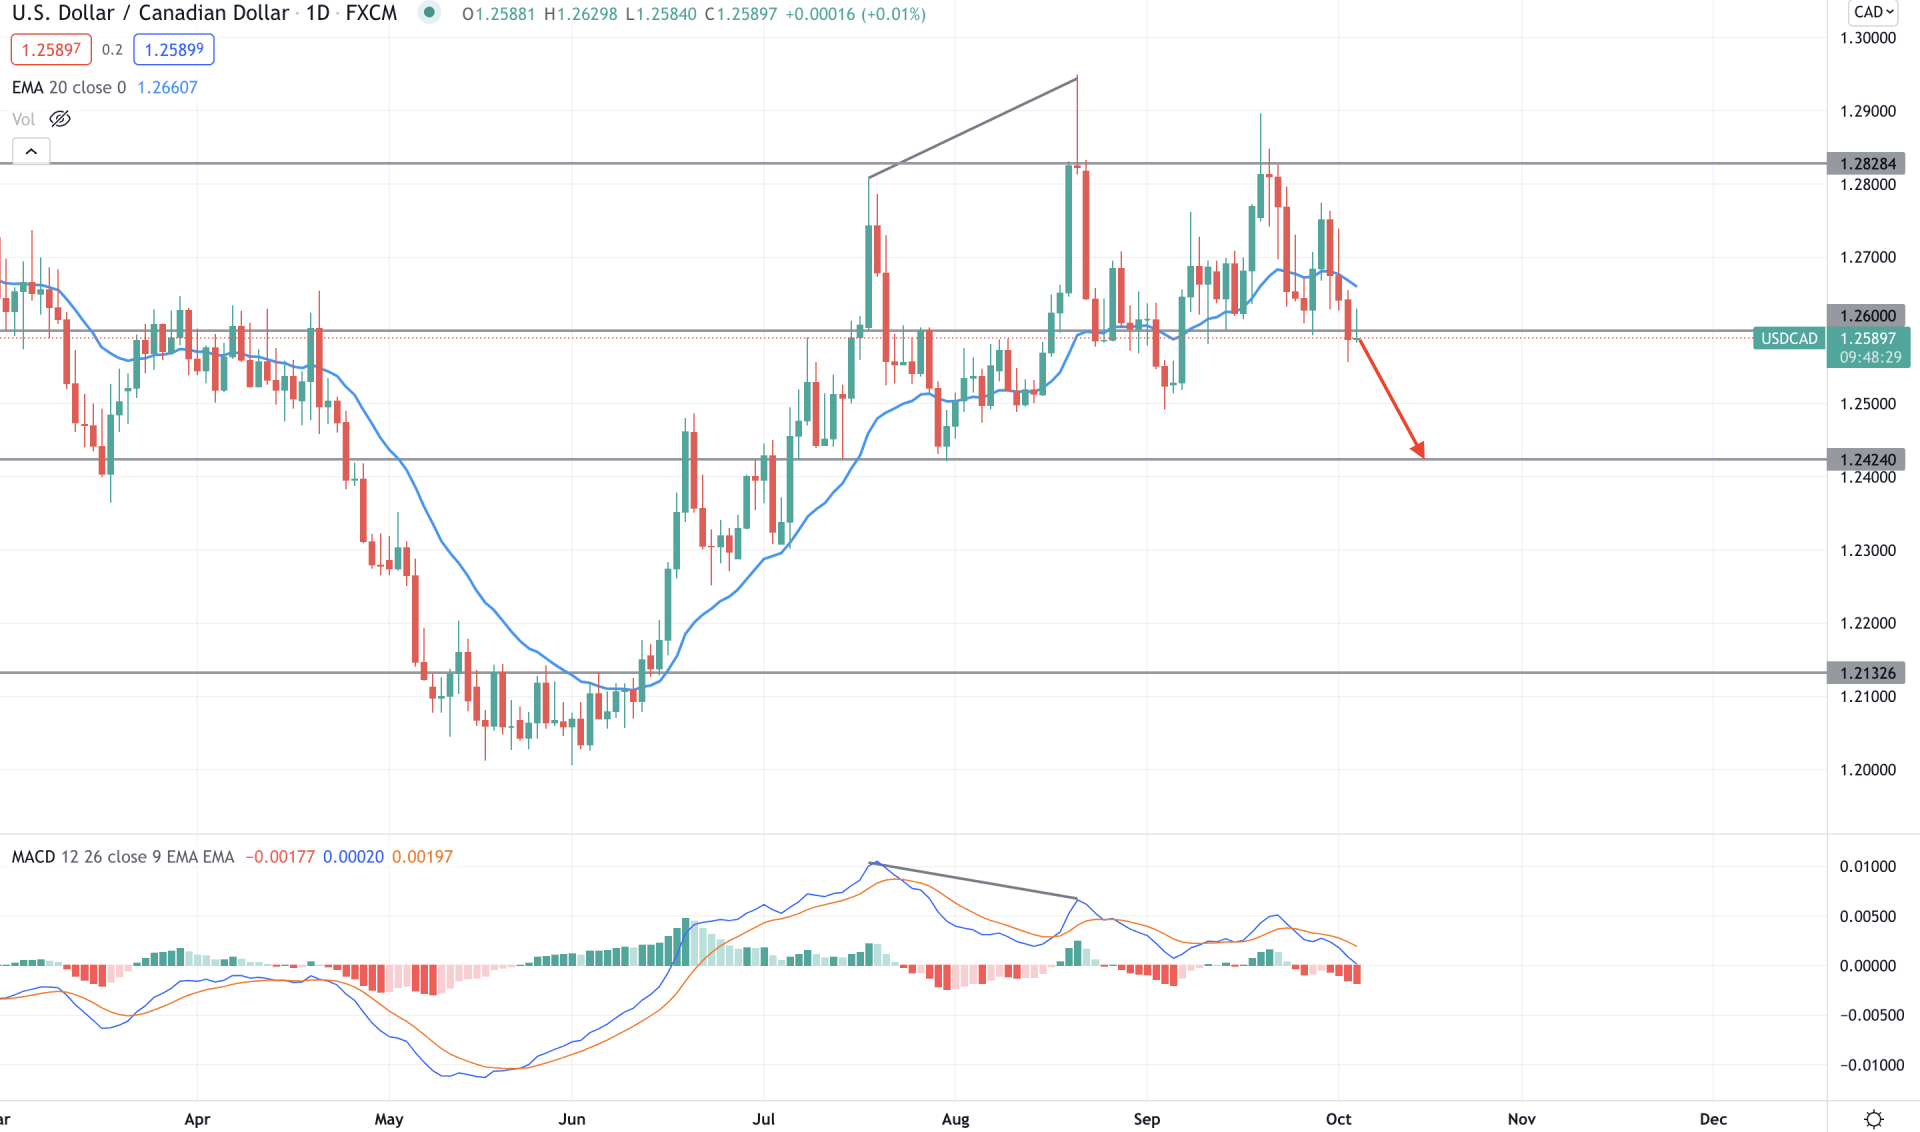
After a long bearish pressure, USD/CAD bulls became active from the beginning of June. The price broke the long consolidation and moved above the dynamic 20 EMA, pushing bulls to test the new yearly high at the 1.2949 level. However, since August, the price has become highly volatile and attempted to reach the yearly high again but failed. In the most recent chart, the price is trading at the psychological 1.2600 level from where a reliable movement is expected.
The above image shows how the price moved below the dynamic 20 EMA and closed the daily candle below the 1.2600 level. Meanwhile, the MACD Histogram remained bearish and made new lows, followed by a regular divergence.
Therefore, based on the daily context, both bulls and bears can take the price towards their direction. However, as the price is below the dynamic 20 EMA with a bearish MACD, bears are more likely to take the price towards the 1.2424 support level. Conversely, a daily close above the 1.2600 may need a stable price above the dynamic 20 EMA to consider the trend as bullish.
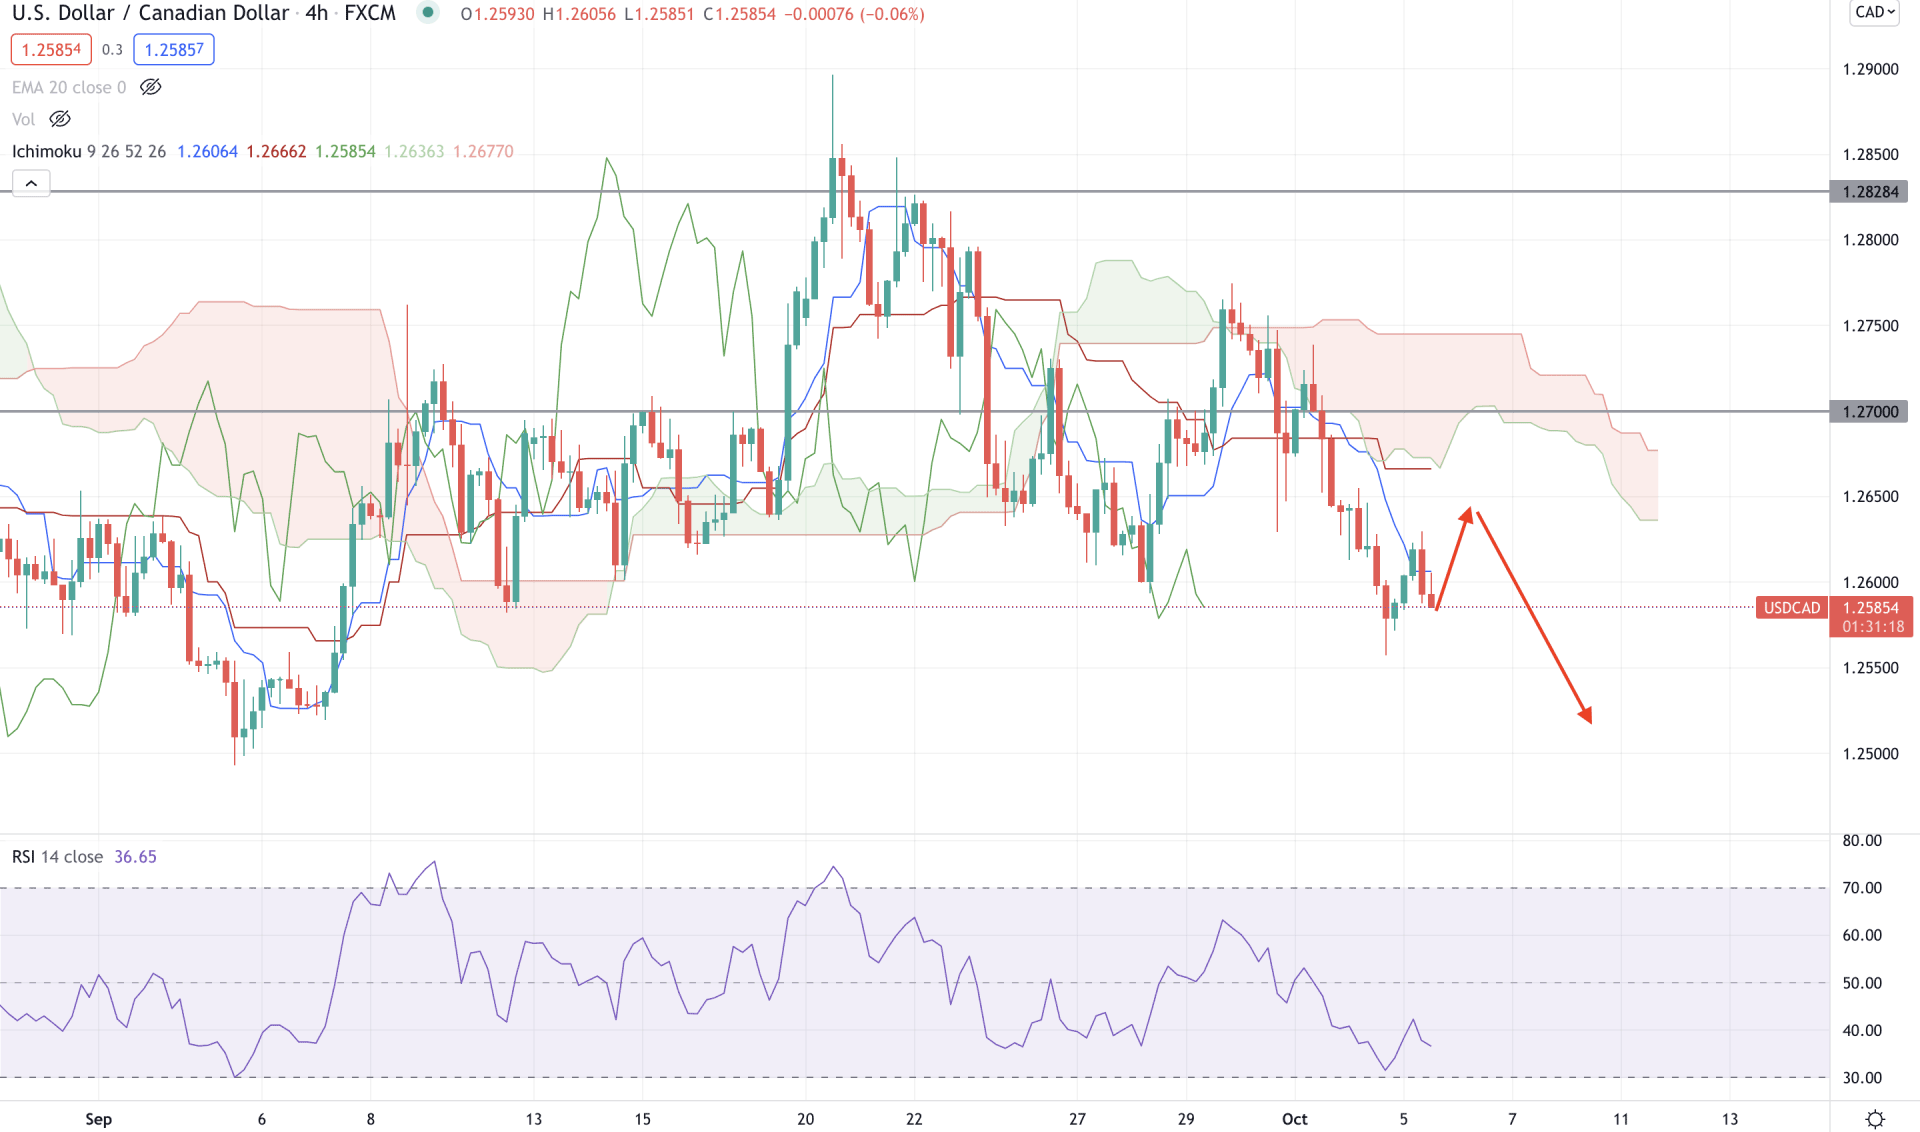
According to the Ichimoku Kinko Hyo, USD/CAD is bearish as the price has been trading below the Kumo Cloud for a considerable time. Moreover, in the future cloud, Senkou Span A is below Senkou Span B and aiming lower. Meanwhile, the lagging span remains below the cloud and price. Therefore, as long as the price is trading below the 1.2700 psychological level, it may move lower in the coming session.
The above image shows how the price is trading below the Kumo Cloud, where the RSI remained below the 50 levels with a bearish pressure. Moreover, the Tenkan Sen crosses down the Kujun Sen and works as a minor resistance to the price, a strong sign of possible bearish pressure.
Based on the H4 context, the overall market sentiment is bearish as long as it is trading below the dynamic Kijun Sen. In that case, the primary target would be 1.2500 level, but a stable bullish H4 close above the 1.2750 may alter the current market structure and take the price towards the 1.2828 level.
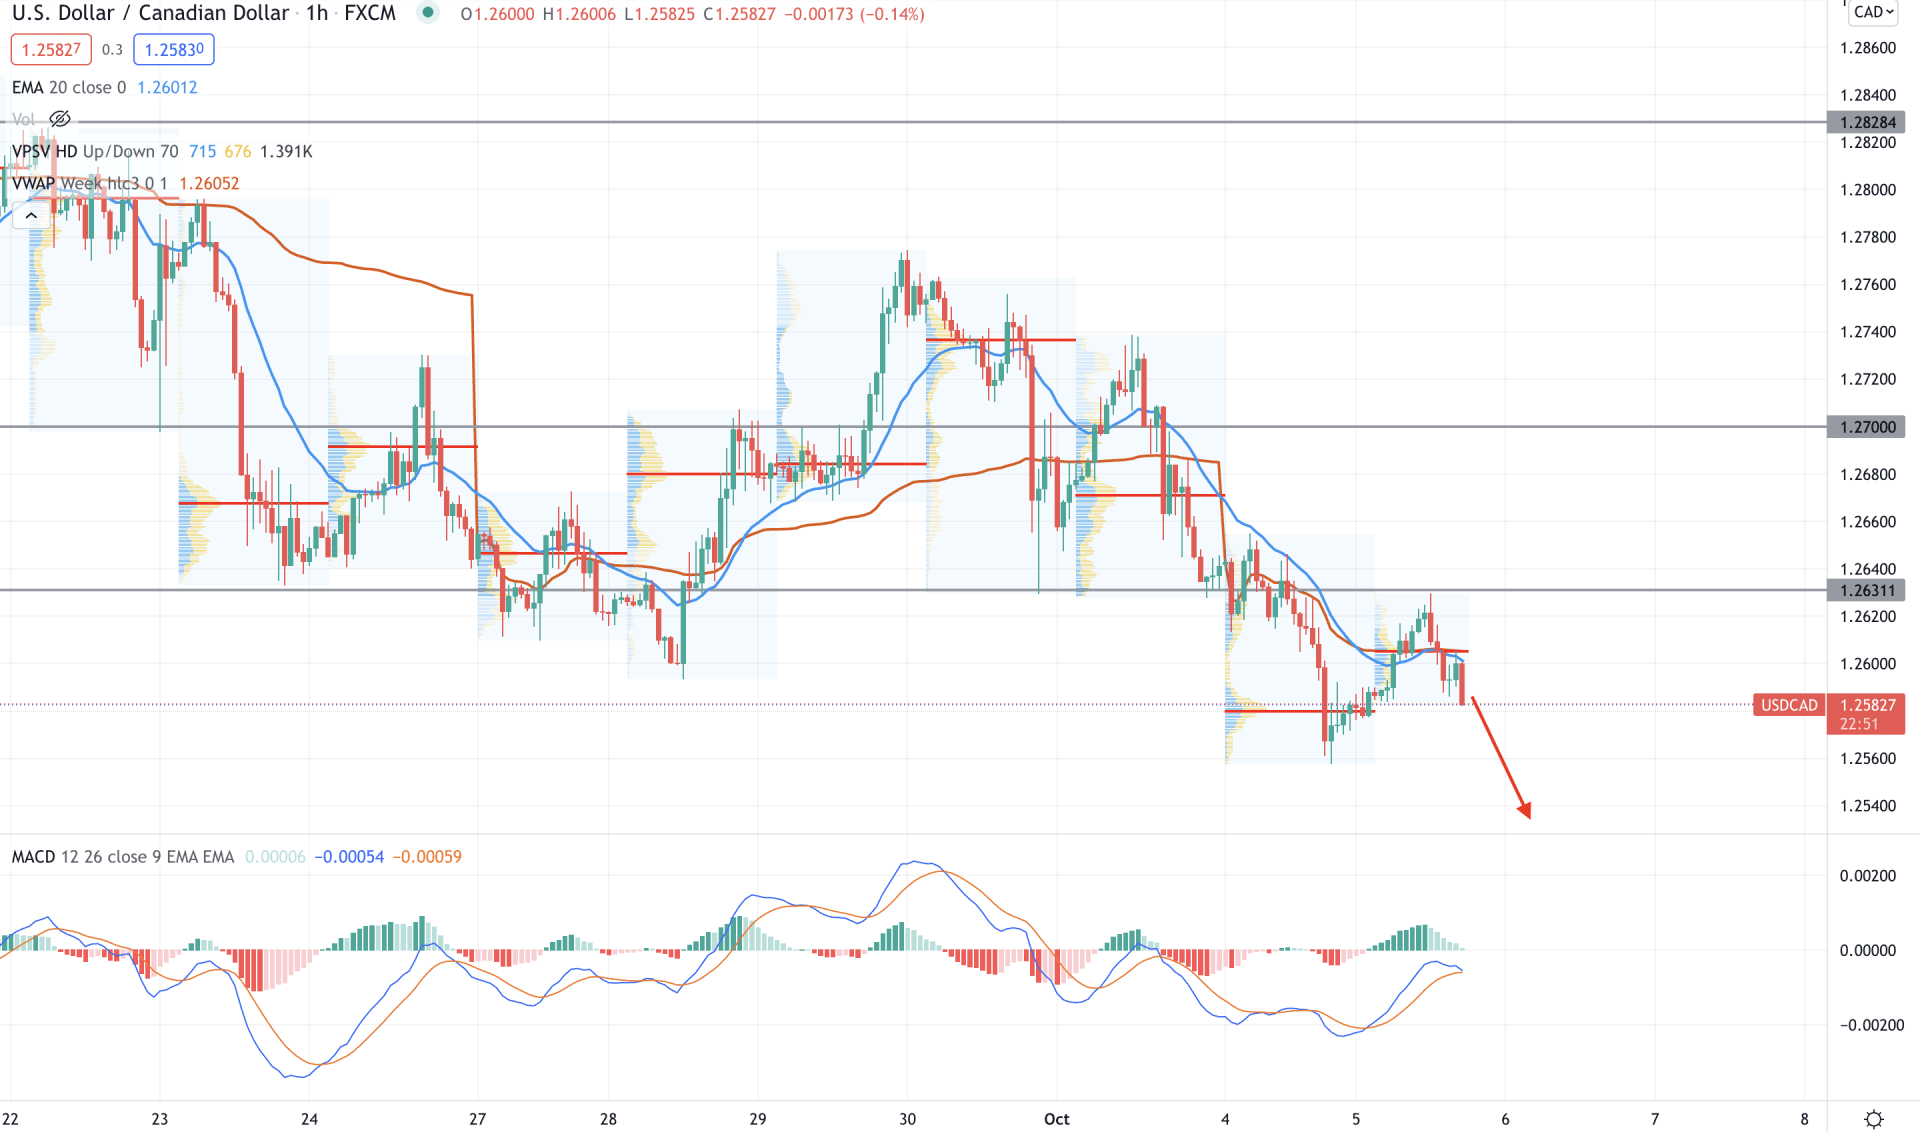
In the intraday chart, USD/CAD bears are active as they pushed the price below the 1.2611 intraday event level for more than a day. Moreover, the price tried to move above the intraday event level but failed and moved below the intraday high volume level of 1.2605. Therefore, as the price is trading below the 1.2611 level, it may move lower in the coming hours.
The above image shows how the price moved below the dynamic 20 EMA and weekly vwap with a bearish H1 close. Meanwhile, the MACD Histogram moved to zero level with a hidden divergence. Therefore, based on the H1 context, the bearish pressure may extend towards the 1.2500 level that is valid until the price moves up above the 1.2700 level with a bullish H4 close.
As of the above discussion, we can say that the USD/CAD bears have a higher possibility of taking the price towards the 1.2424 level in the coming days. However, the price is still near the 1.2600 event level, where a strong bullish daily close above the dynamic 20 EMA may alter the current market condition and take the price higher towards the 1.2828 resistance level.


