
Published: July 18th, 2024
In the recent chart, the USDCAD pair remained in its typical trading range of around 1.3685. Investors are anticipating the upcoming US weekly Initial Jobless Claims report, the Philadelphia Fed Manufacturing Index, and a speech by Fed official Lorie Logan later on Thursday.
The CME Group's FedWatch Tool indicates that traders in the fed funds futures market anticipate an initial quarter percentage point rate decrease in September. This anticipation came with dovish words from Fed members, weighing on the greenback.
On Wednesday, Fed Governor Christopher Waller stated that the US central bank is "getting closer" to cutting interest rates. Meanwhile, Richmond Fed President Tom Barkin emphasized the need for greater signs of sustained disinflation before lowering the key interest rate.
In Canada, slower CPI inflation data have stoked speculation that the Bank of Canada (BoC) will decrease interest rates next week. Financial markets have priced in roughly 93% odds of a rate cut by the BoC in July, up from 82% before the inflation data was released.
Higher crude oil prices, fueled by a larger-than-expected weekly decline in US crude oil stockpiles, may support the commodity-linked Loonie. Notably, Canada is the top oil exporter to the US.
Let's see the upcoming price direction of this currency pair from the USDCAD technical analysis:
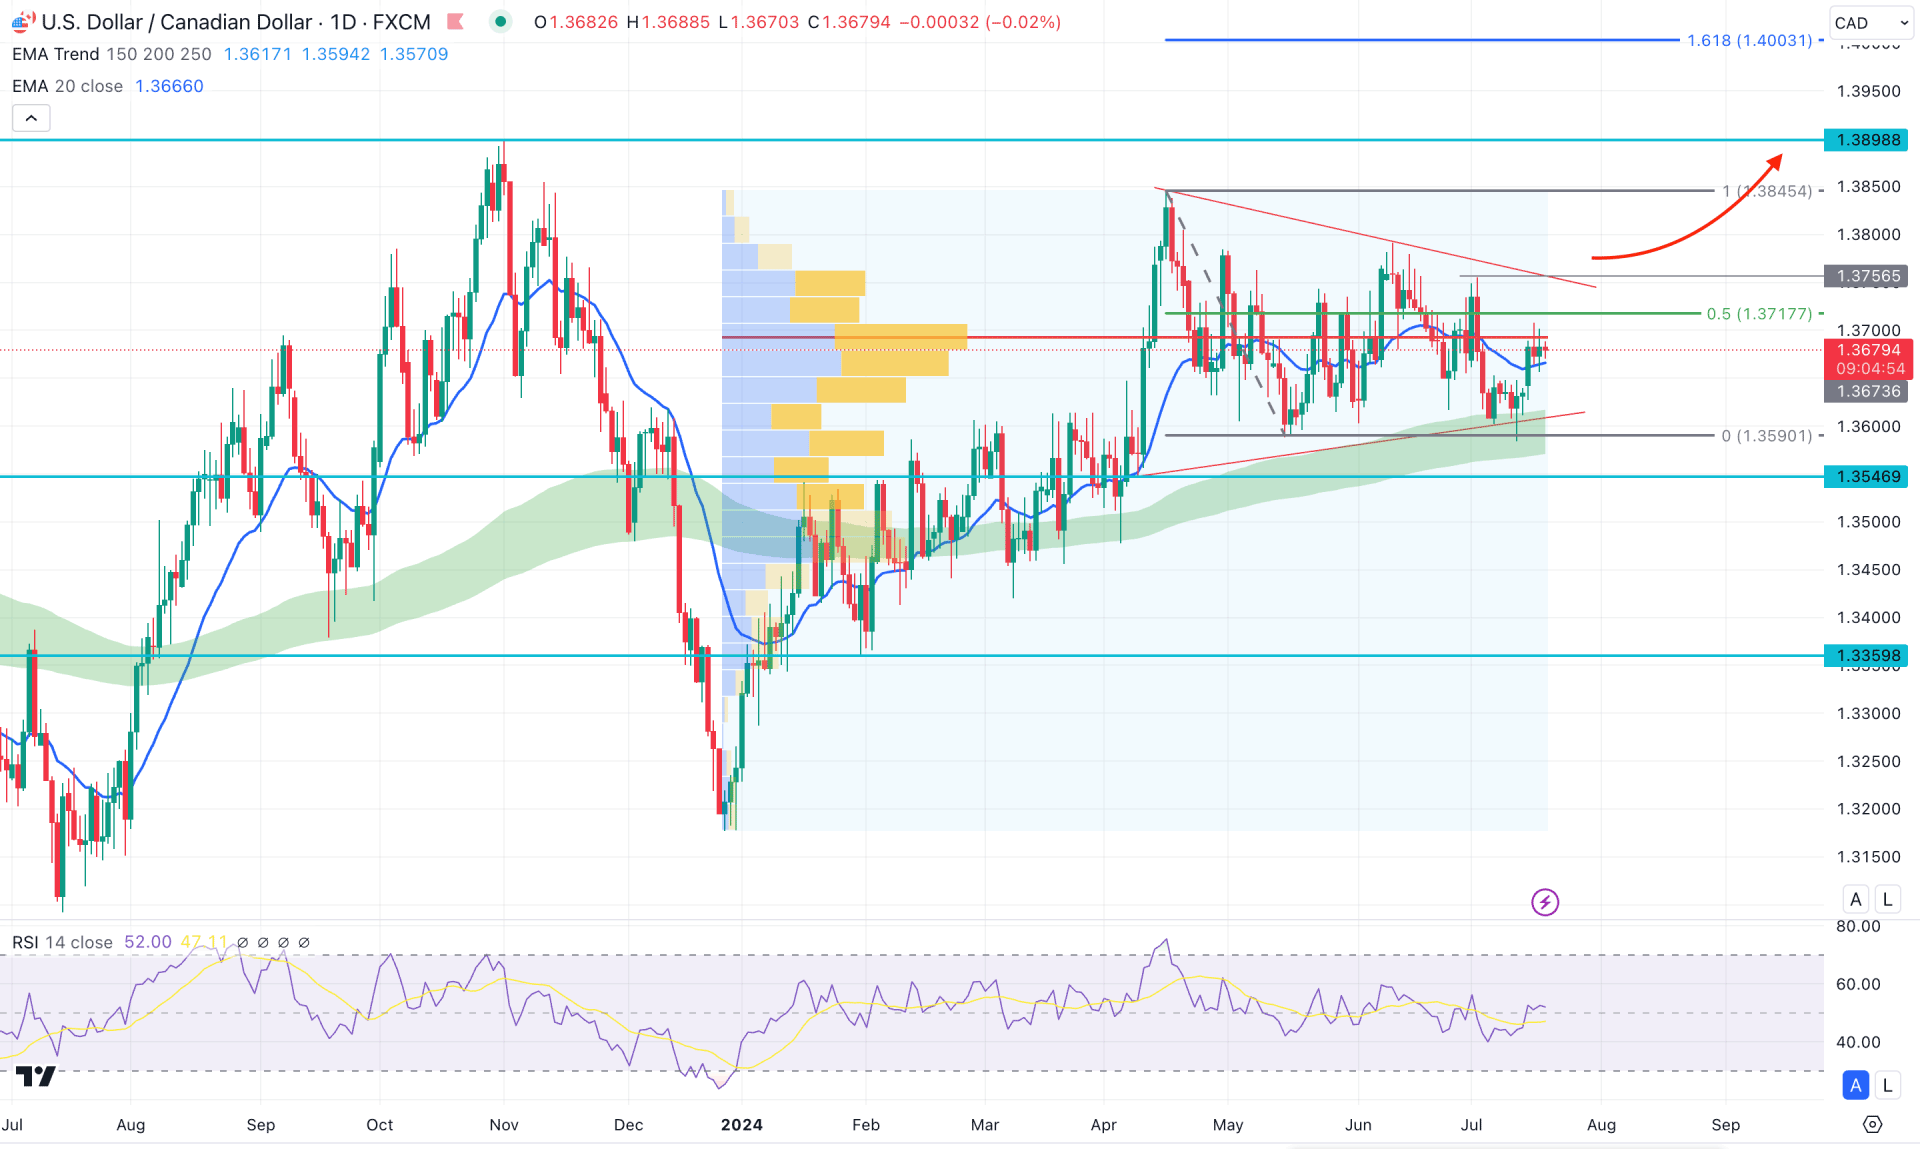
The daily price of USDCAD has been prolonged since May 2024 as the price failed to form significant high and low levels since then. In that case, investors should monitor how the price reacts in the near-term price action, from where a strong breakout could create an impulsive trend.
Looking at the broader context, the bullish monthly candle in May 2024 is potent, as no significant selling pressure has been seen since the monthly close. Moreover, the ongoing buying pressure is visible in July, where a valid close above the 1.3791 monthly resistance could validate the long-term bullish opportunity.
Following the broader trend, the volume structure is supportive, with the highest volume level since January 2024 at 1.3693, below the current price. As the ongoing buying pressure is potent above this crucial line, we may consider that institutional investors are in a long position to use this instrument.
In the main price chart, the dynamic MA wave, consisting of 150 to 250 EMA, remains below the current price with a bullish slope. Also, the ongoing corrective pressure is within the symmetrical triangle formation, where the MA wave is at triangle support.
In the secondary window, the recent RSI shows a bullish reversal and moves above the 50.00 level, creating a bullish reversal possibility in the main chart.
Based on the daily market outlook, a range extension is highly possible, where the main aim is to test the 1.3756 resistance level. As the ongoing buying pressure is supported by the 20-day EMA, a bullish break from the above-mentioned static resistance could create a valid triangle breakout. In that case, the primary intention for this pair would be to test the 1.4000 psychological level, which is also a crucial 161.8% Fibonacci Extension Point.
On the bearish side, a bearish rejection from the 1.3750 to 1.3800 level could open a short opportunity, aiming for the 1.3546 static level.
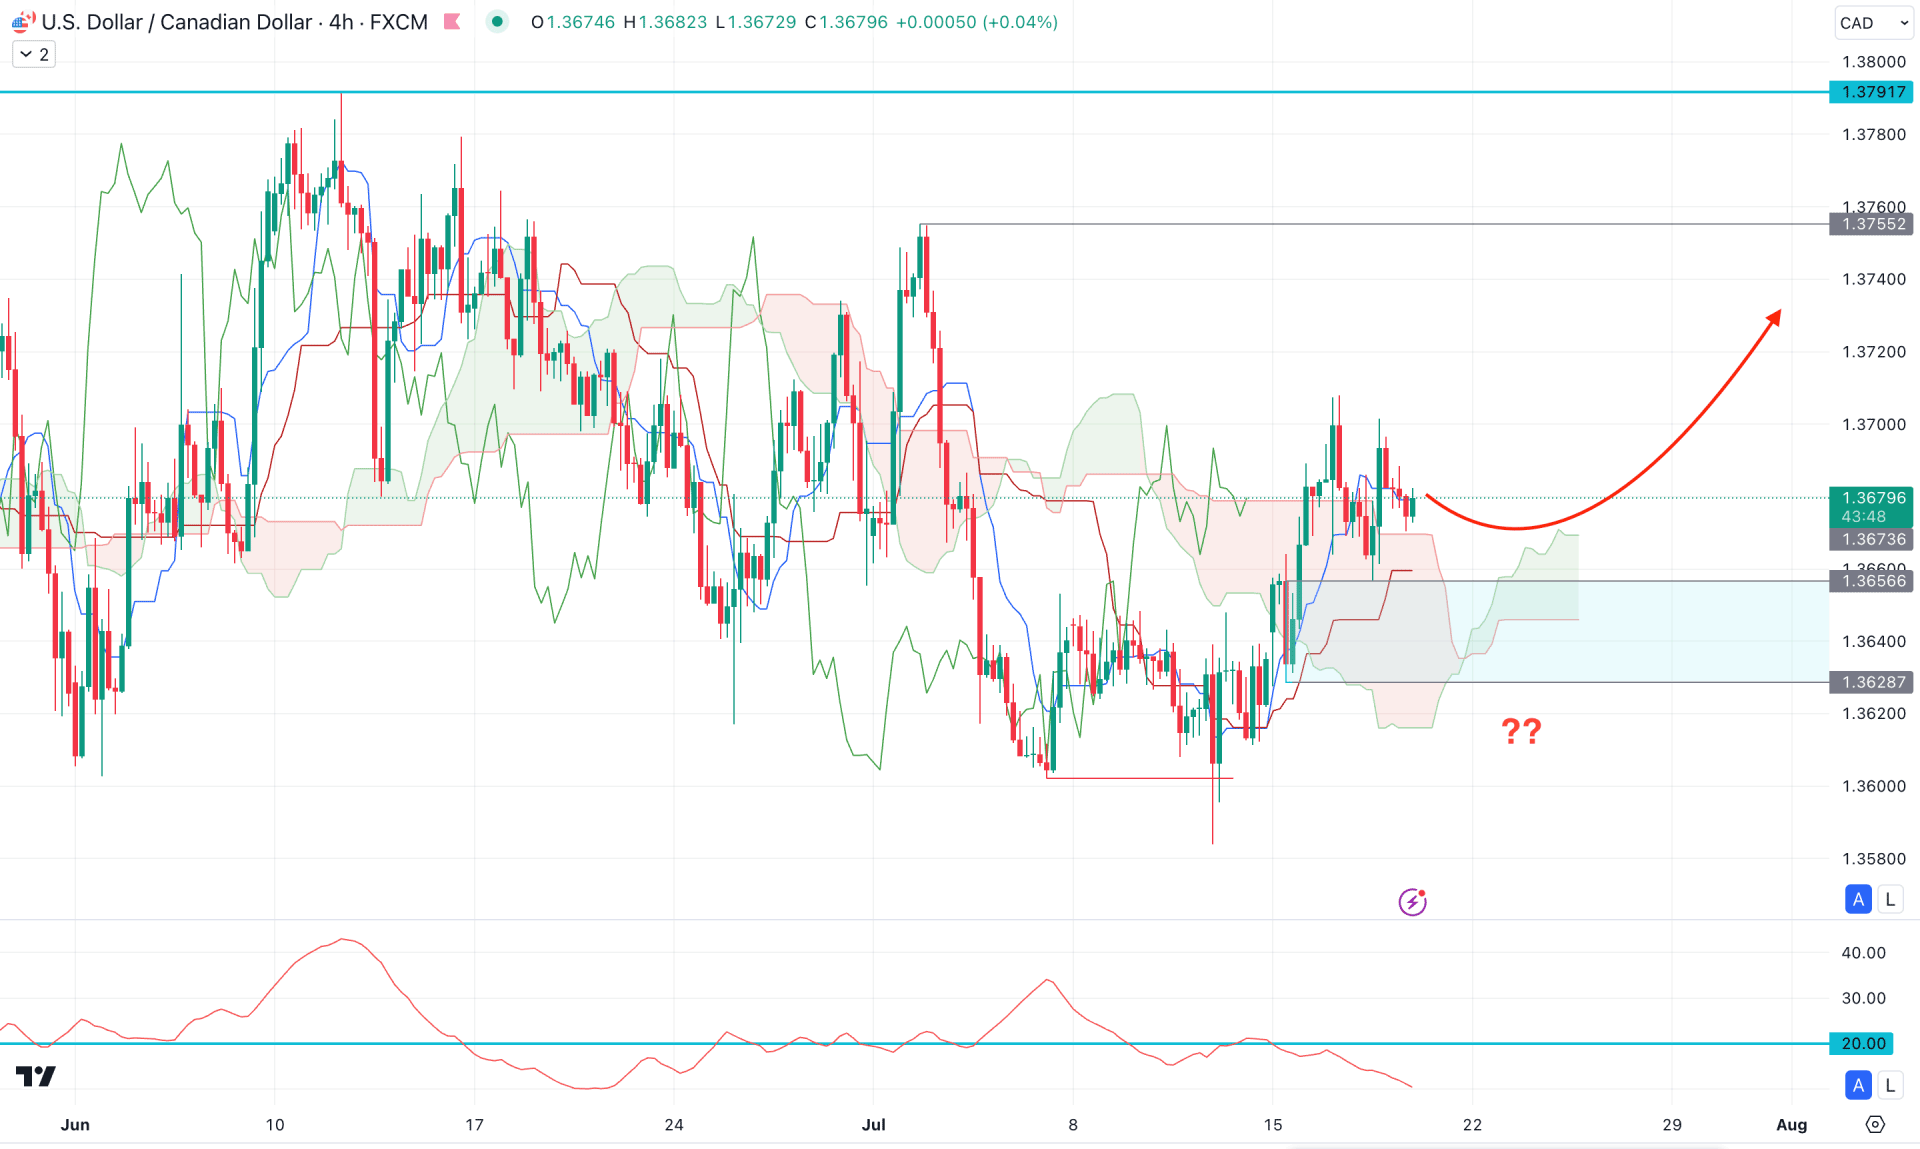
In the H4 outlook, the recent price showed a strong bearish liquidity sweep from the 1.3602 level, from where a bullish counter impulsive pressure has come. Moreover, the recent price trades sideways above the Ichimoku Cloud zone, suggesting a potential trend reversal.
The ongoing buying pressure failed to produce a valid trend, as the Average Directional Index (ADX) remains below the satisfactory 20.00 line.
Based on the H4 outlook, a downside correction and a valid bullish reversal from the 1.3656 to 1.3628 zone could be a potential bullish opportunity. In that case, a stable buying pressure above the dynamic Kijun Sen level might extend the price above the 1.3755 resistance level.
On the other hand, a failure to hold the price above the 1.3628 support level with a bearish H4 close below the cloud support could lower the price in the coming session.
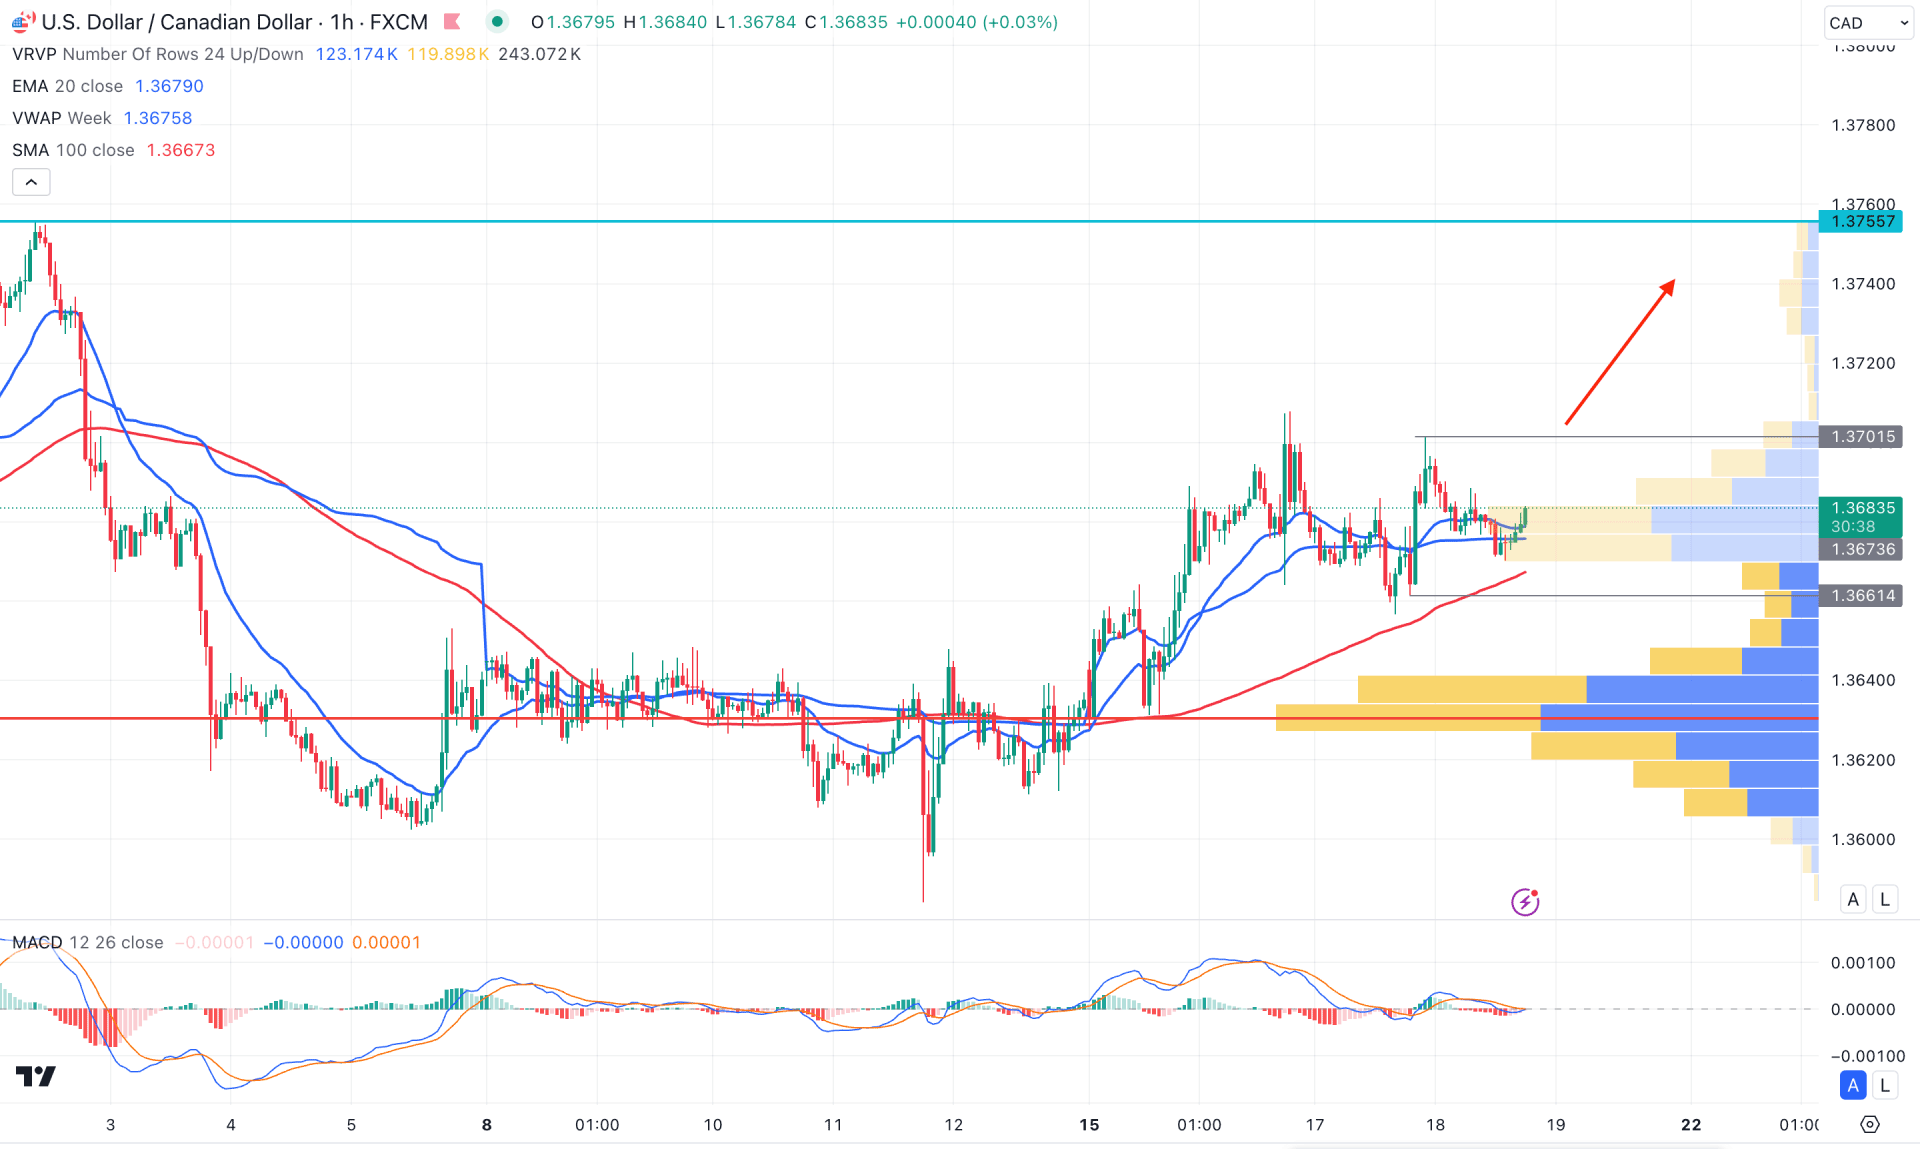
In the hourly chart of USDCAD, the recent price trades are bullish. The 100 Simple Moving Average is below the current price, which is strong support. Moreover, the visible range high volume line is below the 100 SMA line, which might work as major support for this structure.
In the near-term price action, the dynamic weekly VWAP is also below the current price, from where a bullish H1 candle is visible.
In this outlook, an immediate upward continuation is highly possible. Moreover, an hourly candle above the 1.3701 resistance level could validate the long-term bullish possibility, targeting the 1.3755 resistance level.
Based on the current price structure, USDCAD is more likely to continue the buying pressure and test the daily symmetrical triangle resistance. Moreover, a valid break triangle breakout could resume the existing trend long-term.


