
Published: May 8th, 2024
The USDCAD is continuing its two-day winning streak, propelled by a more robust USDX, bolstered by optimistic sentiments regarding the Federal Reserve (Fed) and anticipations of continued increases in interest rates. The USD was further strengthened by remarks made by Minneapolis Fed President Neel Kashkari on Tuesday, in which he alluded to potential rate hikes.
President Kashkari reportedly told Reuters that although interest rate stability is the most probable outcome for some time, rate hikes are not completely implausible.
In contrast, the strength of the USD had an impact on crude oil prices, which resulted in a depreciation of the Canadian Dollar (CAD) against the USD and consequently affected the USD/CAD pair. The significance of this correlation stems from Canada's position as the leading crude exporter to the United States.
As of press time, West Texas Intermediate (WTI) crude oil prices had extended losses for the second day. The current focus is on the US crude oil inventories change report, scheduled for release later on Wednesday. The report anticipates a decrease in the weekly quantity of crude oil and derivatives inventories, as predicted by the Energy Information Administration (EIA).
The CAD failed to gain traction even though Canada's April Ivey Purchasing Managers Index (PMI) data exceeded expectations. The PMI increased from 57.5 to 63.0, signifying the ninth consecutive monthly rise and a two-year high.
The Bank of Canada's (BoC) Financial System Review on Thursday is anticipated to impact future market fluctuations significantly. The overview offers an exhaustive evaluation of developments in the financial system and policy orientations in the financial sector.
Let's see the complete outlook of this currency pair from the USDCAD technical analysis:
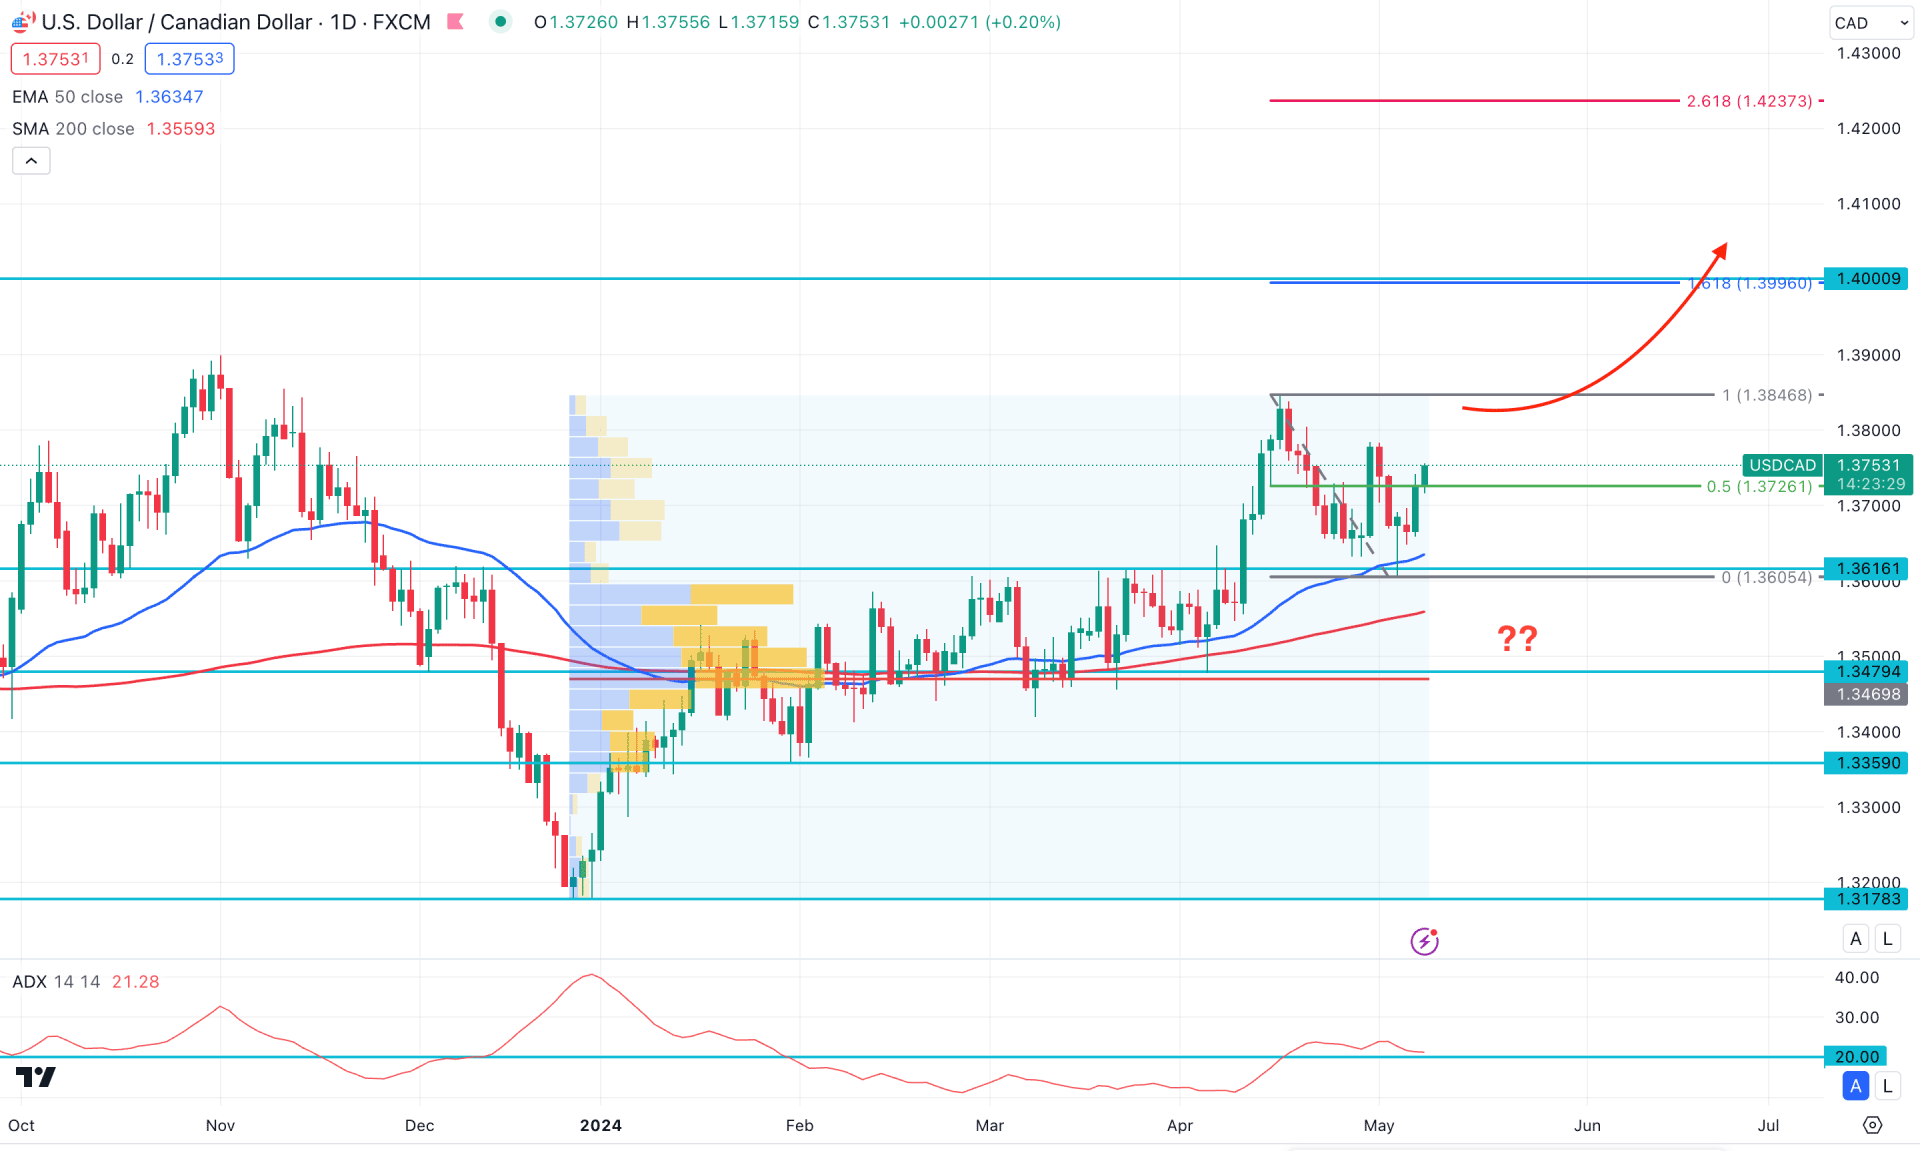
In the daily chart of USDCAD, a strong consolidation phase is over as the recent price shot higher above the 1.3616 level with a bullish daily candle formation.
In the volume structure, the buying pressure is supported as the most active level since December 2023 is at 1.3469 level, which is below the current price. The price has already shown a downside correction and formed a bullish reversal from the high volume level. In that case, the buying possibility is potent as long as it trades above the high volume line.
In the higher timeframe, the April 2024 close was bullish, supported by a bullish continuation signal. In that case, a new swing formation above the April 2024 high could be a probable long signal. However, the weekly price still trades below the critical resistance, which needs a solid push upward before validating the long opportunity.
In the daily chart, the 200-day Simple Moving Average level formed a bullish crossover from the pre-mentioned high volume level, suggesting a confluence to bulls. Moreover, the 50 day Exponential Moving Average is below the current price with a bullish slope, suggesting a Golden Cross continuation opportunity.
In the indicator window, the Average Directional Index (ADX) is above the 20.00 line despite the recent downside pressure in the main chart. The 14-day RSI also reached the 50.00 neutral point and formed a bullish reversal, increasing the possibility to reach the 70.00 to 80.00 zone.
Based on the daily market outlook of USDCAD, the most recent bullish rejection candlestick from the 1.3616 support showed a bearish liquidity sweep, suggesting a bullish continuation opportunity. The ideal buying approach is to find a bullish reversal from the 50-day EMA before targeting the 1.4000 Fibonacci Extension level.
On the other hand, downside pressure within the previous range is possible, but the long opportunity is valid as long as the price trades above the 200-day SMA level. A steep selling pressure with a daily candle below the 1.3470 level might alter the current market structure and lower the price in the coming days.
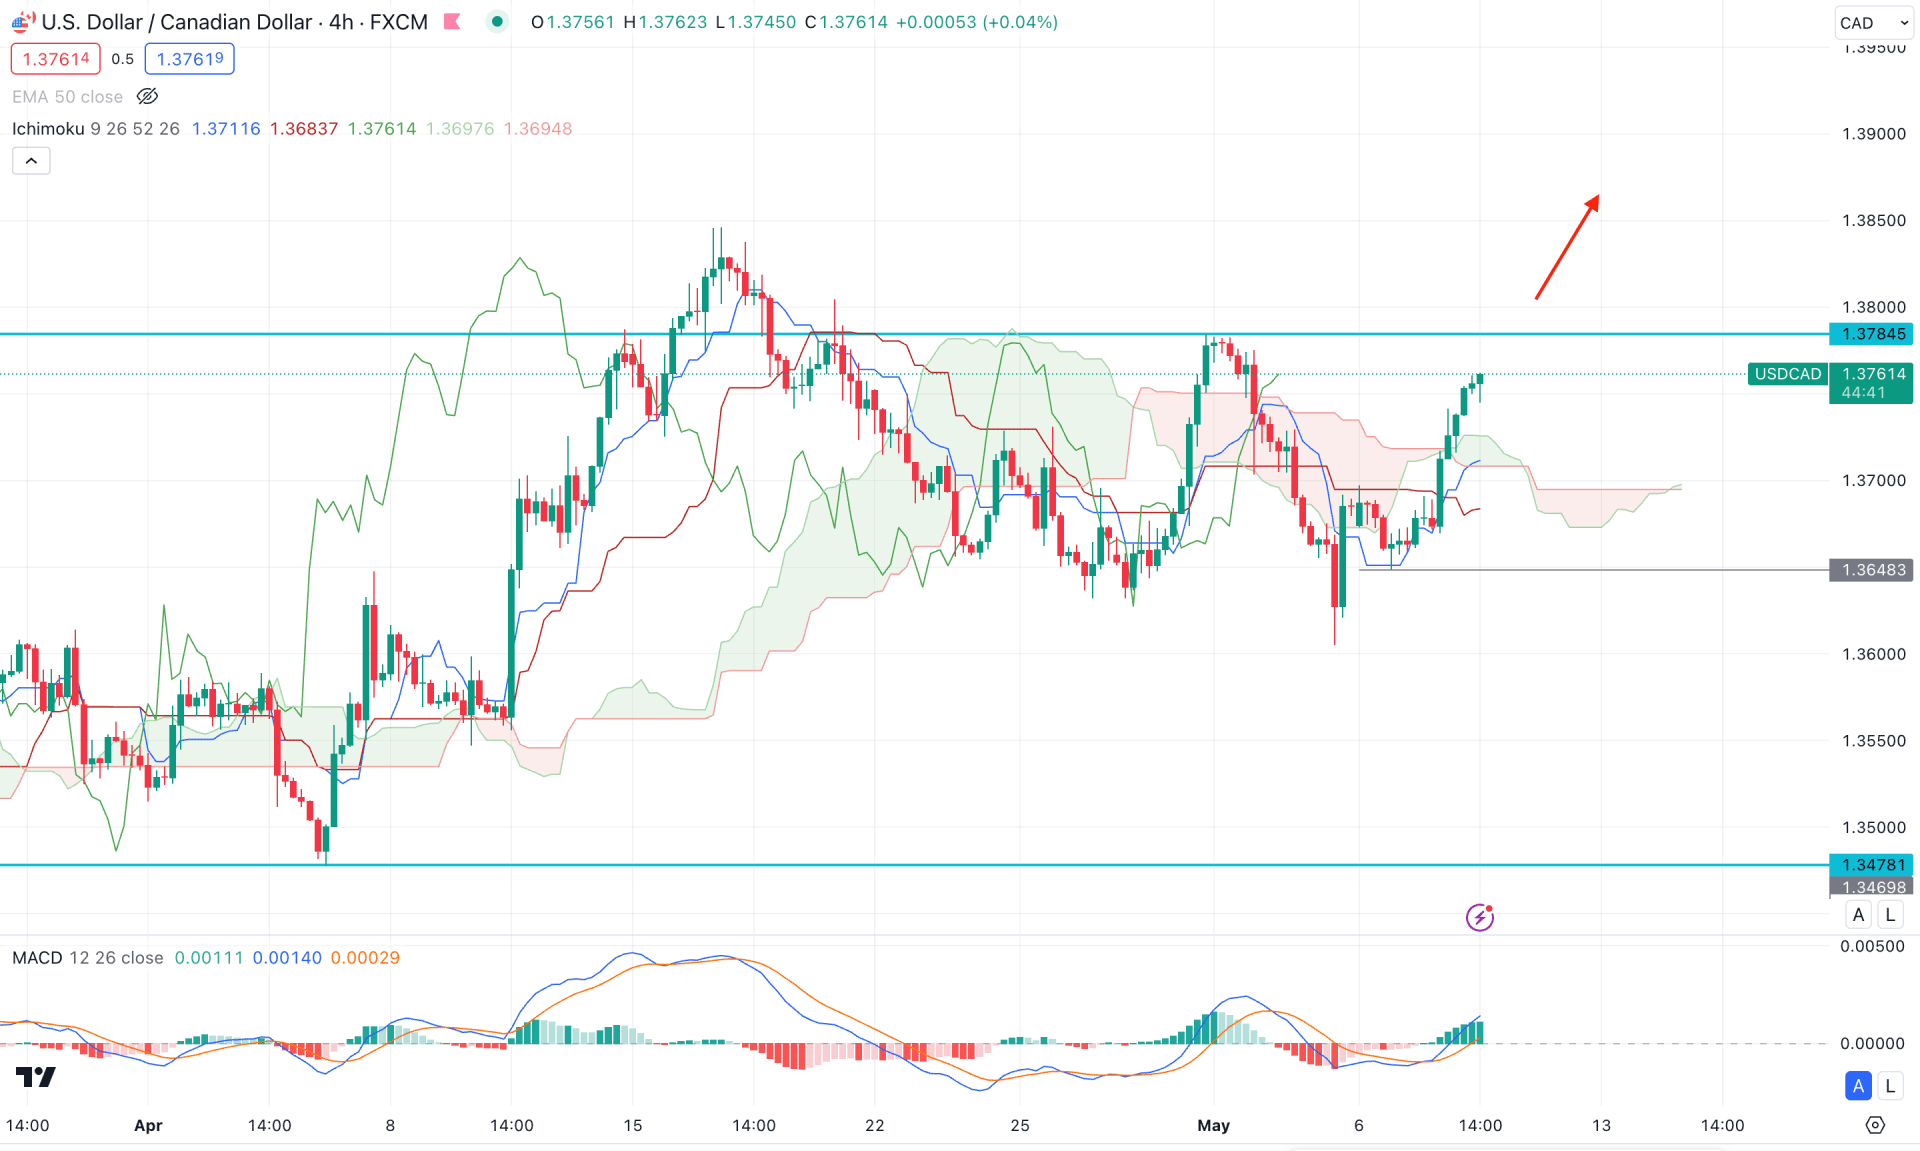
In the H4 timeframe, the overall market momentum is bullish as the most recent price trades above the dynamic Ichimoku Cloud zone. Moreover, the Senkou Span A moved higher and reached the Senkou Span B level, suggesting a potential buying pressure in the current price.
In the indicator window, the upward direction is visible in the MACD Histogram level, while the signal line shows a bullish crossover at the neutral point. A bullish crossover is visible in the dynamic Tenken Sen and Kijun Sen line, suggesting a confluence to the buying pressure.
Following the daily market trend, the H4 bullish pressure with an H4 close above the 1.3784 level could be a potential long opportunity, where the main aim would be to test the 1.3950 level in the coming hours.
On the other hand, the buying pressure is visible as long as the price hovers above the 1.3648 support level. A bearish pressure below the Cloud area with an H4 candle below the 1.3640 level might extend the downside pressure towards the 1.3500 area.
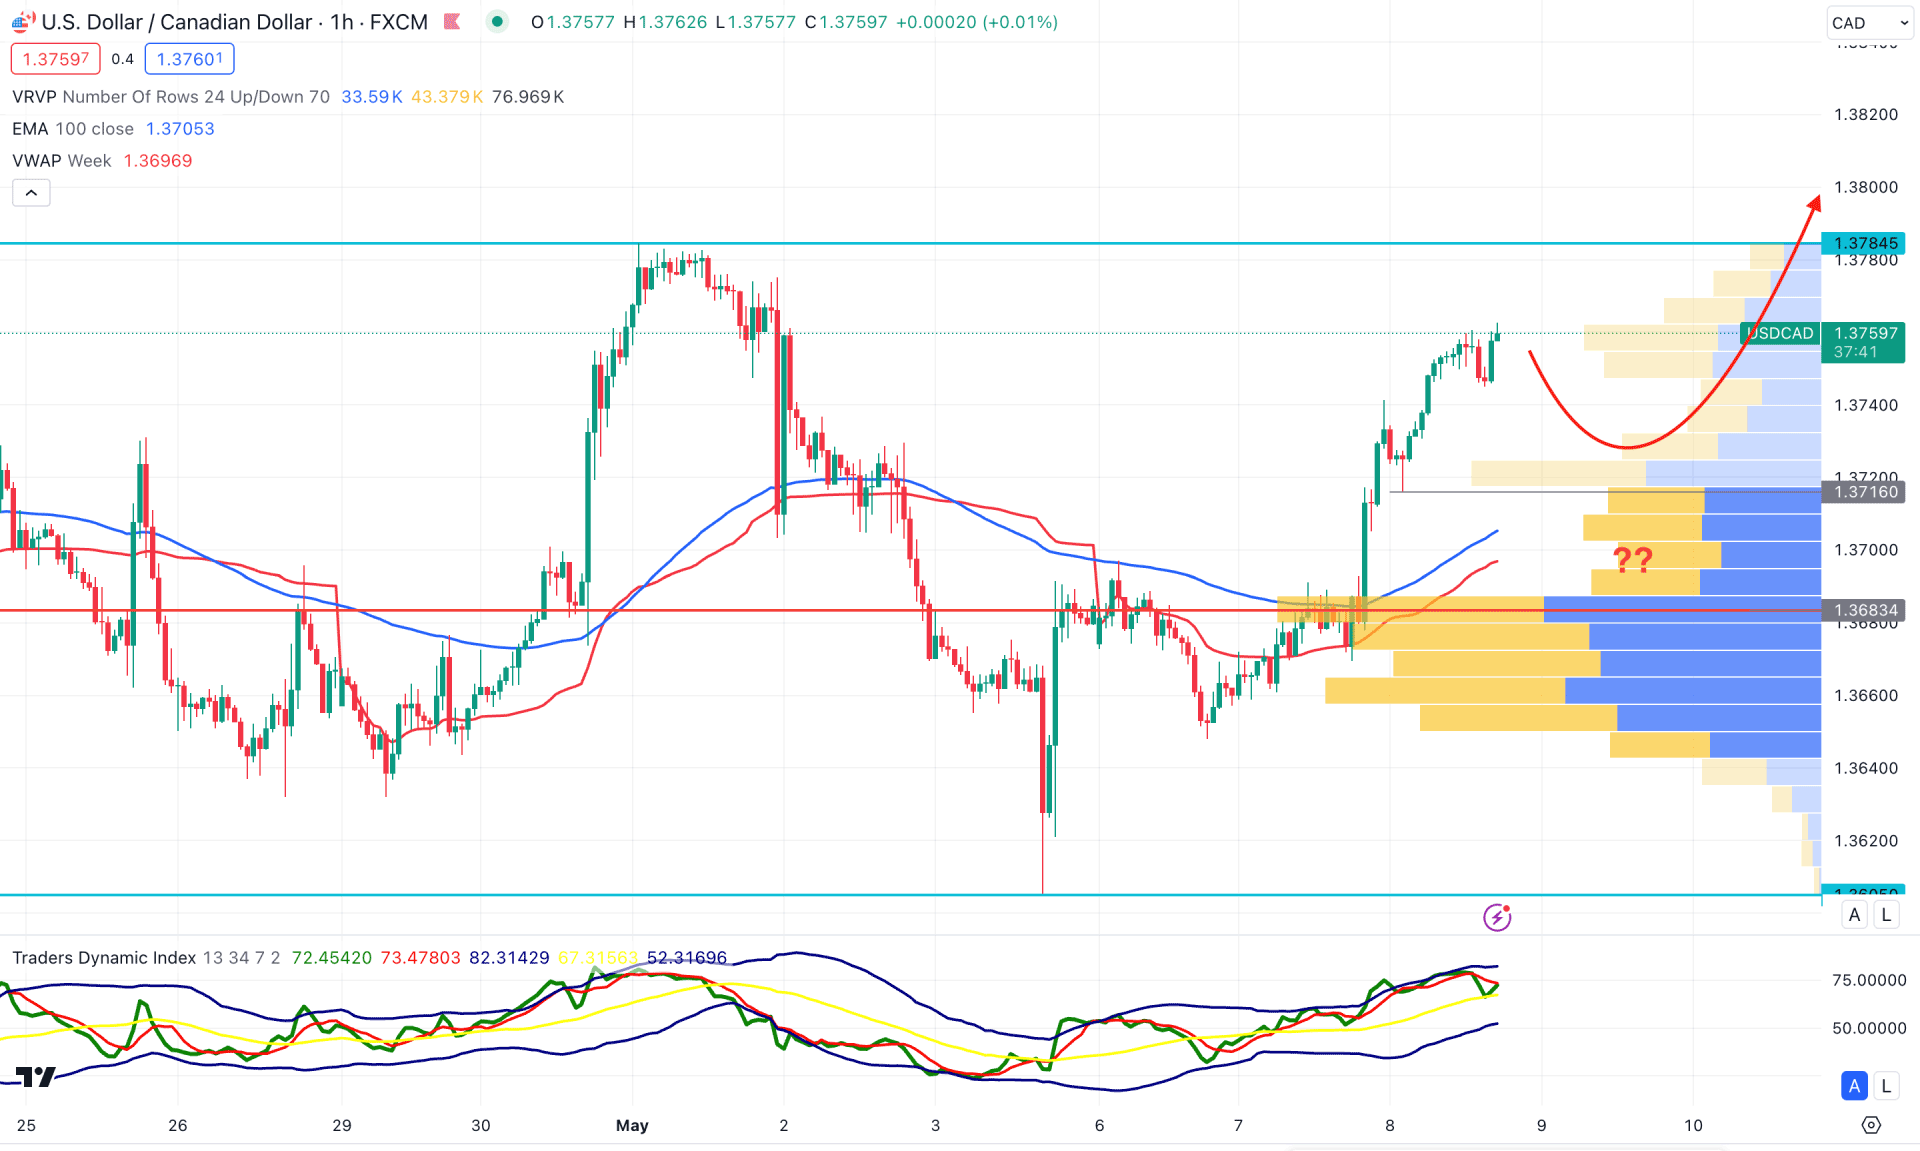
In the hourly time frame, the ongoing buying pressure is potent above the visible range high volume level. Moreover, the 100 Exponential Moving Average is below the current price, working as a support with the VWAP line.
The indicator window shows the same outlook, where the current TDI level hovers above the midline, suggesting an ongoing buying pressure.
Despite the current bullish outlook, a considerable downside correction is pending the main chart as a mean reversion to the dynamic 50 EMA level. An immediate downside pressure with a bullish reversal from the 1.3700 to 1.3680 zone could be a potential bullish trend continuation signal.
On the other hand, a bullish continuation with massive rejection from the 1.3784 resistance level could increase the possibility of reaching the 1.3683 high volume level.
Based on the current market outlook of USDCAD, a high probable bullish opportunity is present as the recent daily price showed a sell-side liquidity sweep after a valid range breakout. Investors should closely monitor how the price trades in the intraday chart, where a downside correction is still pending.


