
Published: February 11th, 2025
The USDCAD traded at about 1.4330, continuing its advances for the second day in a row. When the US president sharply raised import duties on aluminium and steel to a mere 25% on Monday, without modifications or exemptions, the pair gained value due to rising trade tensions. The action increases the possibility of a multifront trade dispute while attempting to assist faltering domestic businesses.
In addition to removing quota agreements, national exemptions, and hundreds of thousands of specific-to-product tariff exemptions for both metals, Trump issued proclamations that increased the nation's aluminium tariff percentage from 10% to 25%. According to a White House official, additional action on microchips and automobiles is being considered in the upcoming weeks, and the new regulations will go into force on March 4.
In 2024, almost 80% of the US's principal aluminium imports were from Canada. About 23% of the steel consumed in the United States in 2023 came from imports, with Mexico, Brazil, and Canada being the main suppliers.
The United States Dollar Index (DXY), which compares the value of the US dollar to six major currencies, has continued to advance for the fourth straight session and is currently trading close to 108.50. After Friday's release of the January jobs data, which showed a decrease in unemployment but slower job creation, the Federal Reserve of the United States is now projected to maintain interest rates at their current level this year, which supports the greenback.
Let's see the further outlook from the USDCAD technical analysis:
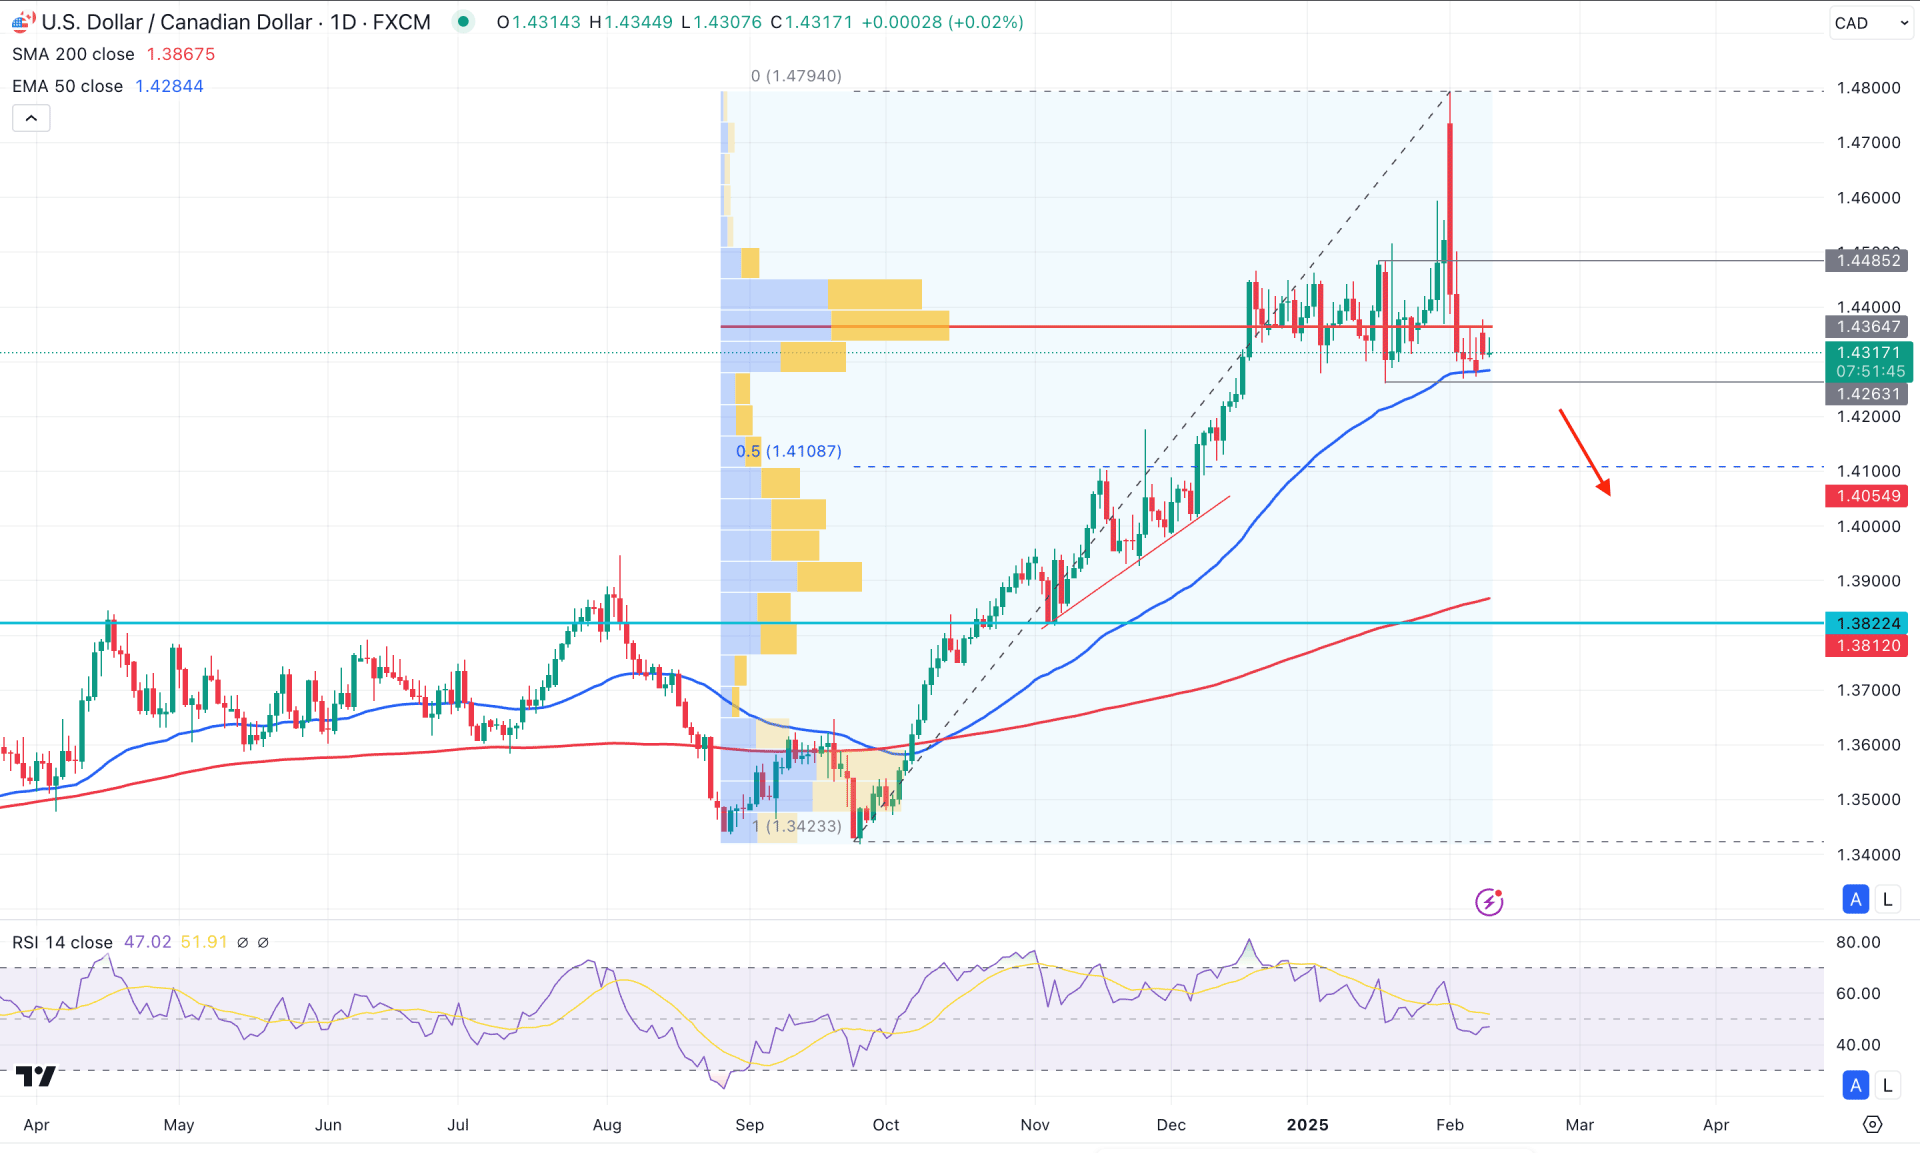
The daily chart of CADUSD shows that the recent price moved above the multi-year high and shows strong bullish exhaustion. This is a sign that bulls are done with their momentum, and sufficient liquidity has been grabbed from the high yearly price.
Another sign of exhaustion came from the volume structure. The most active level since September 2024 has moved above the current price. It is a sign that the most recent selling pressure from the yearly high area came with a larger institutional flow. However, a perfect combination of the price section and volume needs potential validation from a range breakout.
Looking at the price structure, the record price of 1.4797 is not yet validated as a solid top. As the current price is hovering above the 1.4263 double-top pattern, it is still in the buyers' zone. Moreover, the 50-day Exponential Moving Average is acting as immediate support. Also, the 200-day SMA is below the recent price with a wider gap, suggesting an open space below the near-term support area.
The current Relative Strength Index (RSI) remains sideways at the 50.00 neutral line in the indicator window. However, the existing momentum shows a bullish exhaustion from the overbought 70.00 line. In that case, a downside recovery below the 50.00 area could be a positive signal for bears in this pair.
Based on this outlook, investors should closely monitor how the price trades at the 1.4263 low, as valid selling pressure below this line could be a bearish opportunity. On the bearish side, the downside continuation is likely to test the 1.4108 level, which is a crucial Fibonacci Retracement point. Below this line, the 200-day SMA could be a strong barrier before heading towards the 1.3600 level.
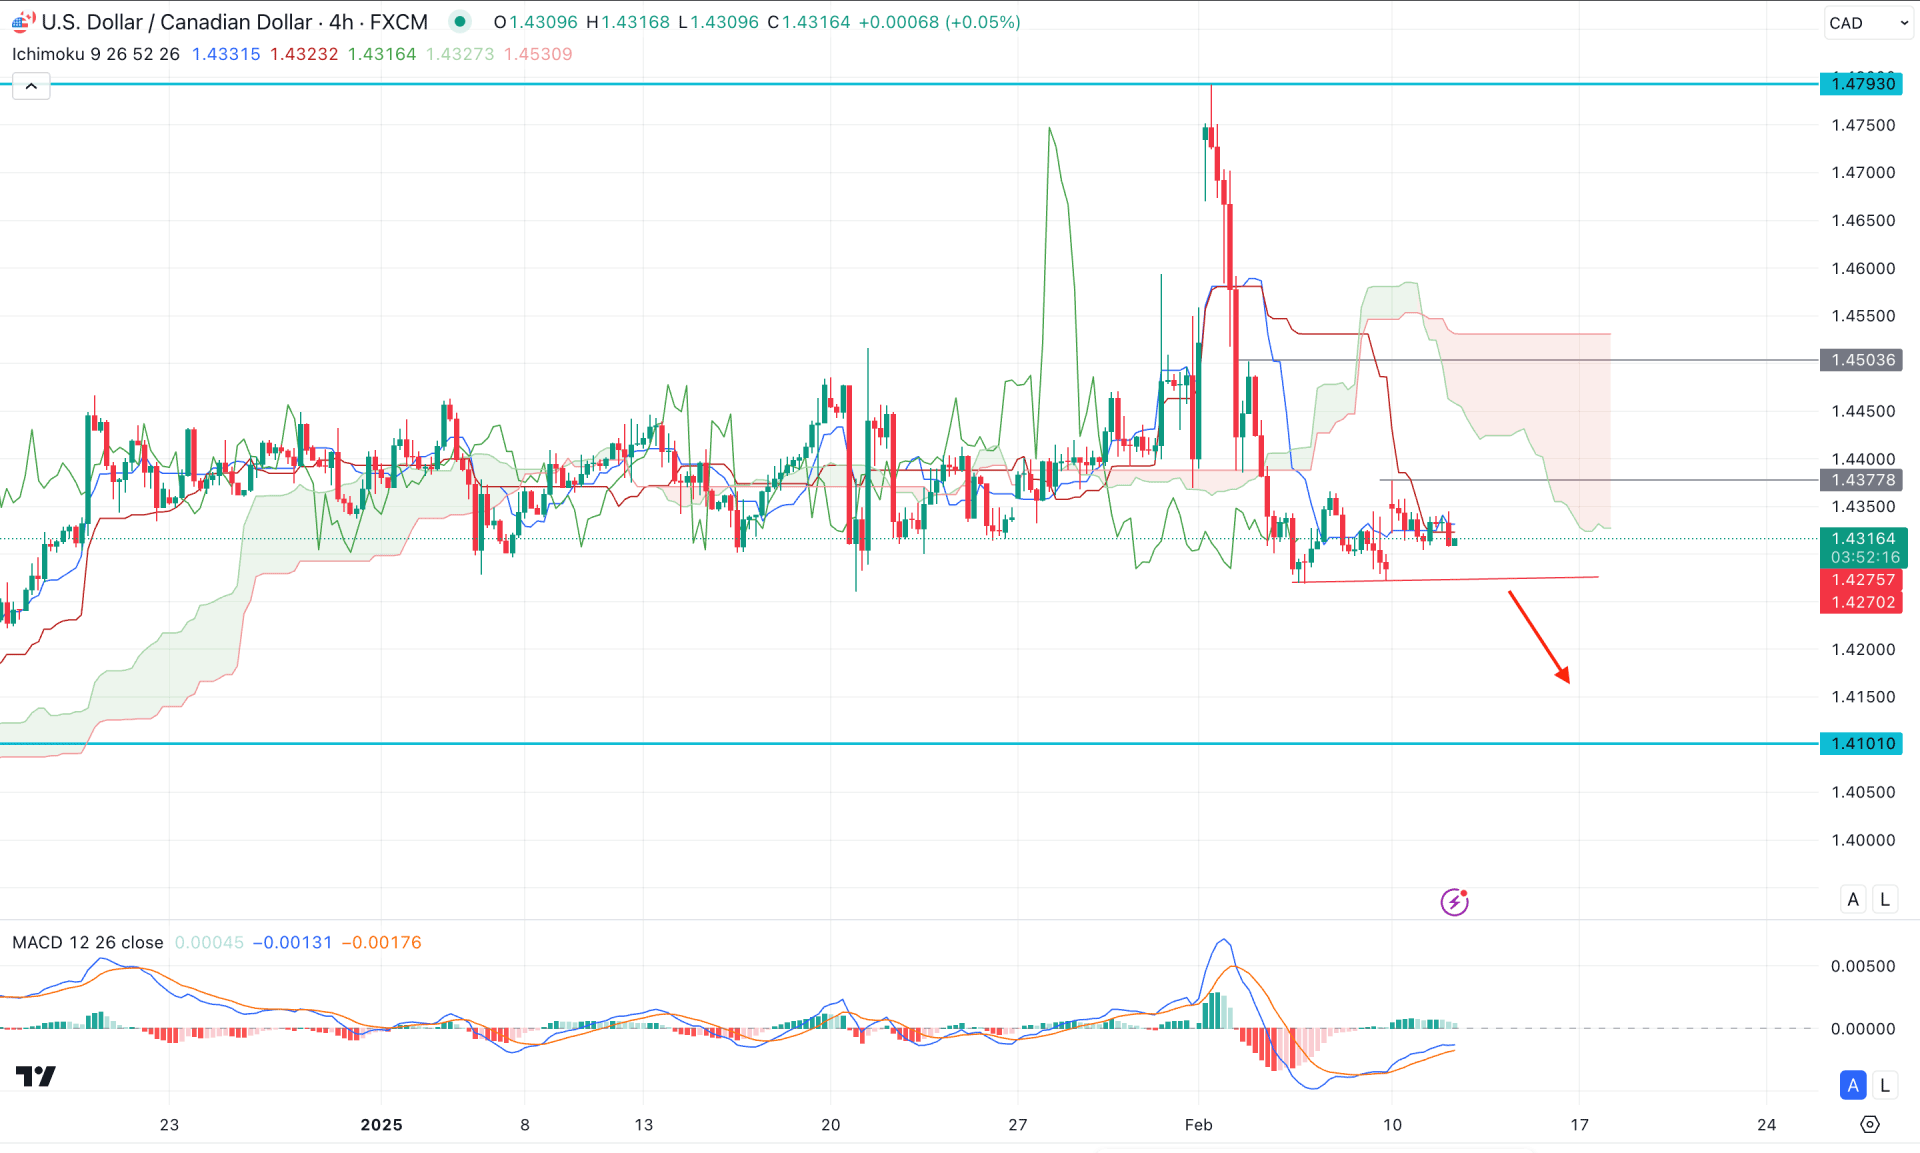
In the H4 timeframe, the recent price shows an immediate recovery below the Ichimoku cloud low. Moreover, the price is holding the momentum below the cloud instead of making any immediate reversal. It is a sign that sellers are still in the market and likely to take the price even lower.
In the other indicator window, the dynamic levels align with the current price and work as a resistance. Moreover, the Future Cloud looks bearish as the Senkou Span A is below the Senkou Span B with a bearish slope.
Based on this structure, investors might expect a downside continuation once it is validated from the range breakout. A valid H4 candle below the 1.4260 level could be a high probable short opportunity towards the 1.4100 level.
On the other hand, depending on the price action, the price is likely to correct higher and form another short opportunity from the 1.4400 to 1.4485 area.
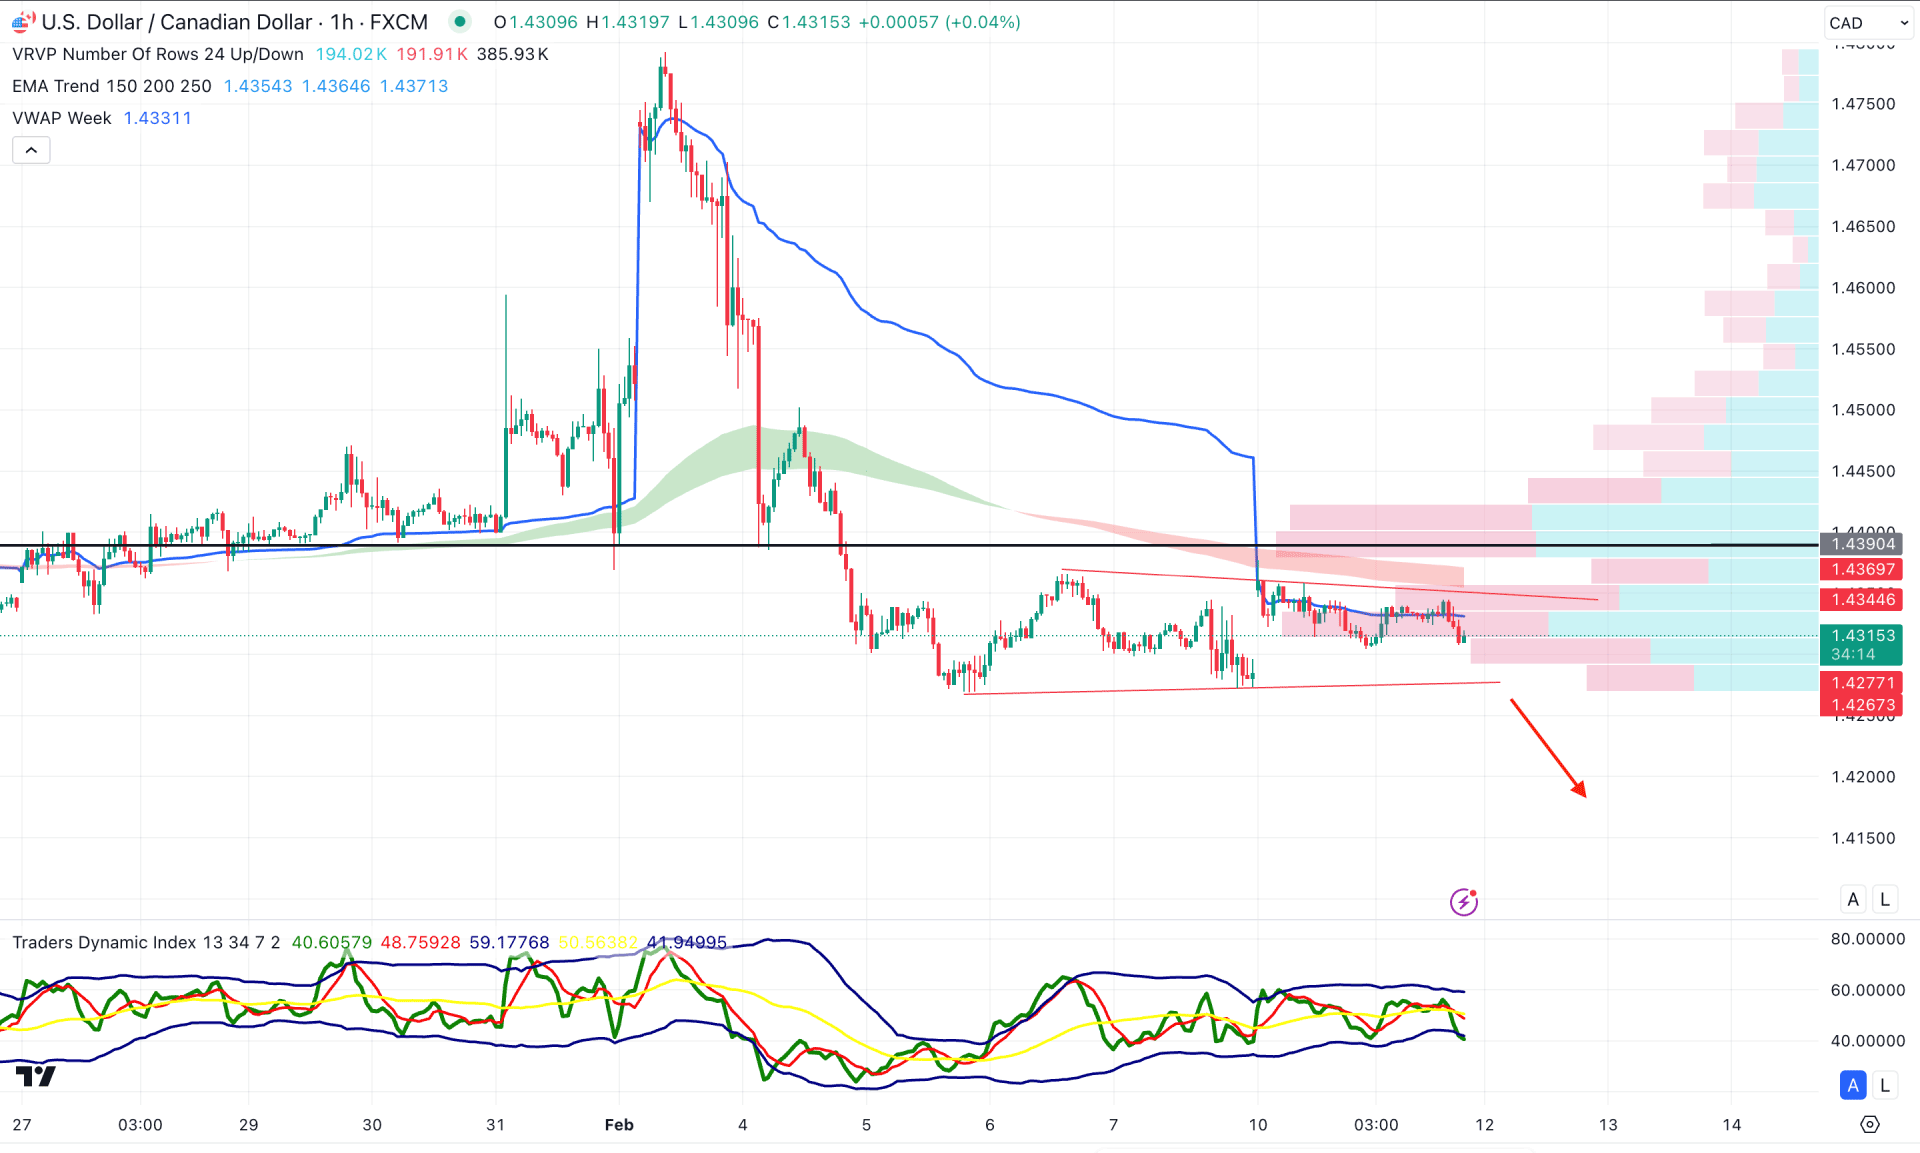
In the hourly timeframe, the current price hovers below the intraday high volume line, suggesting an ongoing bearish pressure. Moreover, the Moving Average wave works as a resistance, a confluence selling pressure.
Based on this outlook, the bearish momentum is active as long as the high volume line remains above the current price. In that case, the price will likely extend the downside pressure and move below the 1.4100 level in the coming hours.
Based on this structure, a downside continuation is likely to appear in the USDCAD price, signalling an intraday trading opportunity. Investors should monitor how prices form a selling pressure from lower timeframe supply zones before joining the major bearish rally.


