
Published: February 21st, 2023
The WTI crude oil has declined by nearly 1.0% today, hitting its intraday low near $76.60. This drop reverses the previous day's corrective rebound from a two-week low.
It's worth noting that the US Dollar Index (DXY) has ended its two-day losing streak, showing slight gains near 104.00. The greenback's performance against the six major currencies is linked to the US Treasury bond yields and the traditional safe-haven status.
The Canadian Consumer Price Index (CPI) for January and the Core CPI for the same month will be closely watched for immediate market direction. The BoC has hinted at a pause in the rates, so lower inflation readings may prompt a policy shift, pushing the USD/CAD higher.
Meanwhile, preliminary US Purchasing Managers Index (PMI) data for February will be crucial for the US Dollar ahead of Wednesday's Federal Open Market Committee's (FOMC) Monetary Policy Meeting Minutes.
Given the Federal Reserve's recent hawkish stance versus the Bank of Canada's dovish tone, the USD/CAD will likely experience further gains unless there's a strong surge in oil prices.
Should you trade the USDCAD now? Let’s see the future price direction from the USDCAD technical analysis.
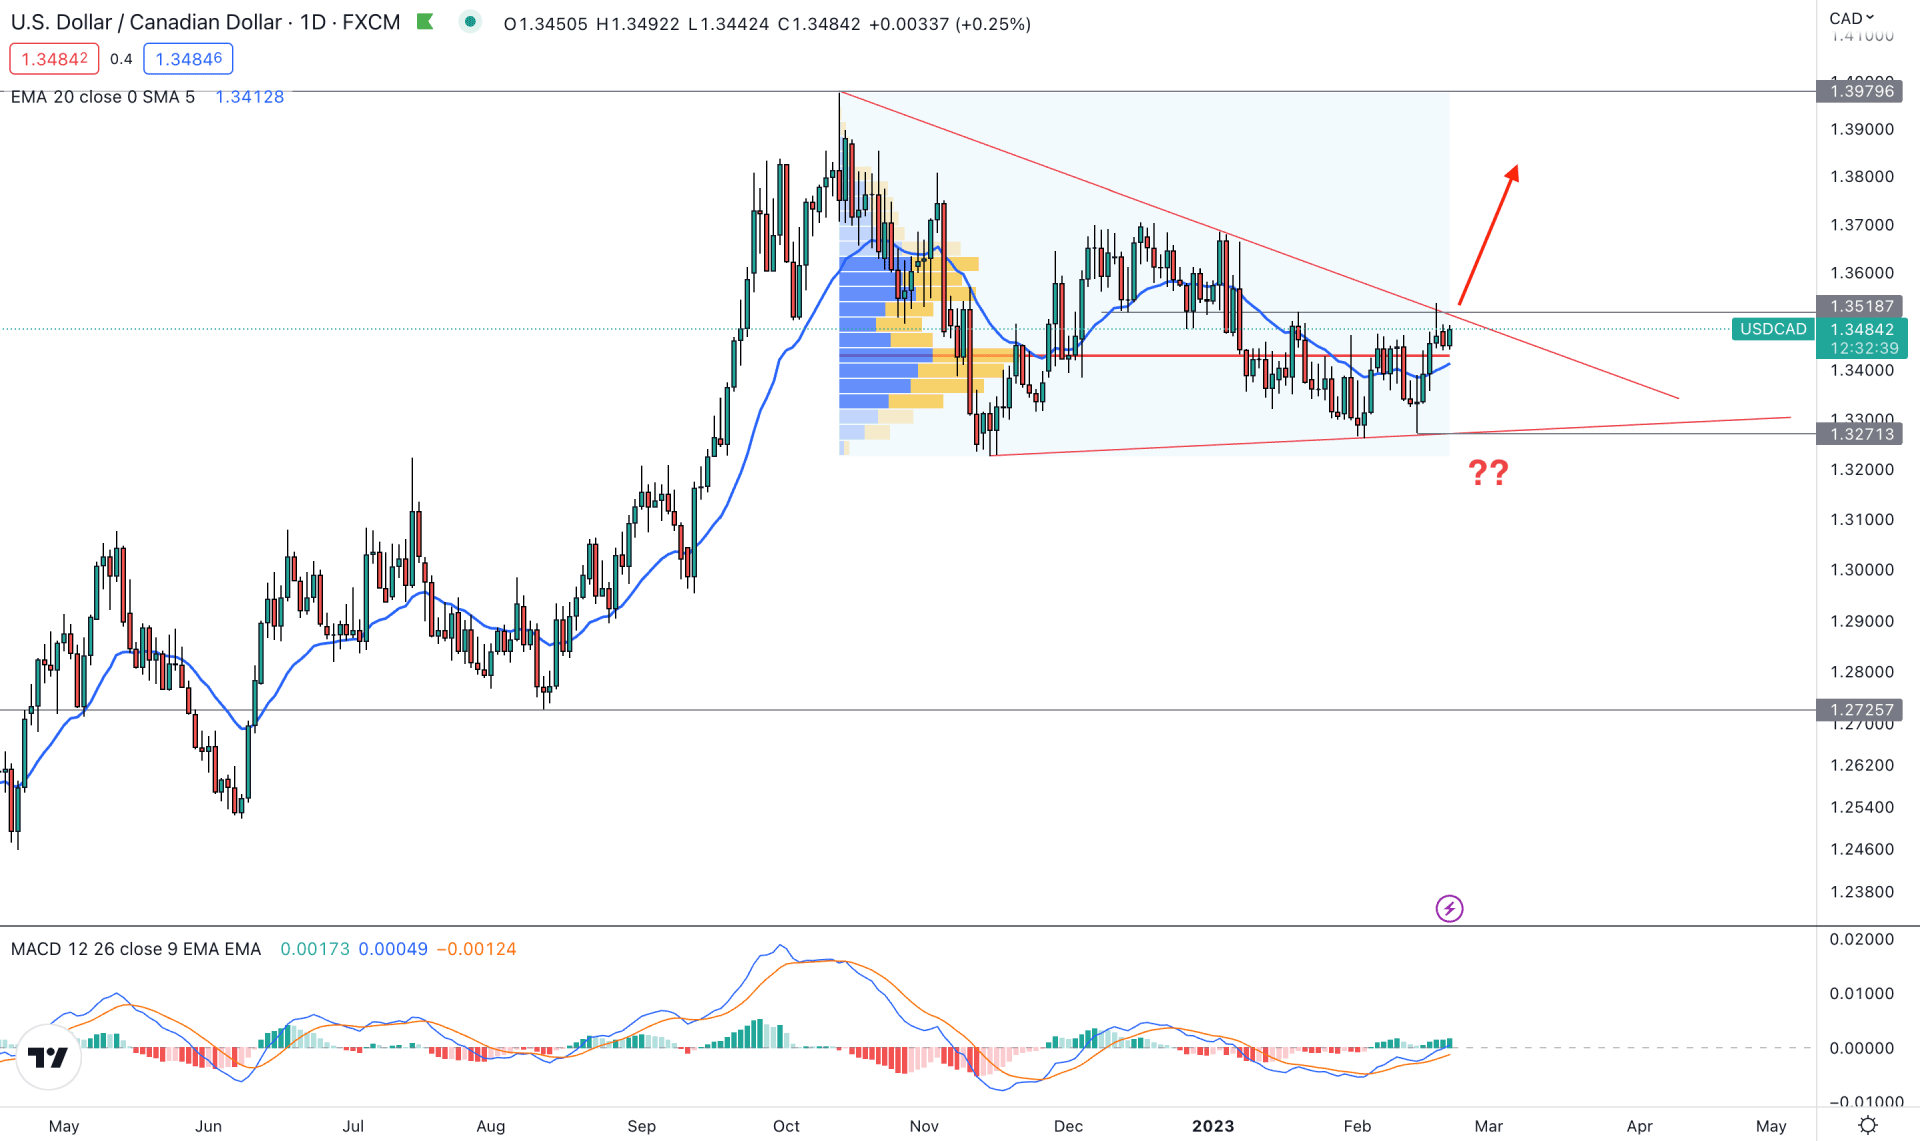
In the daily chart, the broader outlook of USDCAD is bullish as the current price is aiming higher for a considerable time. In that case, any bullish trend continuation opportunity is more likely to provide profitable investment opportunity in this pair.
After setting a strong swing high at October 2022, USDCAD went sideways with a bearish pressure. However, there is no sufficient counter-impulsive movement was seen on the sellers side. As a result, in indecisive momentum has appeared, which is visible by a triangle formation. The price is squeezing to a point from where a strong breakout could create a fresh trend.
As of now, the current price is supported by bulls as the latest high volume level from October to February is below the current price. In that case, any bullish triangle breakout will likely provide a profitable buying opportunity.
In the price chart, the dynamic 20 EMA is below the current price and aimed higher, which is a sign of a strong buying possibility. However, the price is still trading below the 1.3848 key resistance level, and a bullish break above this area is needed to form a buying momentum.
The MACD Histogram is stable above the neutral line in the indicator window, while MACD EMA’s ae pushing higher.
Based on the current price structure, USDCAD has a higher possibility of extending the bullish momentum in the coming days. In that case, a stable price above the 1.3848 level with a daily close could open a long opportunity, targeting the 1.3979 resistance level.
The buying possibility is valid as long as the price trades above the 1.3271 support level. A break below the 1.3200 level with the daily candle close could validate the descending triangle breakout with the possibility of reaching towards the 1.2800 psychological level.
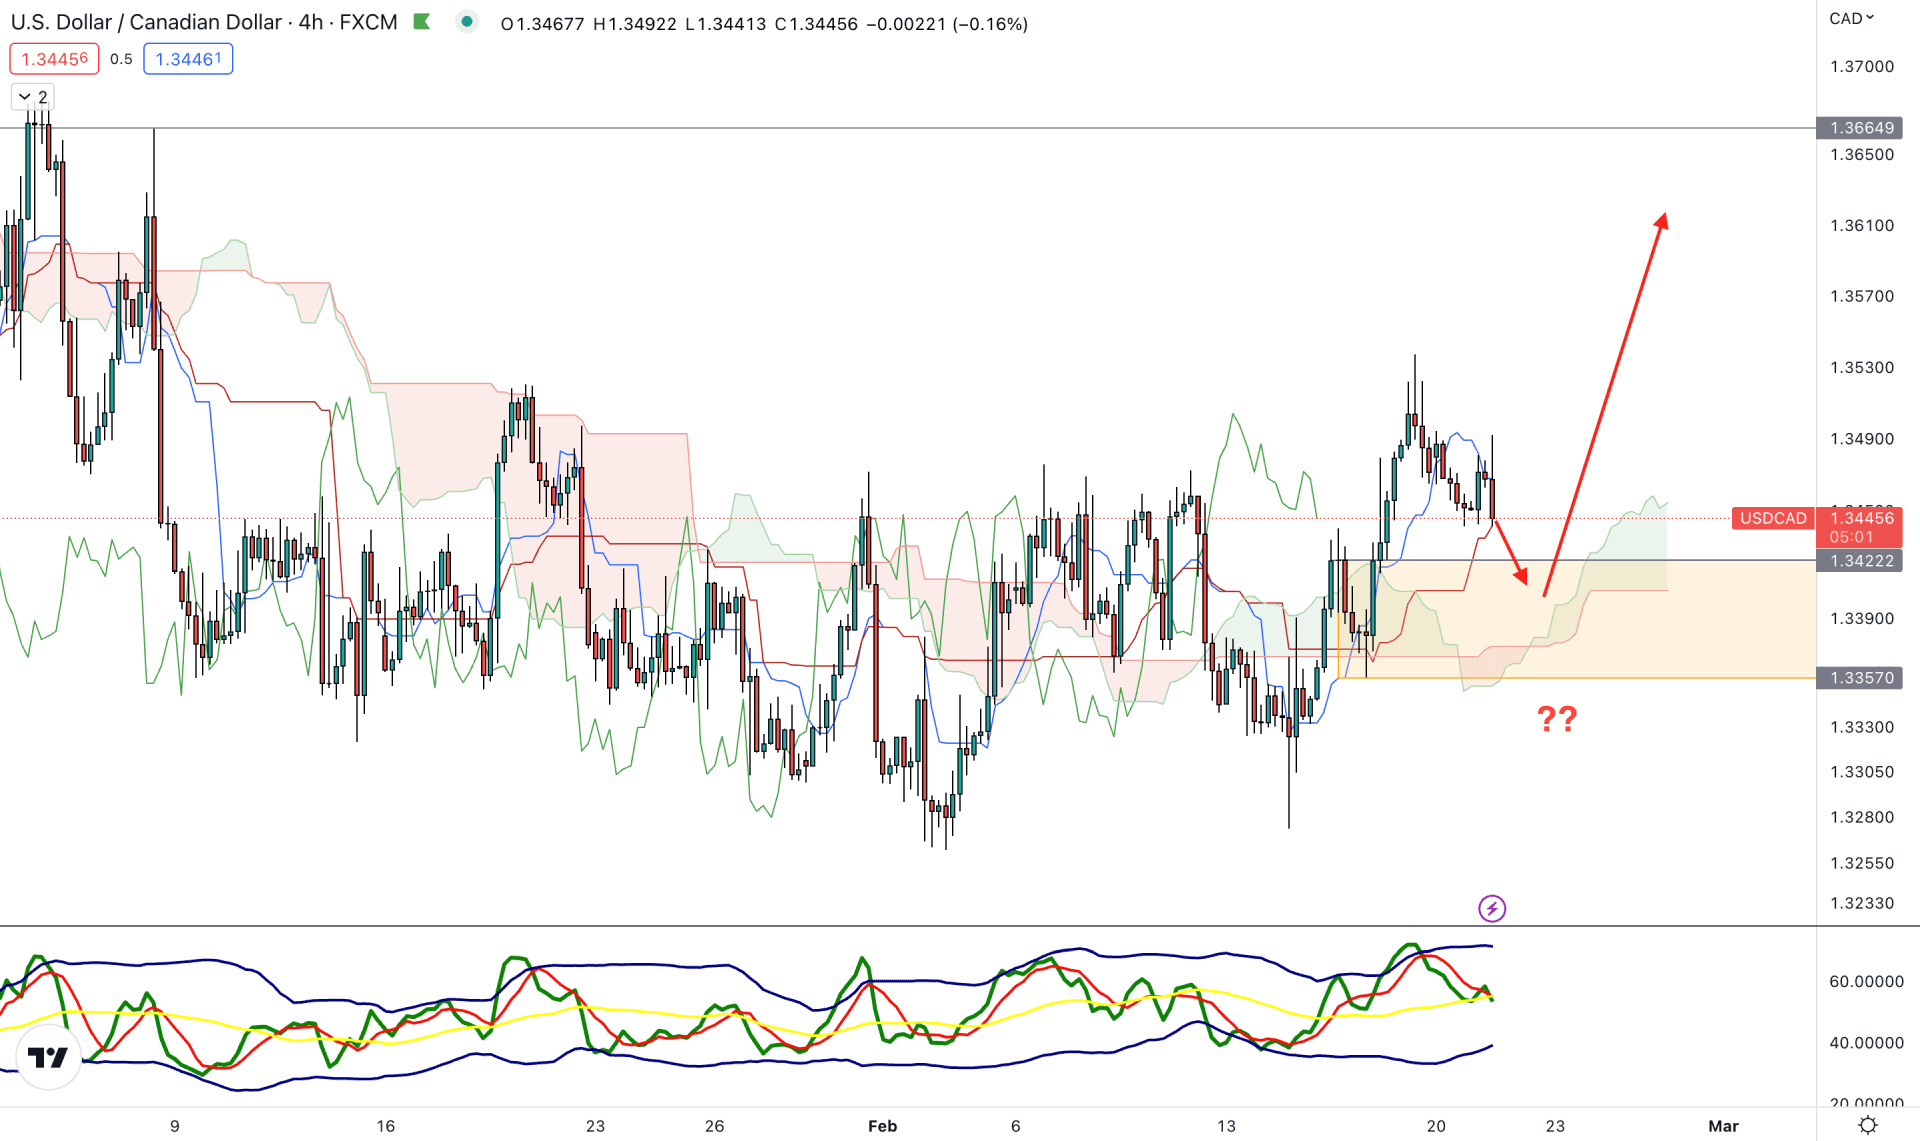
In the H4 chart, the current market outlook is extremely corrective, as multiple violations above the Kumau cloud zone is visible.
The latest chart shows a bullish break from the cloud support with a new swing high formation. Later on, the price started to move down but still trading above the 1.3422 to 1.3357 demand zone. In that case, any bullish rejection from the demand zone with a valid break out could offer a continuation trading opportunity.
In the indicator window, the current Traders Dynamic Index (TDI) is moving down from the upper band, which is a sign of a possible bearish pressure in the coming days.
Based on this structure, a bearish correction is pending in the USDCAD price. However, any bullish rejection from the demand zone or dynamic Kijun Sen could increase the price at any time.
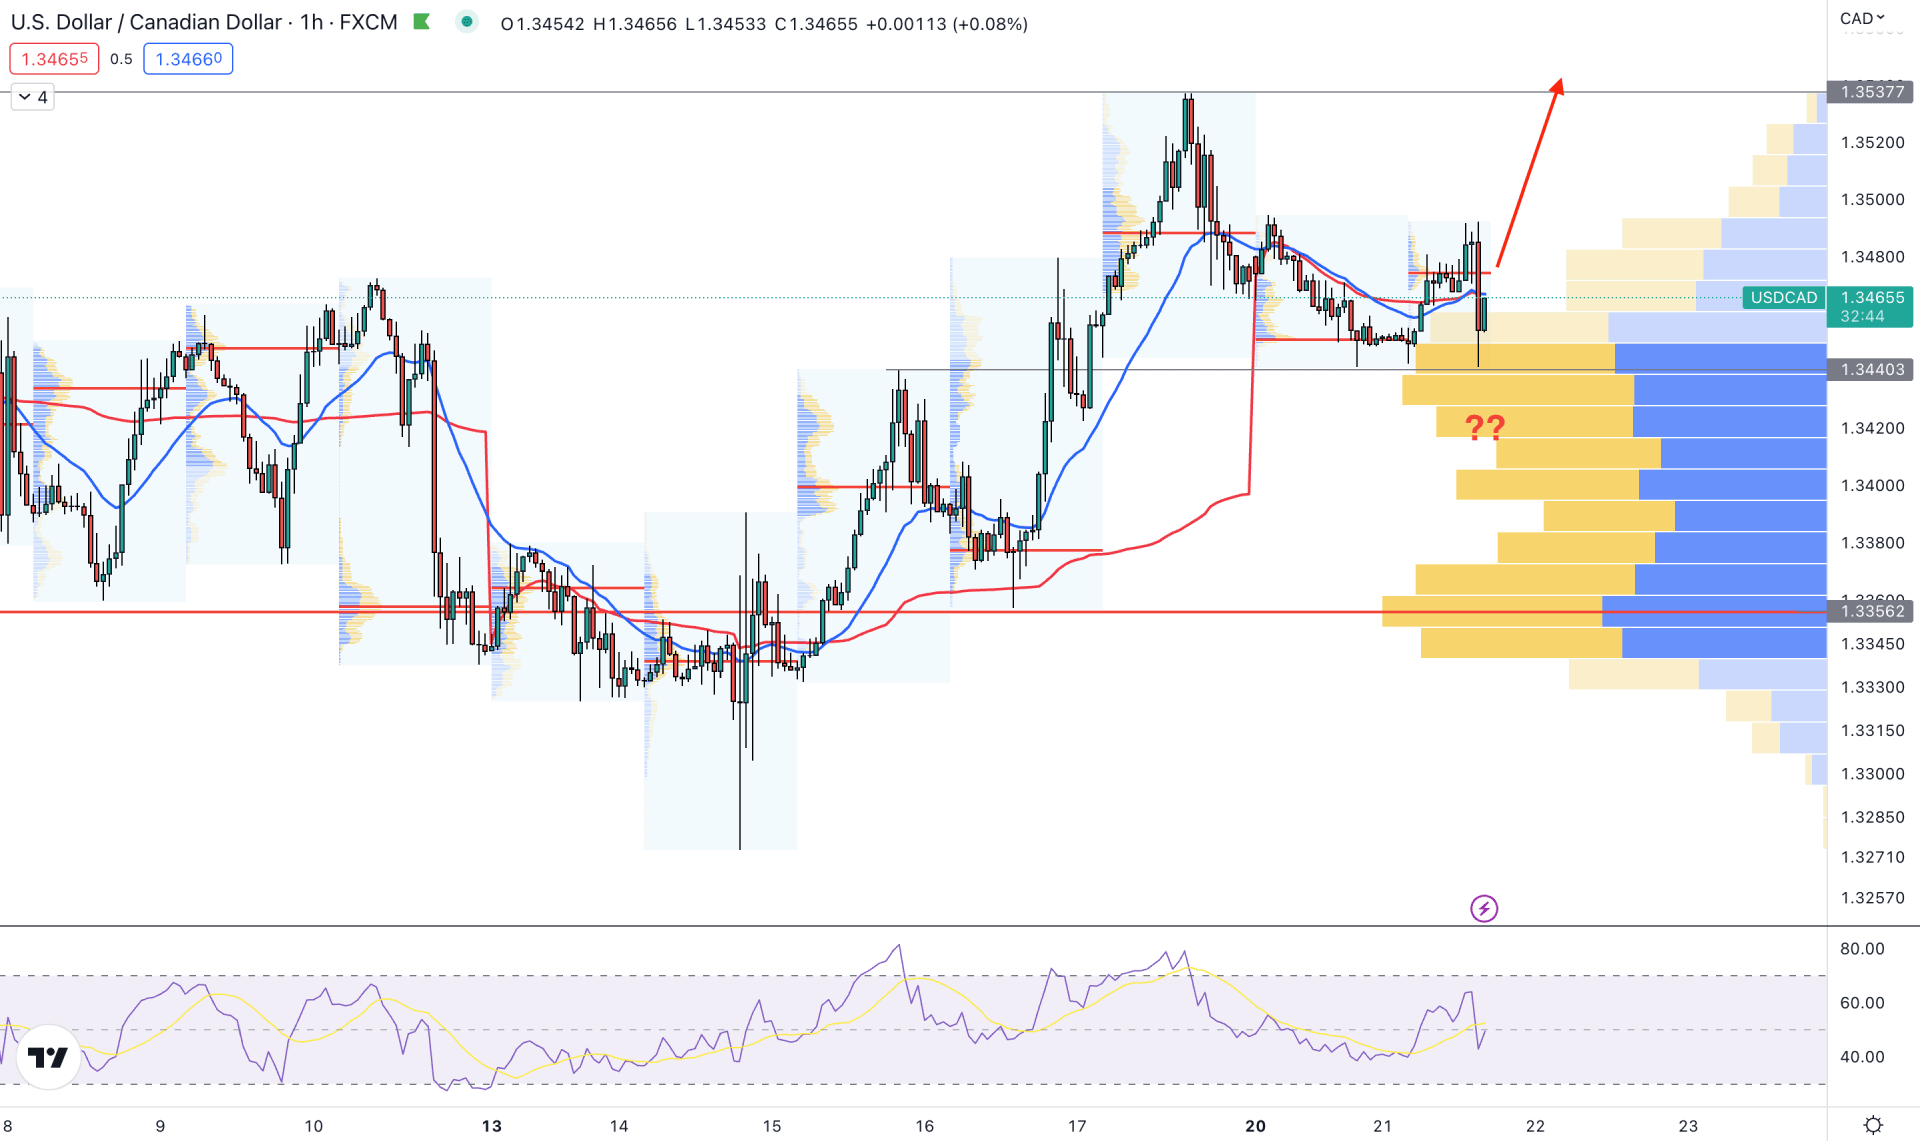
In the hourly chart, USDCAD is trading above the visible range high volume level, where the near-term support level is spotted at 1.3440 level. Moreover, the dynamic 20 EMA and weekly VWAP are below the price.
The Relative Strength Index (RSI) moved below th 50% level, while the latest intraday high volume level is above the current price.
Based on this structure, a downside moevement is possible in the USDCAD chart, where a bearish H1 candle below the 1.3440 level could lower the price towards the 1.3400 area.
On the other hand, an immediate recovery with a H4 candle close above the 1.3480 is needed to invalidate the downside possibility.
Based on the USDCAD multi-timeframe analysis, the buyin possibility is still on a early stage. Investors should wait for a valid breakout from the near-term resistance level to joining the long-term bullish trend.


