
Published: April 20th, 2023
During early Thursday morning, USDCAD approaches around 1.3500 psychological numbers, a rising trend. This is due to the Loonie pair defending its previous day's gains, resulting in a weekly high as cautious investors await key Canadian economic catalysts.
The rise came from the decline in crude prices and the rush towards safer investments. In the meantime, the price of WTI Crude has fallen for four days and reached below the 2 -week low of $78.30. This decline was influenced by the fear of economic recession, exacerbated by major central banks' increased interest rates.
In the US Dollar Index, a benefit came from the risk-off sentiment. John Williams, president of the Federal Reserve Bank of New York, recently expressed support for a 0.25 percentage point increase in interest rates in May. As a result, market participants are placing nearly 85% of their wagers on a 25 bps rate hike by the Fed, reducing the possibility of rate cut in 2023.
On the other hand, concerns about a potential conflict between China and the West, bolstered by allegations of Beijing's support for Russia are weighing on market sentiment. In addition, Canada's disappointing Housing Starts, Industrial Product Price, and Raw Material Price reports and the Fed's optimistic Beige Book statements provide additional catalysts for the Loonie pair.
Based on the current market sentiment and falling crude prices, it is possible that the USDCAD currency pair will remain strong. However, comments from Bank of Canada (BoC) Governor Tiff Macklem and Deputy Governor Carolyn Rogers will be crucial. In addition, secondary US data, such as Weekly Initial Jobless Claims, the Philadelphia Fed Manufacturing Survey, and Existing Home Sales, will be emphasized.
Let’s see the upcoming price direction from the USDCAD technical analysis:
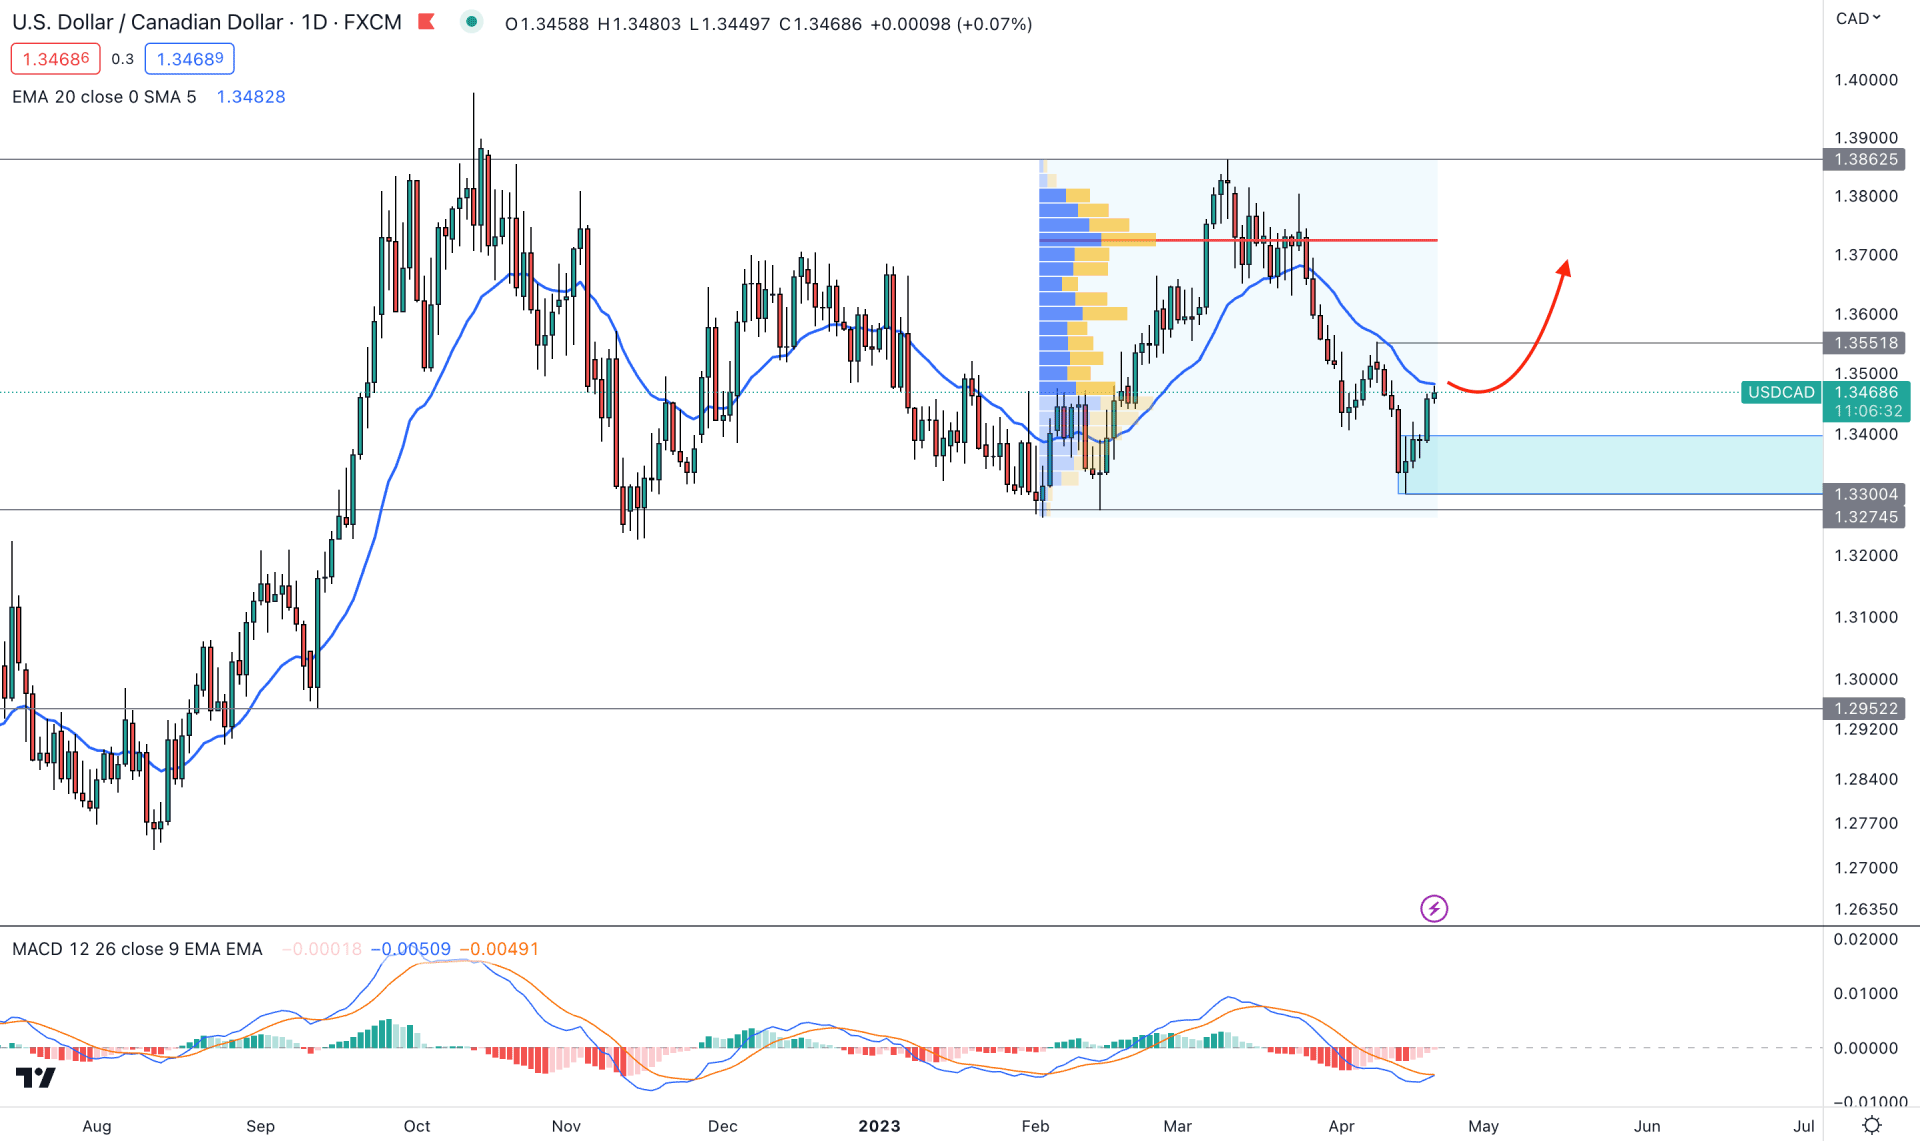
On February 2023, USDCAD closed a strong bullish month with an engulfing price pattern, eliminating the selling pressure in January. Later on, the price trades within the February candle in March and April. As bears failed to breach February 2023 low, the primary outlook of this instrument would be bullish.
Coming to the daily chart- the current price is trading sideways within the 1.3862 high to 1.3274 low. As the current price is trading at the lower band of the range, we may expect bulls to take control of the price.
In the current tradable range, 1.3551 would be a crucial level to look at as a break of structure from this swing high would validate the 1.3300 to 1.3396 as a valid demand zone. On the downside, no significant sell-side liquidity sweep is seen. Also, an emerging trendline from the 15 November low to the 14 April low could have a lot of buy orders below it.
In the main chart, the price is facing a minor resistance from the dynamic 20 EMA, while the current MACD EMA is below the neutral line with a bullish crossover.
Based on this structure, bulls should wait for a daily candle close above the 20-day EMA with a bullish MACD Histogram before opening a long position. Moreover, the conservatory buying approach is to wait for a valid break above the 1.3551 level before opening any long position. In both cases, the ultimate target is to test the 1.3862 level, which is 394 pips above the current price.
On the other hand, a break below the 1.3274 level with a bearish D1 candle could eliminate the bullish possibility and lower the price toward the 1.2950 area.
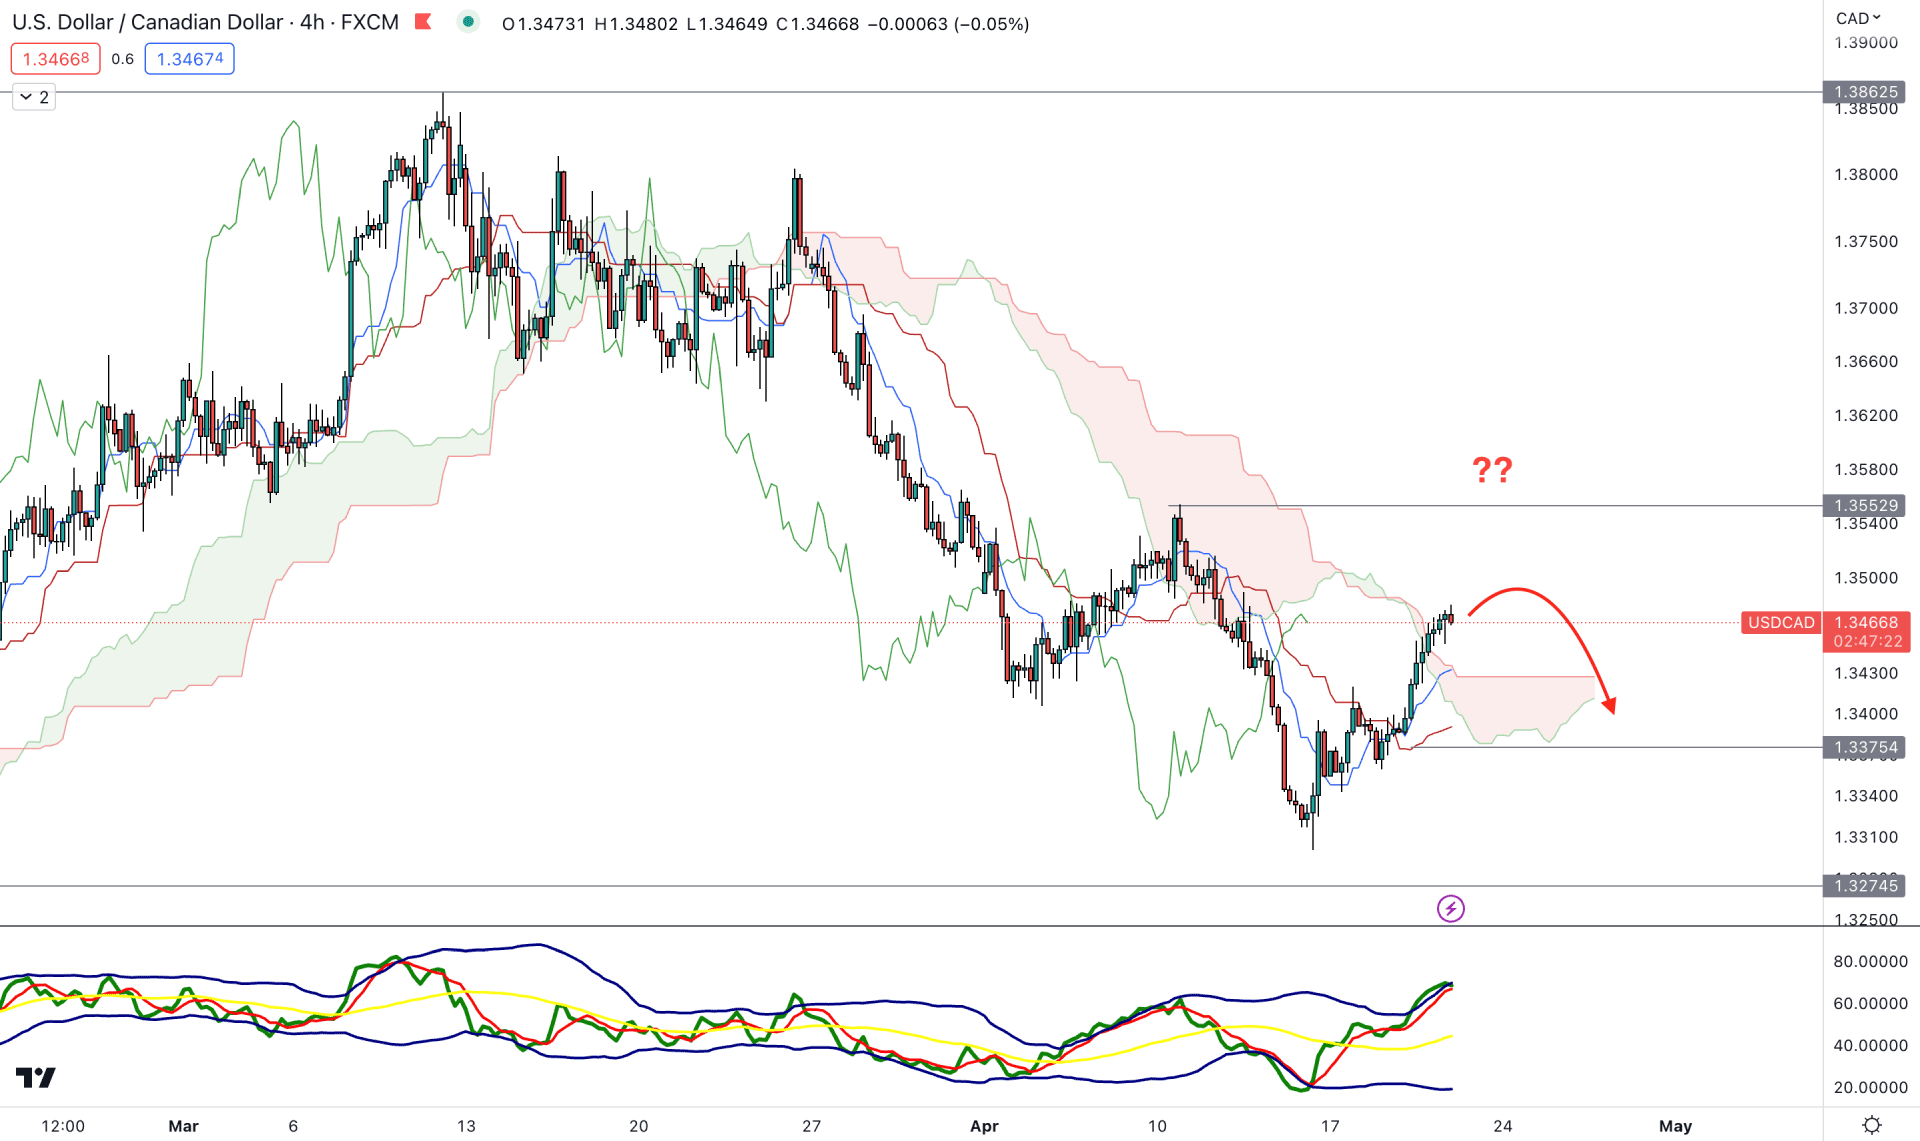
In the H4 timeframe, the price is trading higher above the dynamic Kumo Cloud for the first time since 24 March 2023. Moreover, the bullish break is not solid as it did not come with an impulsive momentum.
The Senkou Span B is flat in the future cloud, which signals a muted mode from long-term traders. However, the Senkou Span B is aiming higher, signaling a short-term buyers presence in the market, while the Lagging Span is closer to the price.
Based on the H4 outlook, bulls should have a valid break of structure above the 1.3552 level before opening a long position. On the other hand, an immediate downside pressure and an H4 candle below the 1.3375 level could resume the bearish trend toward the 1.3200 level.
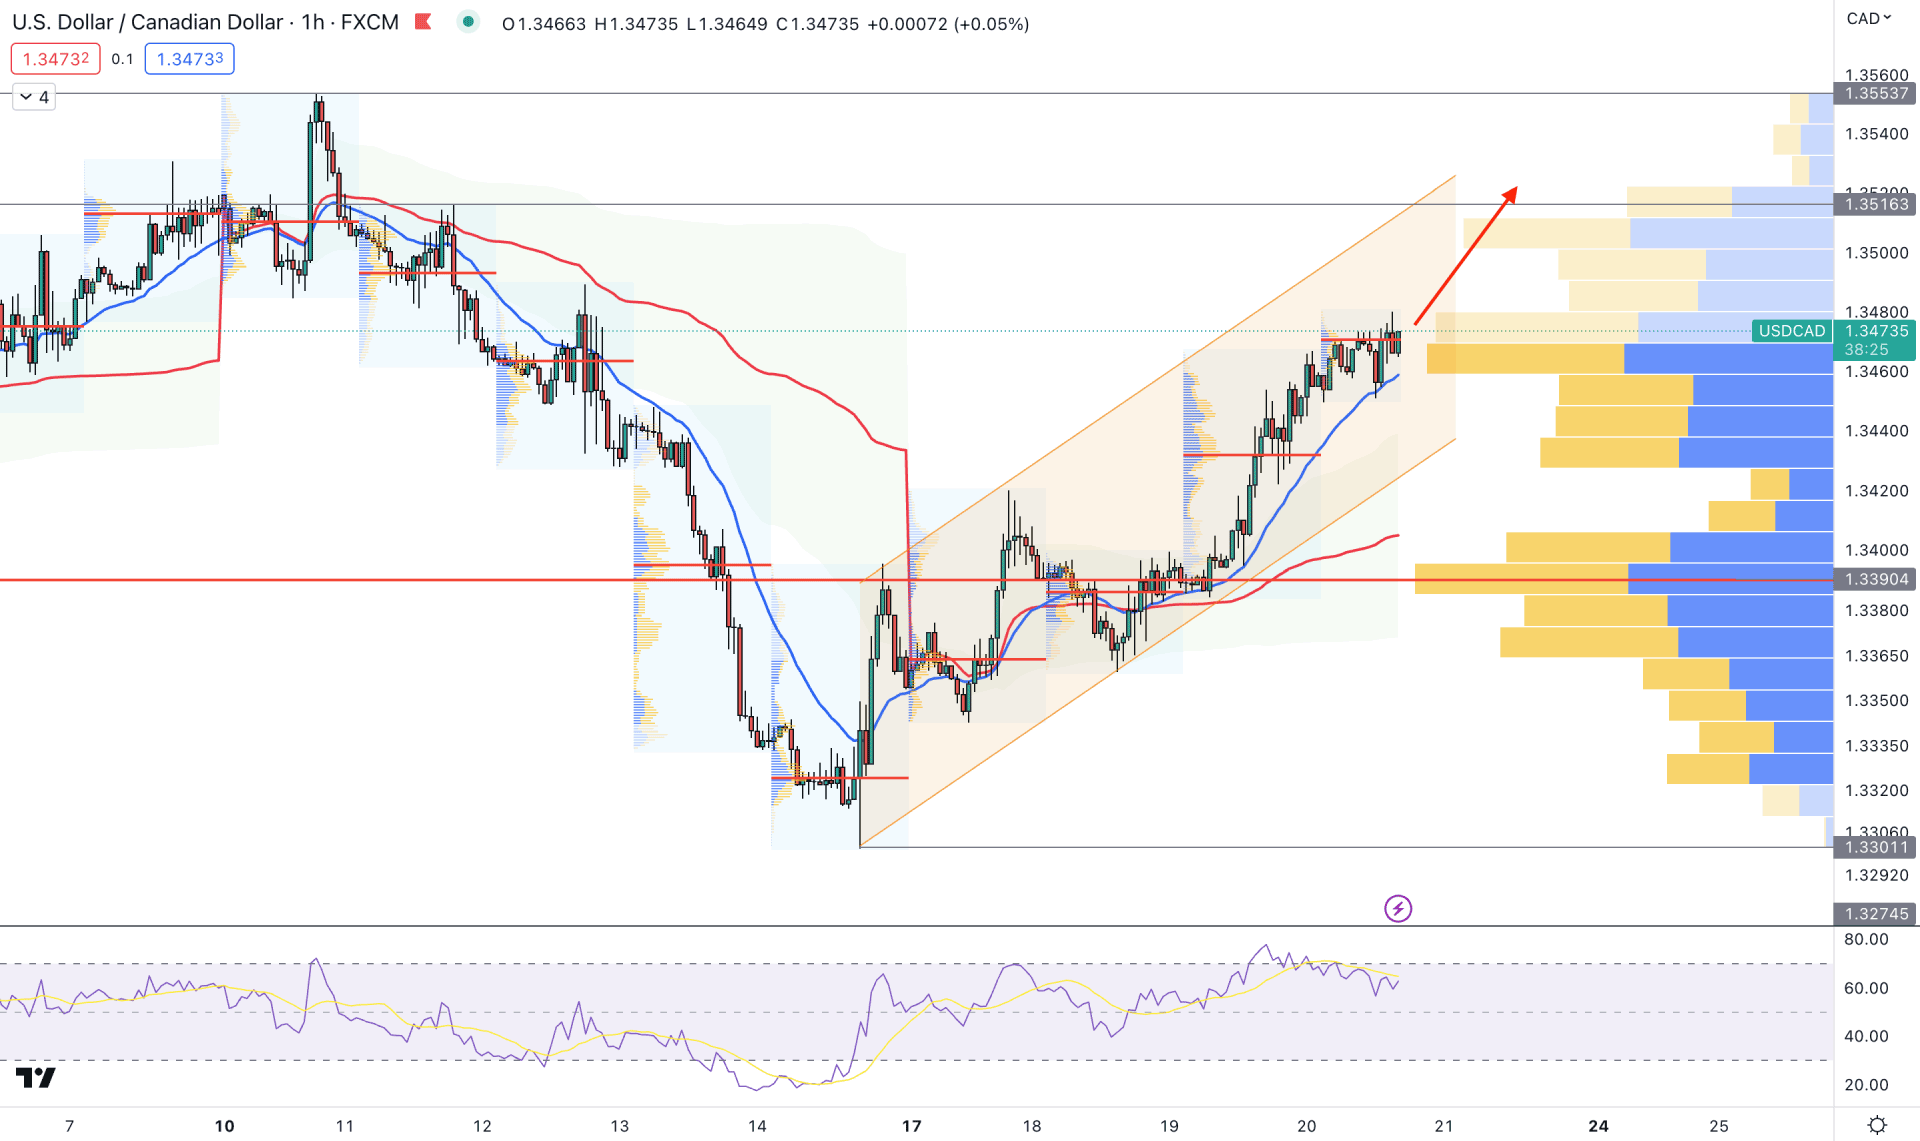
In the intraday chart, the current market outlook is bullish as the price is above the visible range high volume level, while the dynamic 20 EMA is below the price.
In the indicator window, the current RSI level is above the 50.00 line, aiming higher toward the 70.00 area. The price chart shows a gap between the 20 EMA and VWAP, which is a sign of a price anomaly. Moreover, the current price is approaching the channel resistance, while the 1.3526 would be a valid static resistance level.
Based on the current market outlook, a strong bearish pressure with an H1 candle below the 1.3390 level could open a short opportunity, targeting the 1.3300 level. However, any rebound from the dynamic 20 EMA or VWAP could extend the current bullish trend beyond the 1.3553 resistance level.
Based on the current price outlook, USDCAD bulls are active in the market and can increase the price in the coming days. However, investors should wait for a valid bullish breakout above the 20 Day EMA before opening any long position.


