
Published: December 21st, 2022
The latest Fed meeting bought a rate hike of 50 bp as expected, pushing the Fed funds rate into a range of 4.25-4.50%. The statement declared that “ongoing increases' ' in the rate will be pleasant. The dot plot shows the 2023 median rate at 5.1% compared to the 4.6% it showed in September. It is at 4.1% for 2024 vs. In September 3.9%. Growth is seen as limited, and in 2023 the GDP will increase by 0.5%, while the unemployment rate will jump to 4.6% from 3.7% as the current figure. The current inflation is too high, and the Fed's main objective is to bring it down to the 2% target.
Jerome Powell, Fed Chair, said there is still work to do on the rates front, although a lot of ground has been covered. He also added that they will stay the course until the job gets done. Rate cuts will be considered “if there is confidence that inflation is moving down to 2%," he strongly announced. The FOMC's view is to keep on with rate hikes until inflation declines.
In Canada, the October manufacturing sales came in at 2.8% m/m vs. 2% m/m as expected, and in September, up from being flat. Sales have gained in 12 of 21 industries and are now up 16.3% y/y. Wholesale trade for the same month elevated to 2.1% vs. the expectation of 1.3% and up from the previous month -0.2%.
In recent days, the US Dollar index showed a corrective price action even after the rate hike that might influence CAD bulls to gain a position.
Let’s see the future price of USDCAD from the multi-timeframe technical analysis:
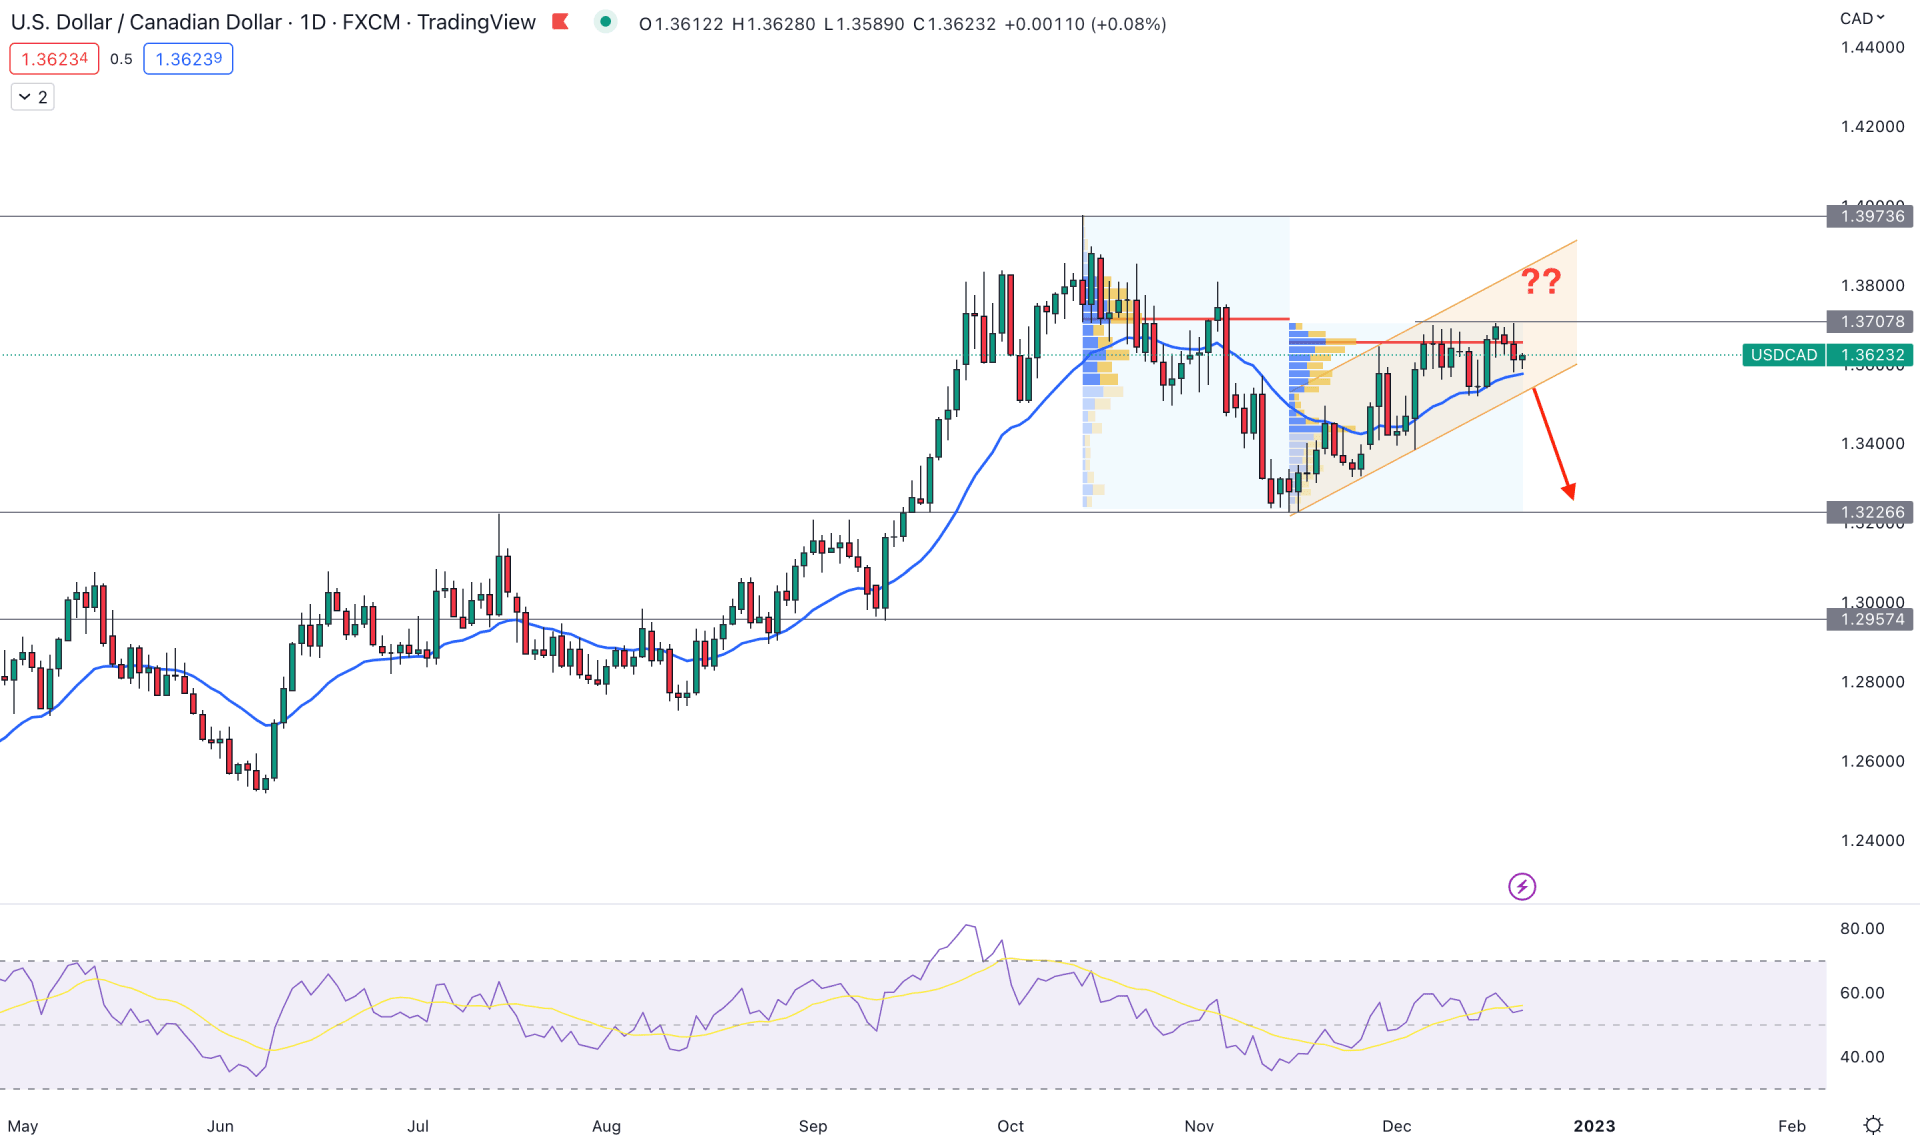
At the first sight, the upside pressure is solid in the USDCAD daily chart as the price is moving higher from the left to right. However, before proceeding to the exact price direction, let's find the trading range.
A strong bearish pressure with a buy-side liquidity grab is visible from the 1.3973 level, which is the top of the tradable range. On the other hand, a strong bullish pressure is visible from the 1.3226 event level, which can be considered as the bottom of the range. As the current price is trading at the premium zone of the range, any bearish opportunity could provide a higher return.
The highest trading volume level from the October-November peak is at 1.3718 level, which is above the current price. Moreover, the latest high volume level from December low to high is at 1.3658 level, which is also above the current price. Therefore, strong selling pressure is visible in this pair, which is valid until the bulls overcome the 1.3718 peak.
The dynamic 20-day Exponential Moving Average is carrying the price towards the bullish side, while the current Relative Strength index (RSI) is above the 50% neutral level.
Therefore, the current price action is enough to say that the upside possibility is solid as long as it trades above the dynamic 20 EMA support. On the other hand, the bearish pressure will be extended after the ascending channel breakout, opening the possibility of reaching the 1.3226 low.
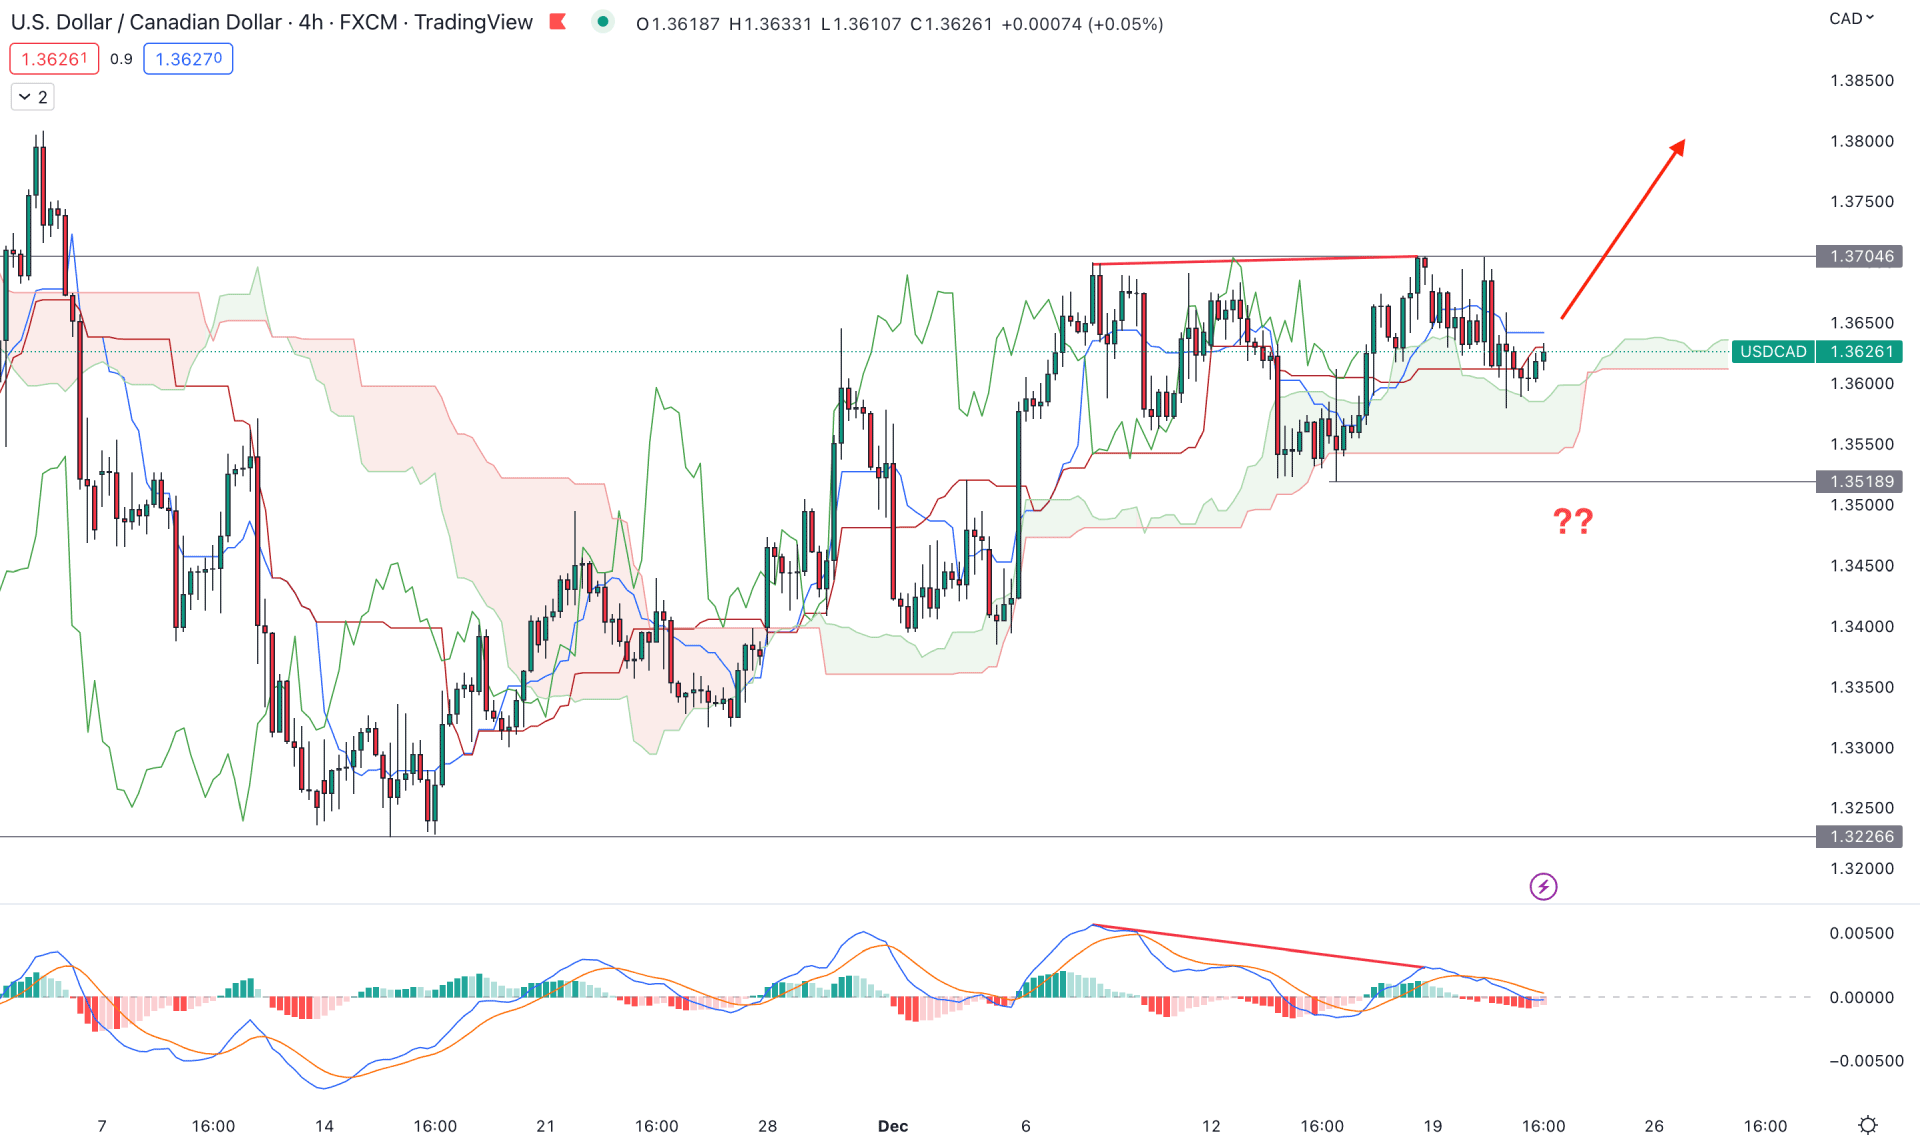
In the H4 chart, the bullish trend continuation opportunity is present in the USDCAD price where the current price is trading above the dynamic Kumoc Cloud. The upside momentum is also solid from the possible Head and Shoulders pattern, where a new H4 candle above the 1.3704 level would validate the neckline breakout.
In the future cloud, the Senkou Span B is below A, where both of these lines are moving higher. It is a sign of emerging buying pressure in the USDCAD price, which could offer a long opportunity. The indicator window shows the same story despite the emerging divergence in the MACD EMA.
Based on the H4 structure, a bullish breakout with an H4 close above the 1.3704 level is needed to validate the buying possibility in this pair. On the other hand, a downside pressure below the 1.3518 level could eliminate the current buying possibility and lower the price in the coming days.
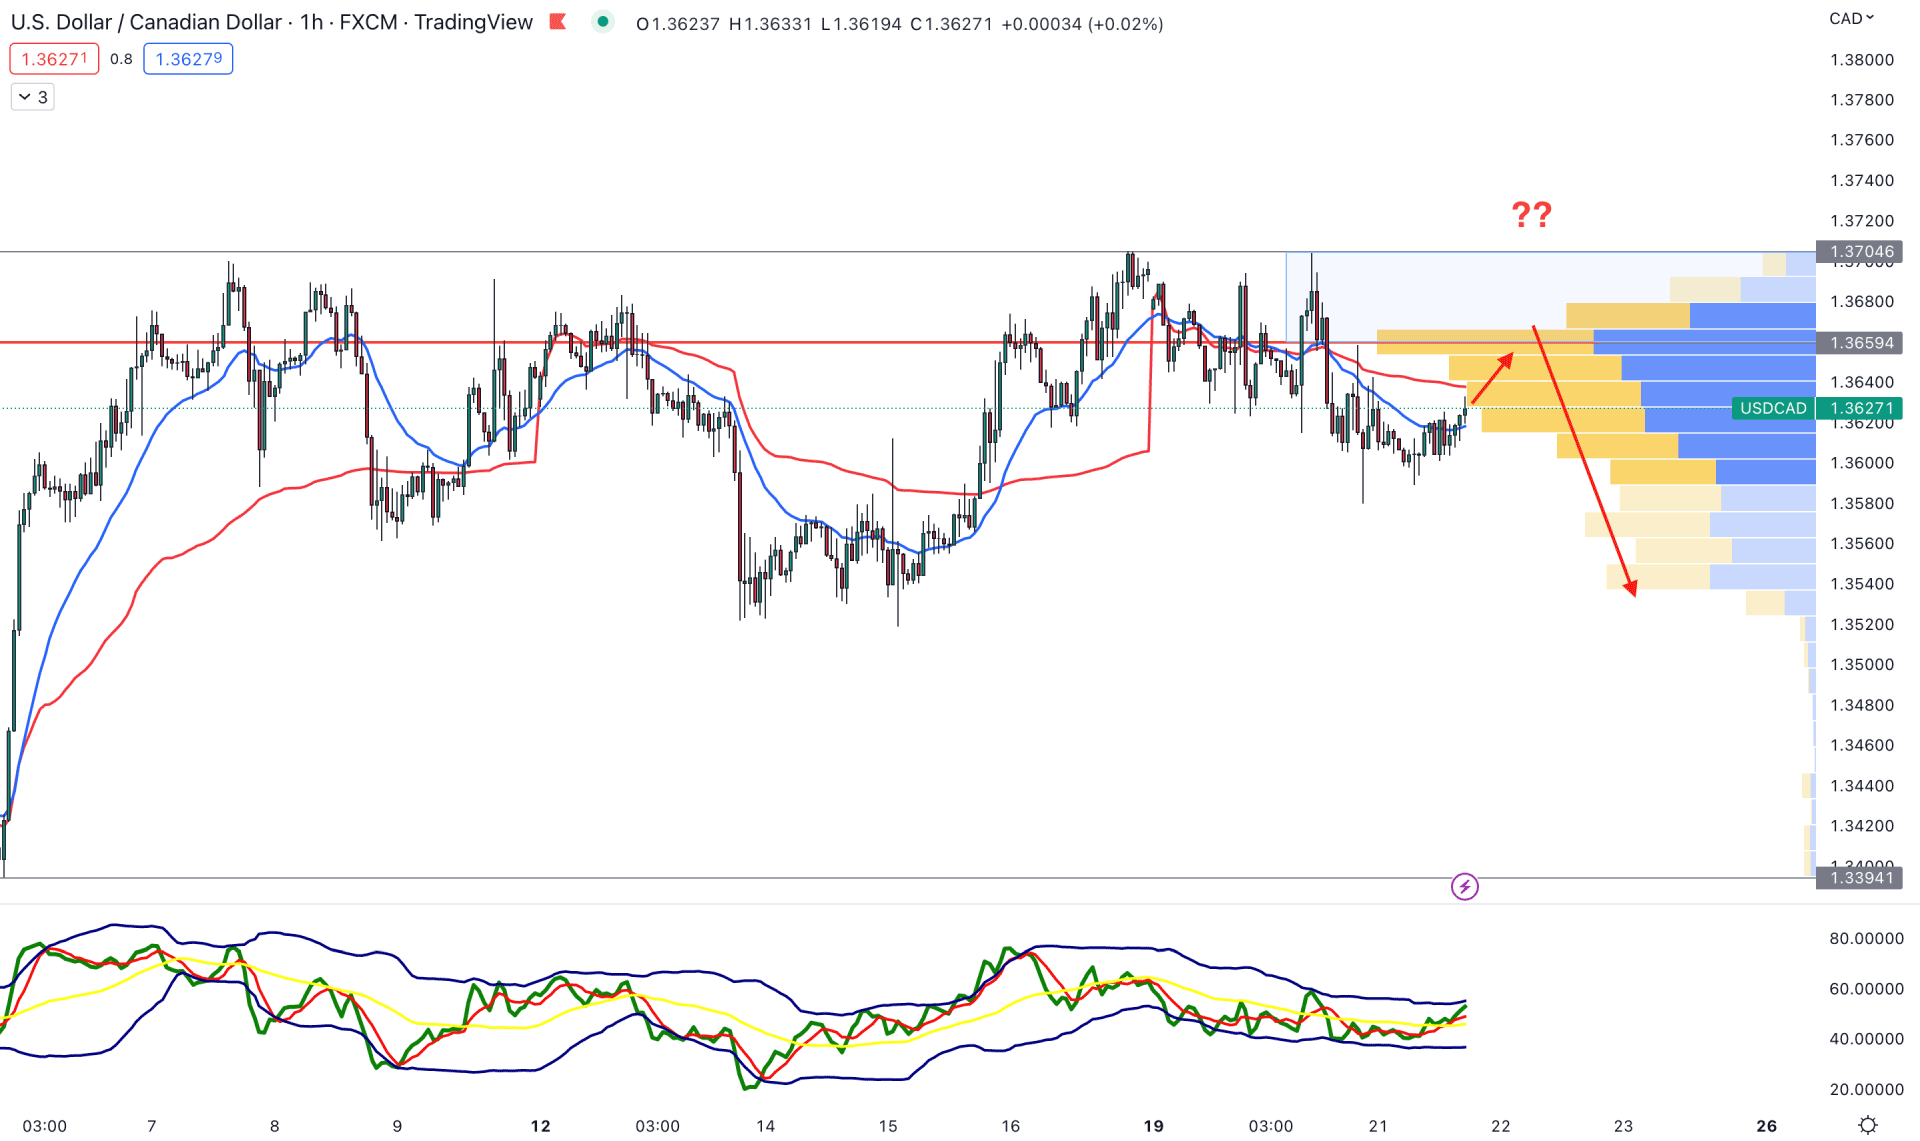
In the hourly timeframe, it is clearly visible why investors should wait for a bullish breakout to ride the current trend.
The latest visible range high volume level is above the current price, while the dynamic 20 EMA and VWAP are acting as a resistance. Moreover, the Current Traders Dynamic Index level reached the overbought position from where downside pressure may come.
Based on this structure, any selling pressure from the 1.3659 to 1.3704 area could offer a short opportunity, targeting the 1.3500 level.
On the other hand, a bullish breakout with an H4 close above the 1.3710 level is needed, which could increase the possibility of reaching the 1.3800 area.
Based on the current price structure, USDCAD is still a buy as the intraday price has formed a bullish pre-breakout structure. However, closer attention to the higher timeframe price action is needed as any bearish break from the channel support could validate the long-term short opportunity.


