
Published: June 22nd, 2023
The two-week high in crude oil prices that were set on Wednesday is being maintained, which is positive for the Canadian Dollar (CAD). As a result of less hawkish remarks by Federal Reserve (Fed) Chair Jerome Powell, who projected a more modest pace for rate hikes, the US dollar (USD) is, in contrast, trading close to its monthly low.
The USD/CAD pair has been under pressure to decline, although current conditions prevent further losses.
Worries about a worldwide economic slowdown significantly impact crude oil prices, notably in China. Additionally, traders are discouraged from initiating big bearish positions on the USD, supporting the USD/CAD pair as they anticipate a 25 basis point rate hike by the Fed in July.
The USD's position as a relatively safe haven may increase due to the negative sentiment in the equities markets.
As any hints regarding monetary policy will affect the USD and give the USD/CAD pair new momentum, market investors are now concentrating on Powell's second day of testimony before the Senate Banking Committee. The US economic calendar includes the publication of data on Existing Home Sales and Weekly Initial Jobless Claims in the early North American session. These elements could give major currencies short-term trading opportunities when coupled with changes in oil prices.
Let’s see the future price direction of this pair from the USDCAD technical analysis:
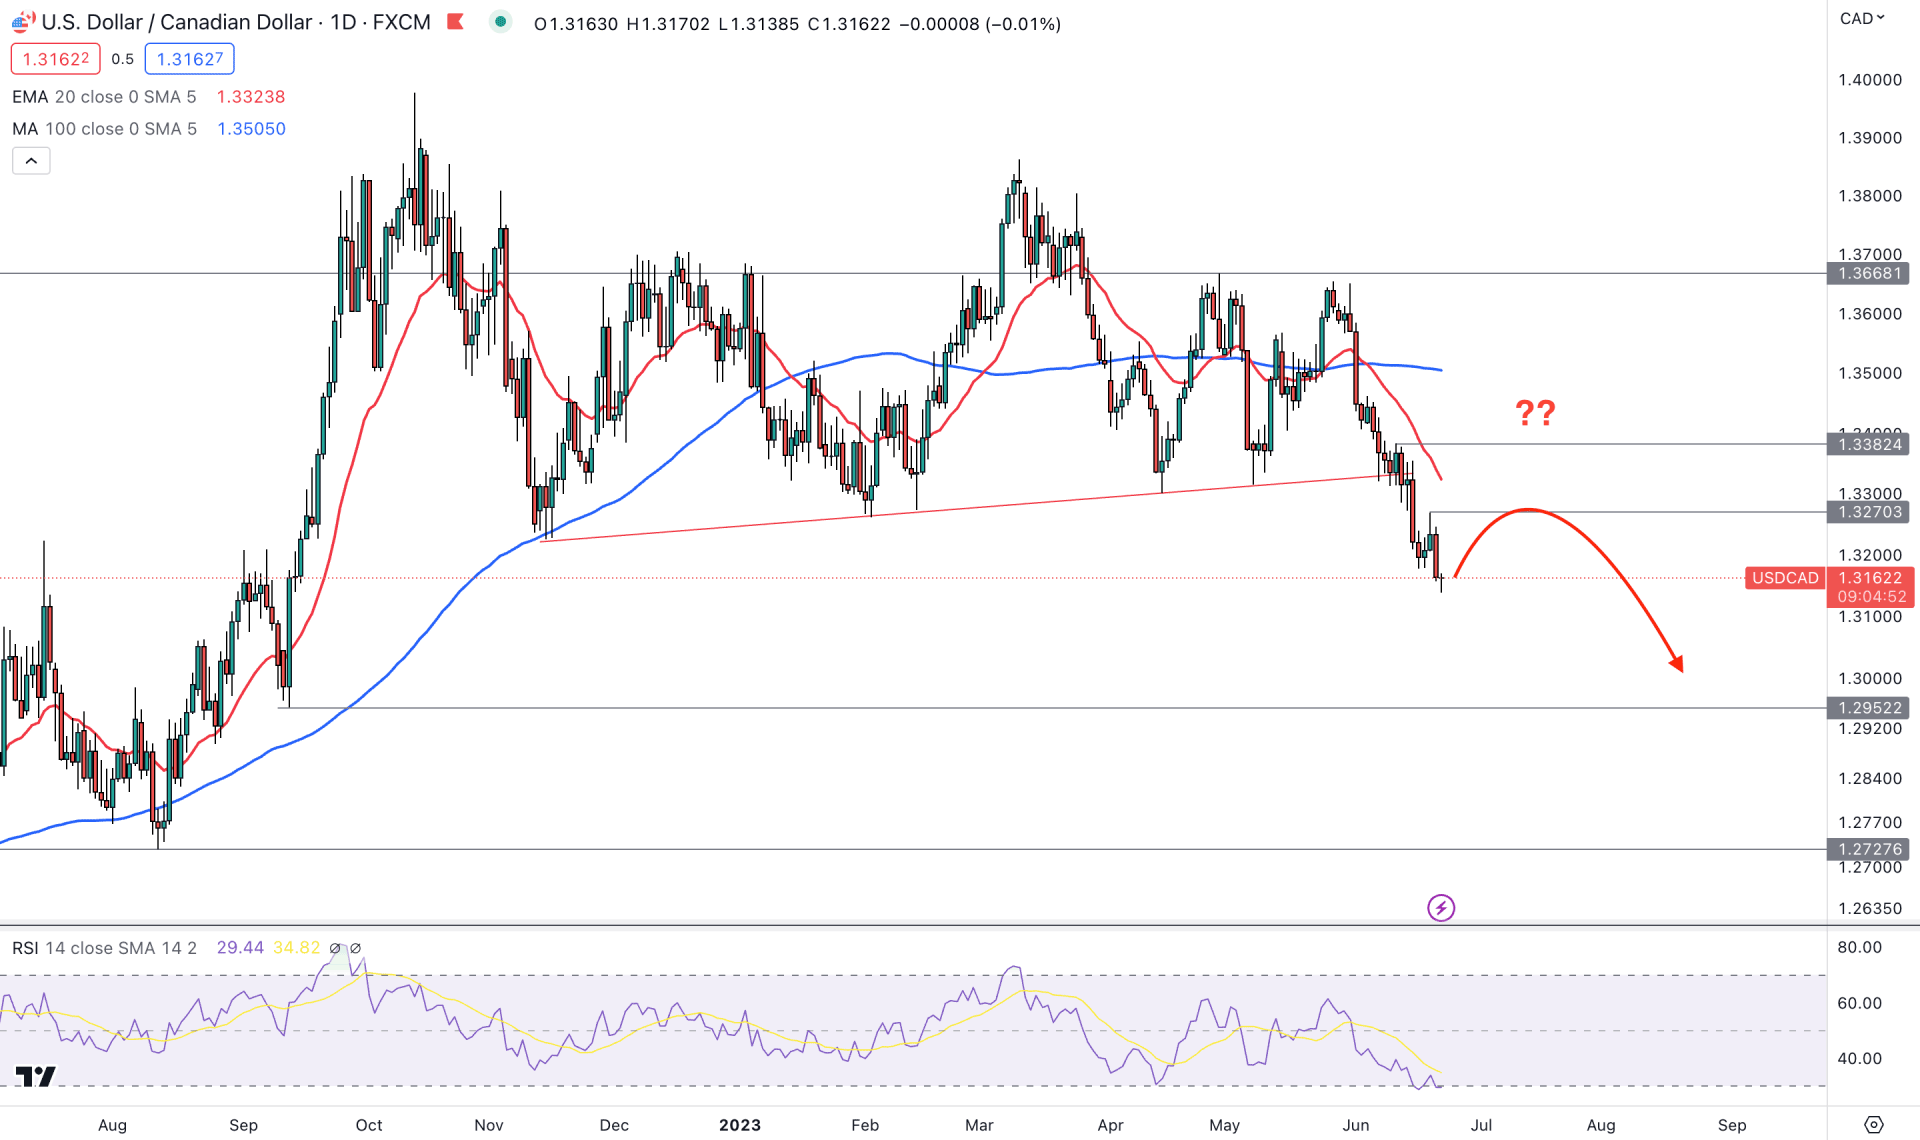
The broader market direction is bearish in the daily price of USDCAD, where the current price is trading below the major trend line break. It is a sign of strong selling pressure in the market, and bears are more likely to win in this context.
In the higher timeframe price action, multiple lower low formations are seen in the weekly chart, supported by the Rally-base-rally formation in the monthly timeframe.
The above image shows how a strong bearish rally came with a liquidity sweep at the 1.3668 level, which became more impulsive after breaking the major trend line support.
The 100-day Simple Moving Average level is above the current price, while the 20 EMA crossed below this line, signaling a strong short-term sellers’ presence in the market.
Moreover, the Relative Strength Index (RSI) reached the oversold zone, signifying a strong bearish trend. However, a recovery in the RSI could signal a minor bullish correction, which may limit the gain for sellers.
Based on the daily price outlook, investors might experience a minor upside correction in this pair. However, the upward momentum may extend towards the 1.3382 resistance level.
The first bearish approach may come from the 1.3270 static or 20 EMA dynamic support level, extending the bearish pressure towards the 1.2950 level.
On the other hand, a bullish recovery above the 1.3381 level could indicate sellers' inability to hold the market momentum, which could make the entire price action obsolete with an upward possibility, targeting the 1.3600 level.
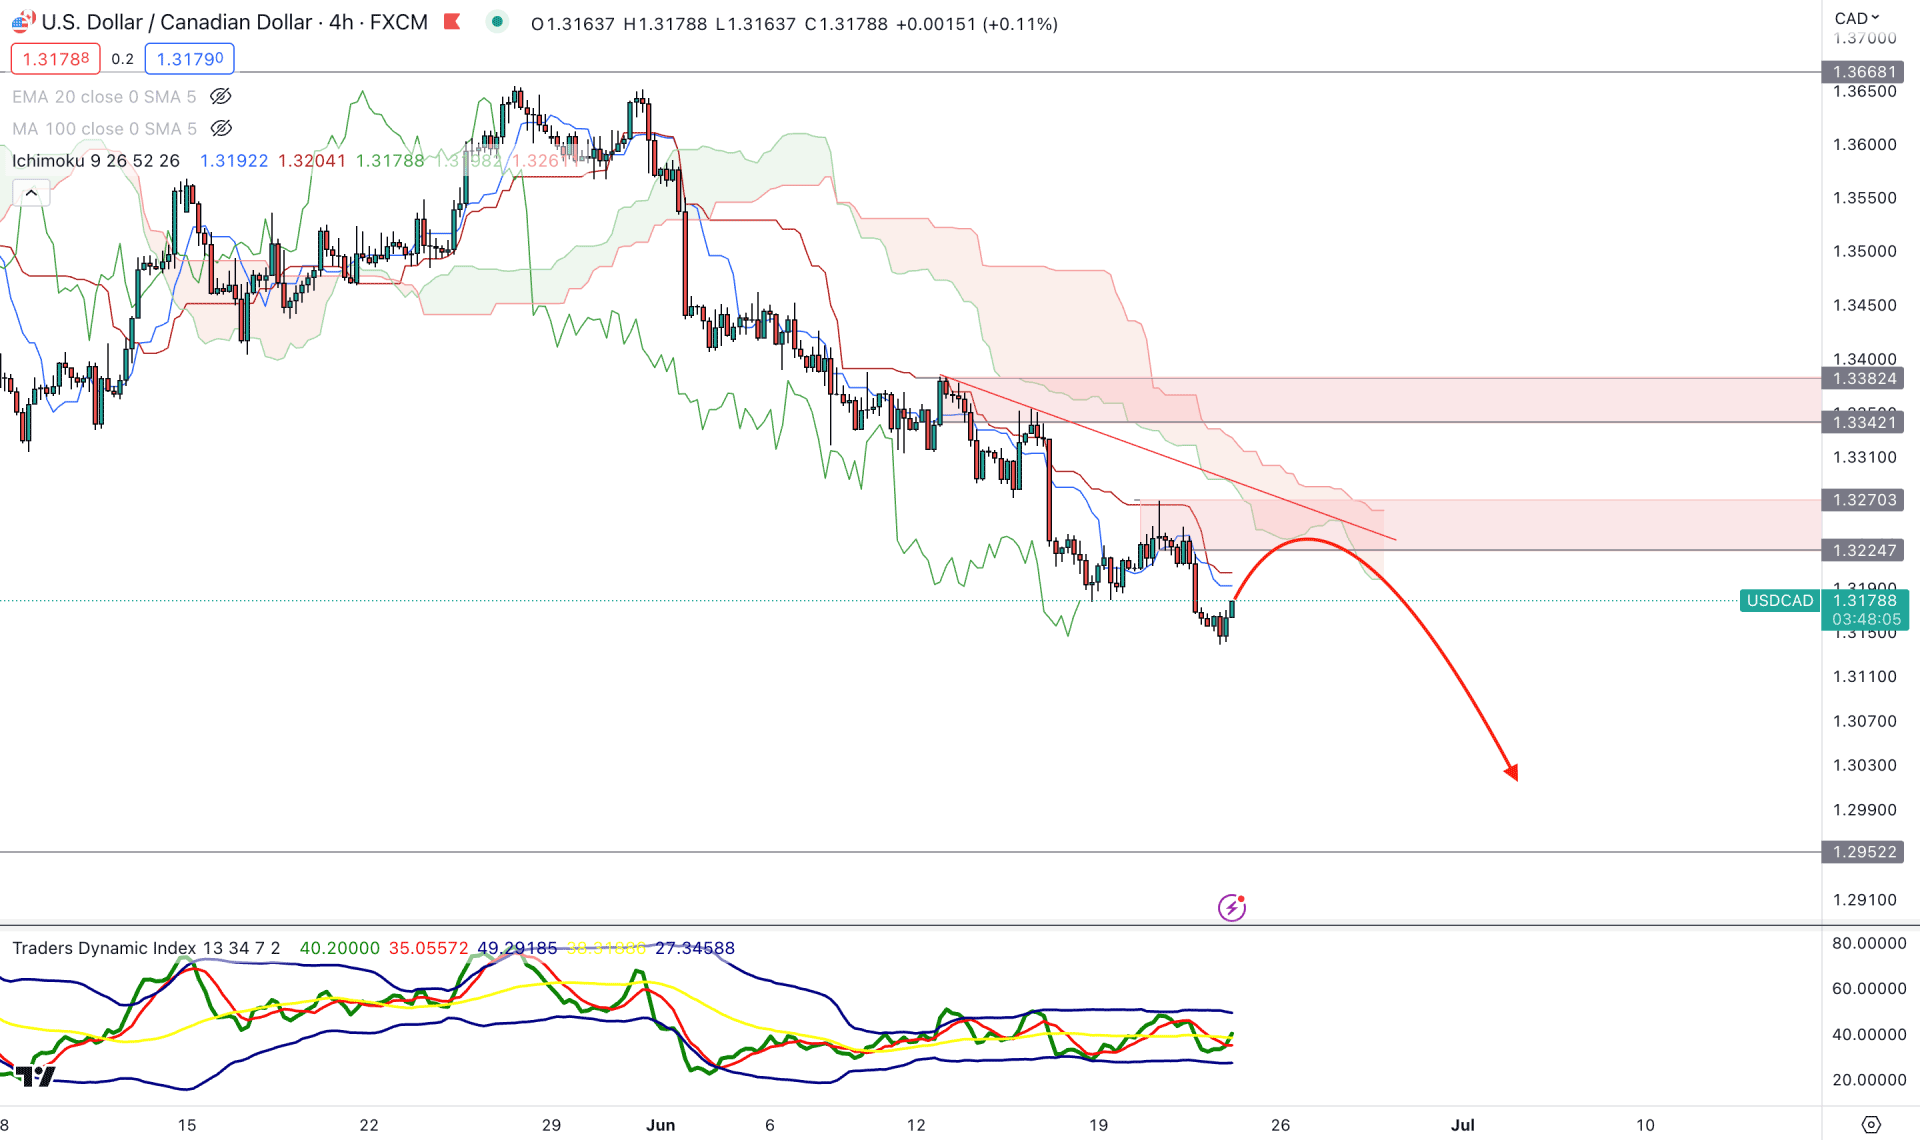
The H4 chart shows the market trend clearly bearish, as multiple lower lows are below the Ichimoku Cloud resistance. Moreover, the Tenkan Sen and Kijun Se are above the current price, working as resistances.
In the near-term price action, the current supply zone is at the 1.3270 to 1.3224 area, from where the existing selling pressure made a new Break of structure. In that case, the price will likely reach towards this demand zone to mitigate the price inefficiency before forming a new bearish movement.
The current TDI level is above the neutral line in the indicator window, while the broader structure is corrective.
Based on this structure, any bearish rejection from the dynamic Kijun Sen or static supply zone could be a sell signal, targeting the 1.3000 level.
On the upside, there are multiple barriers, where a bullish break and an H4 candle above the 1.3382 level could signal a trend reversal.
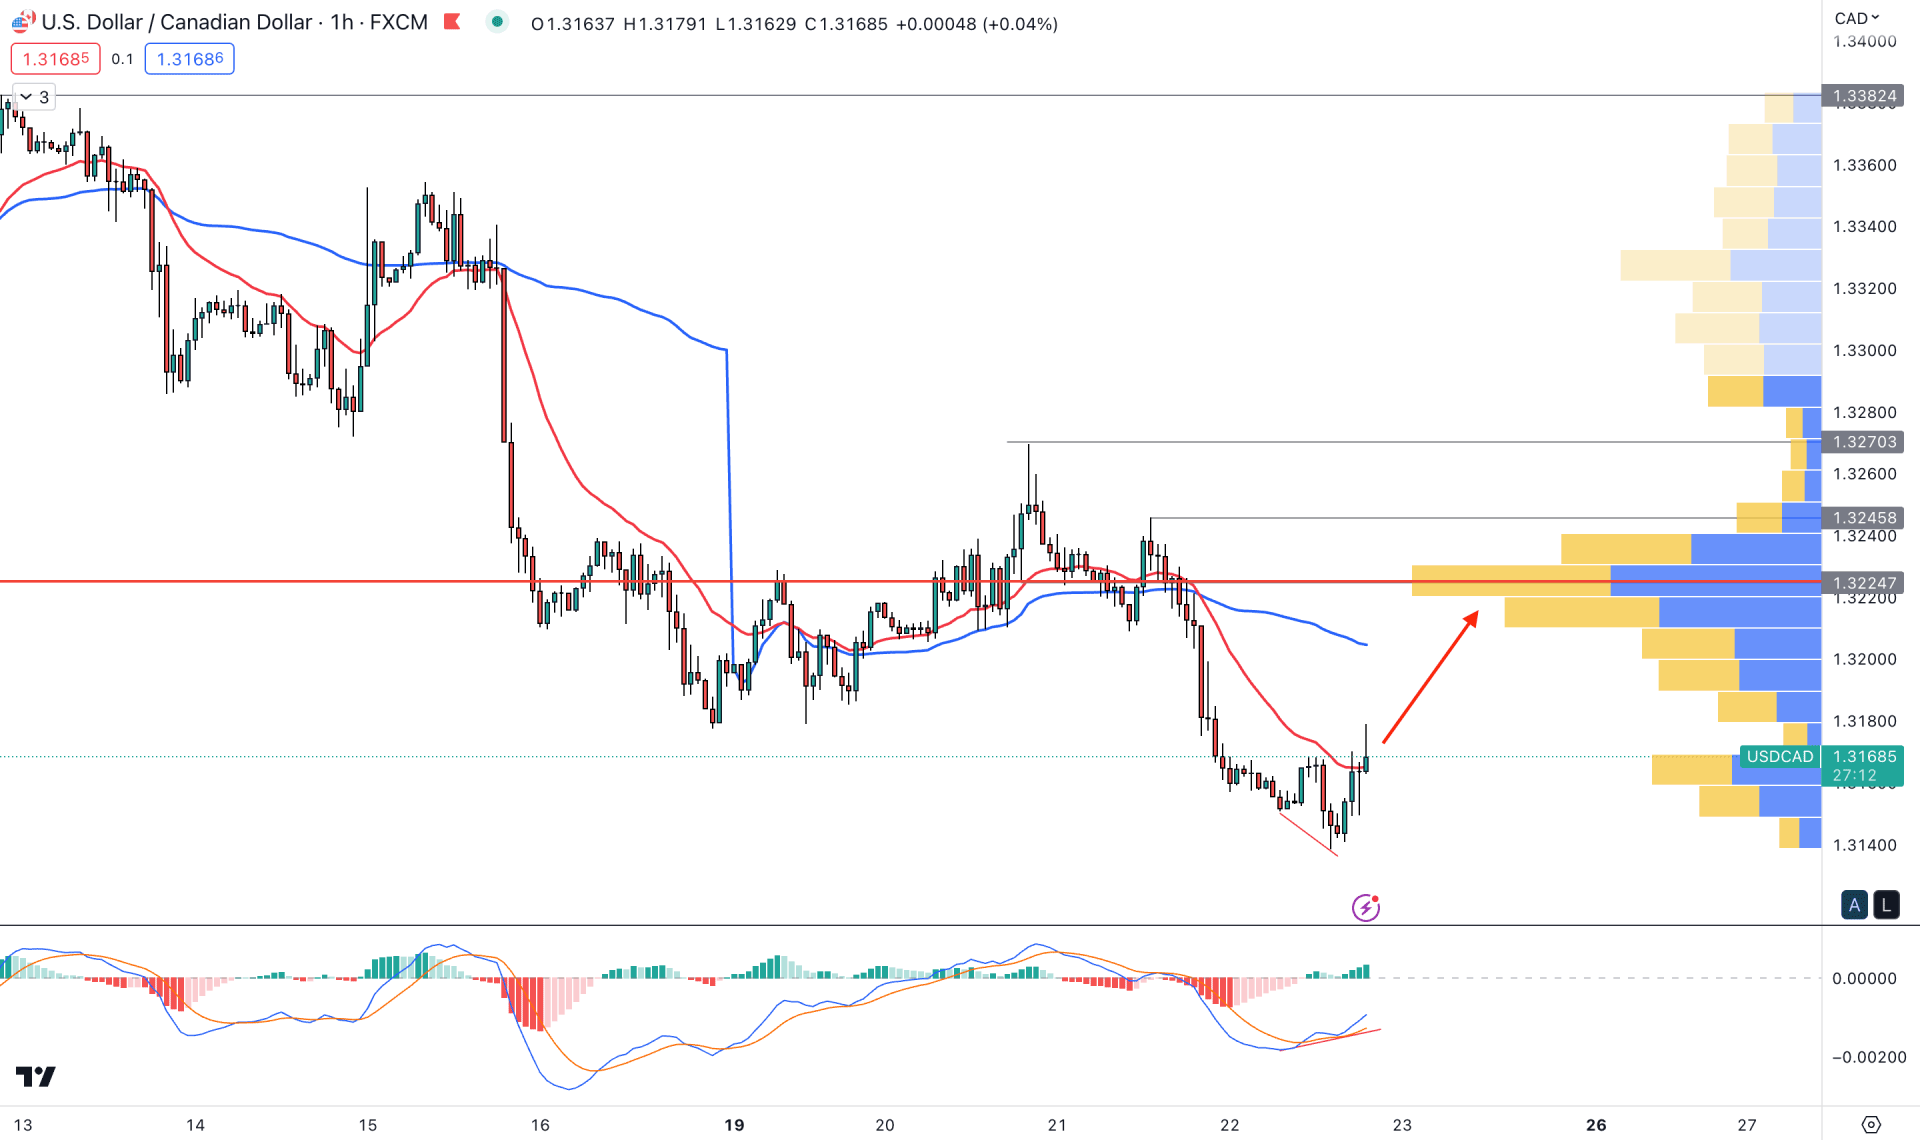
In the hourly chart, the current price trades below the existing swing low of 1.3176. Moreover, the dynamic VWAP is working as a resistance, while the currently visible range high volume level is at 1.3223 level.
If the current price trades below the high volume level, we may expect the bearish pressure to extend in the coming days.
On the other hand, some bullish possibility is visible from the MACD DIvergence, A bullish H1 candle above the 20 EMA also supports the buying possibility.
Based on this structure, any immediate bearish pressure below the dynamic 20 EMA could trigger the bearish possibility. However, a bullish correction towards the 1.3176 high volume level is possible, but breaking above the 1.3176 level with a bullish H1 candle could eliminate the downside possibility.
The broader market trend for the USDCAD is bearish, any short setup could work well in this context. Investors should clearly monitor the intraday price level to find the best area to join the rally.


