Published: December 26th, 2024
The USDCAD has reached the multi-year high, driven by the stronger US Dollar mostly. Above 108.00, the US Dollar Index (DXY), which compares the value of the US dollar to six other major currencies, is trading drearily.
The Federal Reserve (Fed) stated that it would take a more gradual approach to additional policymaking. Therefore, the prognosis for the greenback is still stable. According to the most recent Fed dot plot, policymakers unanimously projected a target fed fund rate of 3.9% by the close of 2025, indicating multiple interest rate cuts from the present level.
Based on the CME FedWatch tool, traders fully expect the Fed to maintain interest rates at 4.25% to 4.50% in January.
As a result of the Bank of Canada's (BoC) significant policy deviation from other central banks, the Canadian dollar (CAD) continues to decline overall. So far this year, the BoC has lowered its essential lending rates to 175 basis points (bps). However, officials encourage patience in assessing the full consequences of previous cuts, and this has led to a gradual relaxation of policy.
Let's see the upcoming price action of this pair from the USDCAD technical analysis:

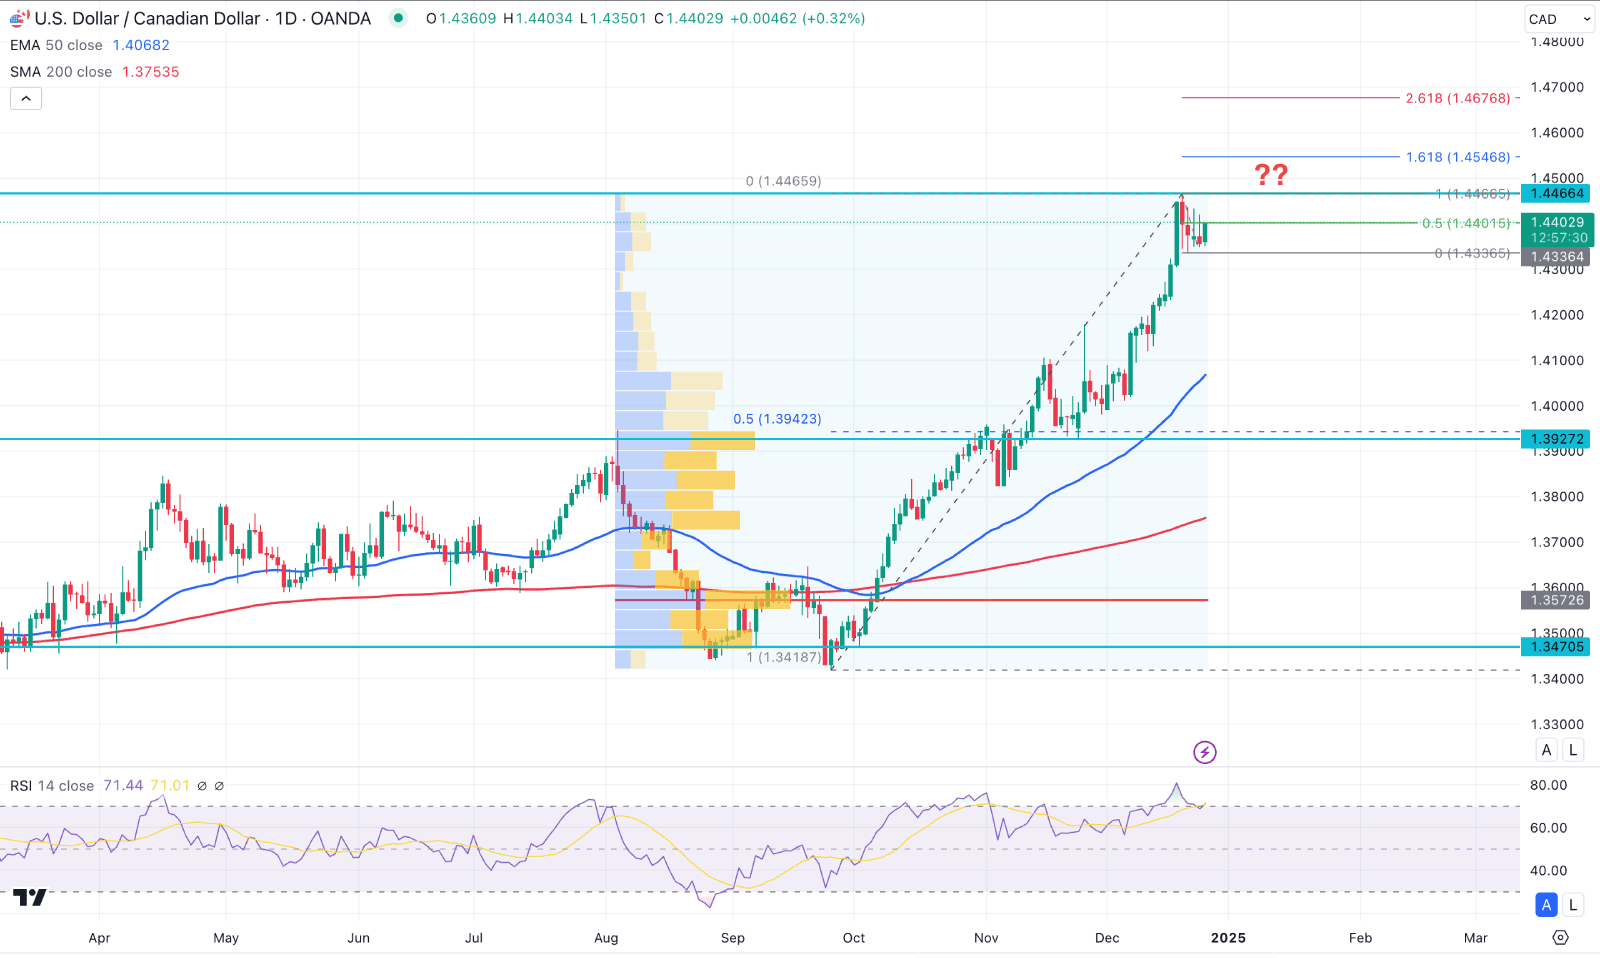
In the daily chart of USDCAD, the recent price showed extensive bullish pressure, taking the price to a multi-year high. However, the impulsive pressure overextended the price from crucial dynamic levels, creating a potential downside recovery.
In the current context, the bottom is formed at the 1.3418 low from where the most recent bullish wave came. However, no sufficient selling pressure is visible at the current top, which needs proper price action before anticipating a bearish move.
In the higher timeframe, the bullish possibility is still valid as the monthly price keeps moving higher for consecutive three months. In that case, a bullish close in December could be a positive sign for bulls, which might extend the price even higher.
In the volume structure, an ongoing bullish wave is present where the current price has been way above the high volume line since August 2024. Looking at the volume Histogram, less activity is seen from the 1.4100 to 1.4466 zone, which might signal an indecision at the top.
The main price chart shows a valid bullish continuation as the dynamic 200-day Simple Moving Average is hovering below the current price. Also the 50-day EMA is above the 1.3927 static level, working as an immediate support.
Based on the daily outlook, the lower trading activity at the top signals a possible range breakout from that area. The price is already at the top with an overbought RSI level, which could be a potential bearish signal.
Primarily a bearish daily candle below the 1.4336 low could increase the bearish opportunity, aiming for the 1.3942 Fibonacci Retracement level. However, any immediate push above the 1.4466 high could extend the price to the 1.4600 to 1.4676 area before forming a bearish signal.

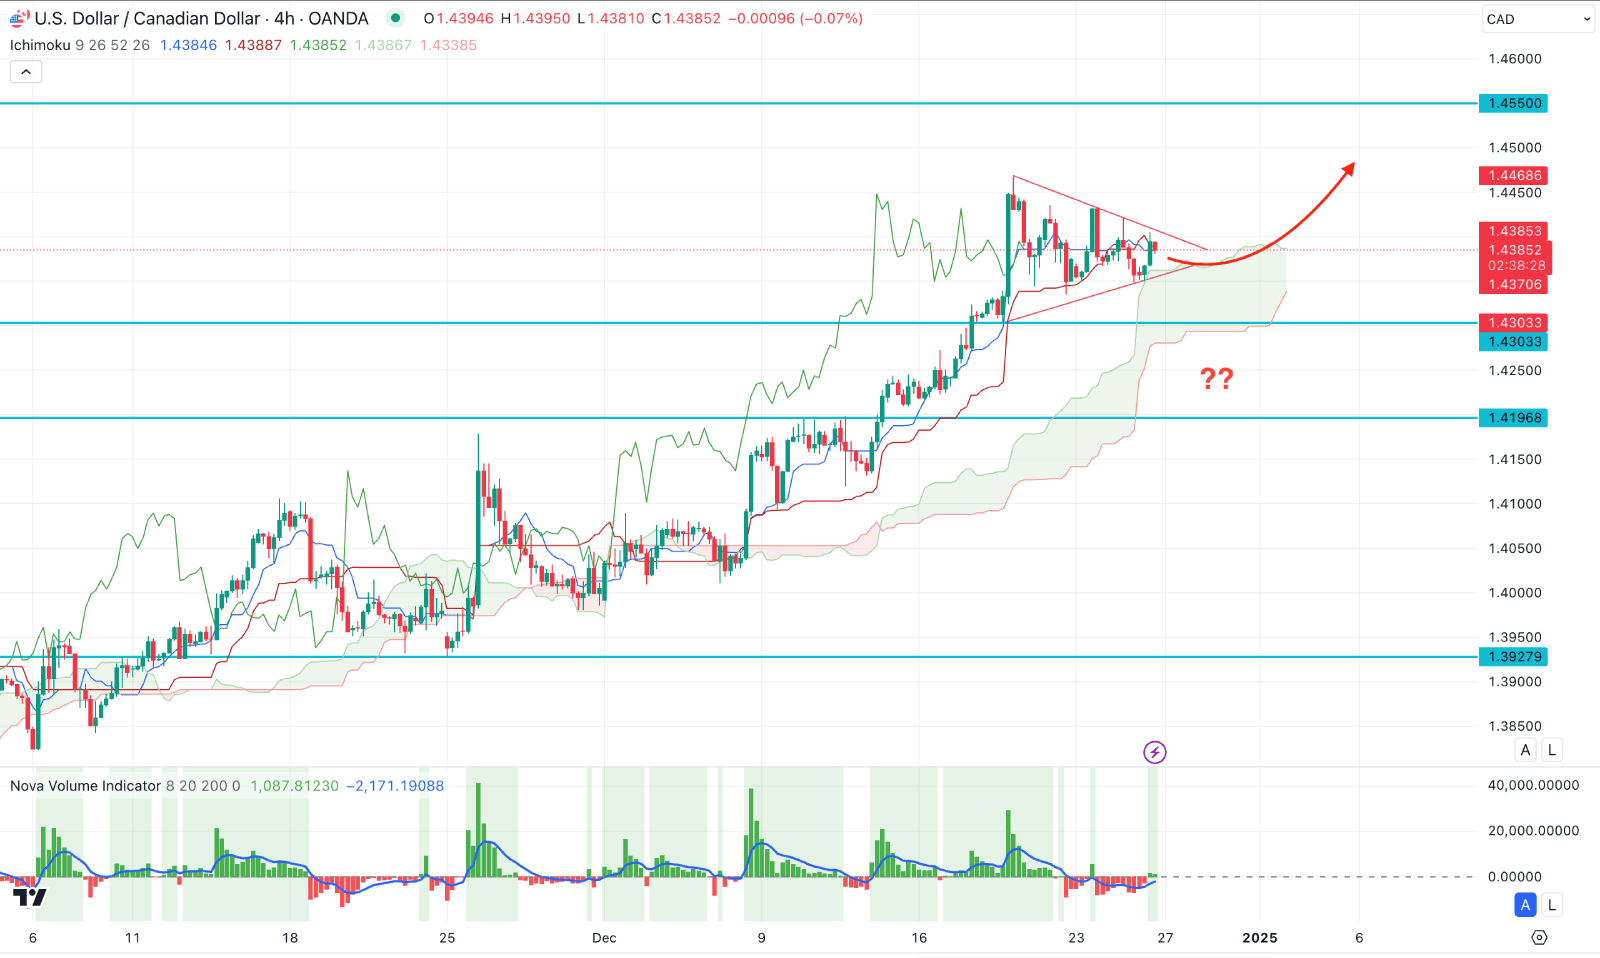
In the H4 timeframe, the recent price shows a corrective momentum at the record high with no sign of a profit taking. Instead of an immediate bearish reversal, the price keeps moving sideways within a symmetrical triangle.
In the Ichimoku Cloud, the Future Cloud looks positive to bulls, while dynamic Kijun Sen is working as an immediate support.
The volume Histogram shows the same outlook, whereas the red histogram keeps losing momentum. In that case, a positive Volume Histogram with a bullish triangle break could work as a bullish continuation signal, aiming for the 1.4550 level.
On the bearish side, a selling pressure below the 1.4303 support level with an immediate bullish recovery could offer a secondary long signal. However, breaking below the 1.4300 level with a consolidation could lower the price towards the 1.4100 psychological line.

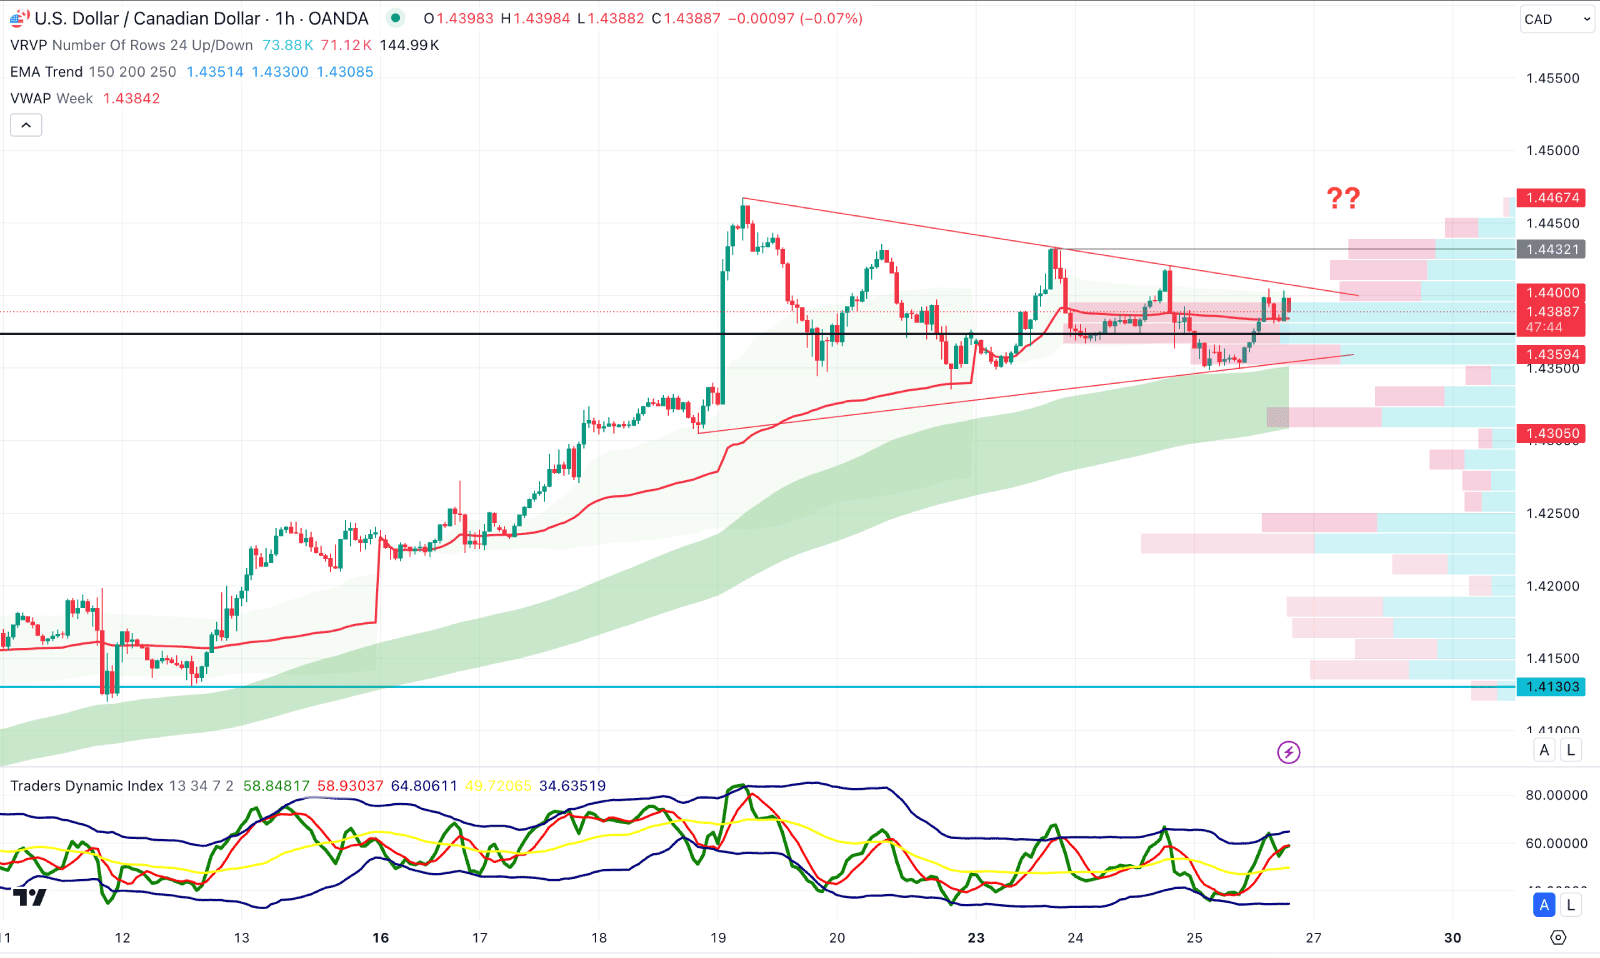
In the hourly chart of USDCAD, a clearer view of the triangle pattern is visible, where the latest price is hovering below the resistance area.
The Moving Average wave consists of 150 to 250 MA lines below the triangle low, working as a major support. Moreover, the bullish pressure is supported by the weekly VWAP line, which is also below the current price.
In the indicator window, the Traders Dynamic Index (TDI) remains in the overbought area, signaling buyers' control of the market.
In that case, the main aim for trades is to seek more intraday gains after overcoming the 1.4432 swing high. Otherwise, an immediate selling pressure is possible, where a bearish H1 candle below the EMA cloud might limit the gain at any time.
Although the intraday price action is bullish in the USDCAD price, a downside correction is pending in the broader context. Any bullish continuation in the intraday chart could create a buyers' climax at any time. However, a potential bearish opportunity needs a valid recovery below the daily range before anticipating a broader correction.