
Published: September 22nd, 2020
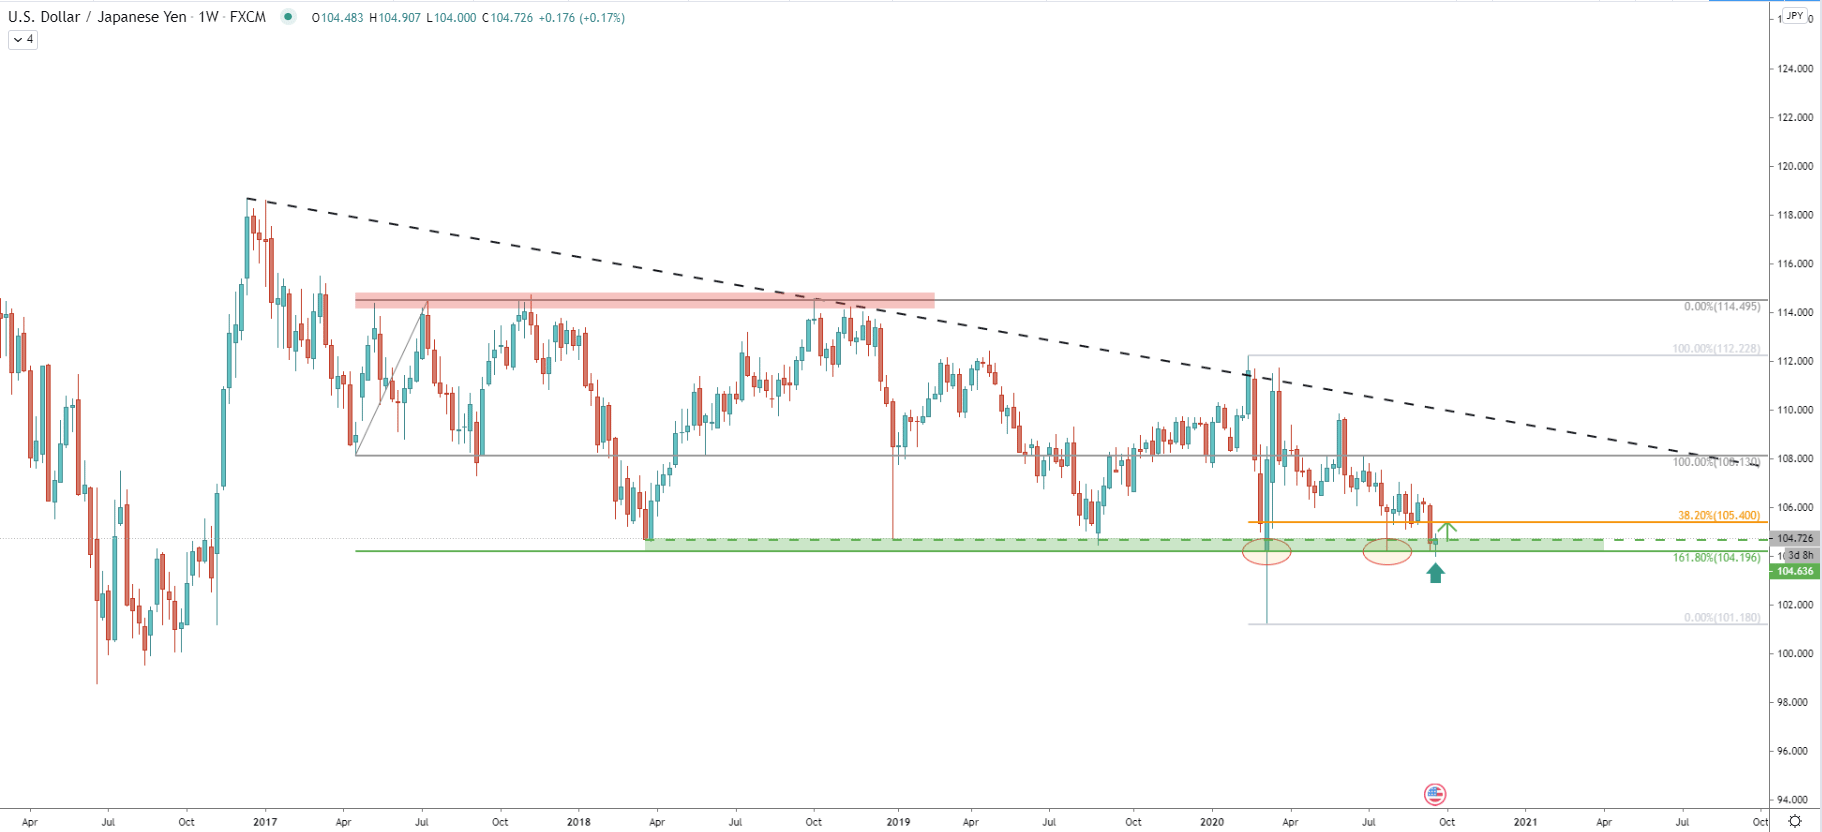
On the weekly chart, USD/JPY has formed a triangle pattern with clear support near the 104.20 area. This support has been rejected for 6 consecutive times with the most recent bounce occurred just this week. In fact, yesterday the price has reached and cleanly rejected the 104.00 psychological level, which goes to show that bulls might be starting to take control.
While it is too early to say that it is a potential trend reversal, but at least a correctional move to the upside can be expected as long as 104.00 support holds. Also, the Fibonacci retracement indicator was applied to the resistance area near 115.00, which shows that 161.8% Fibs has been rejected cleanly in the past, yet again validating the strong support at 104.00 area.
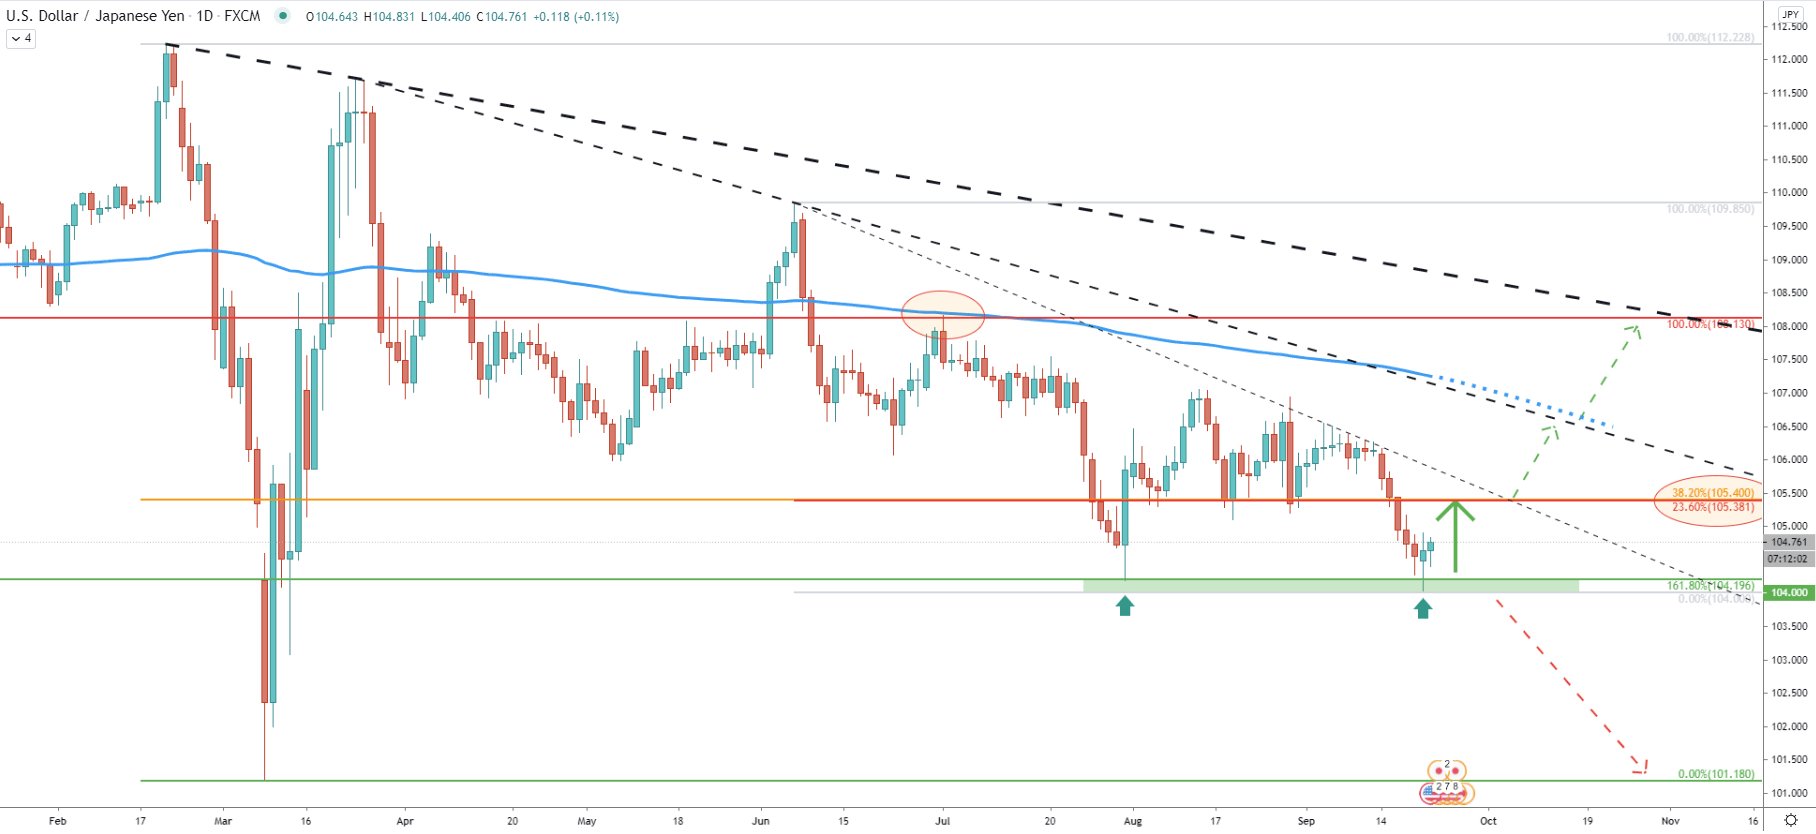
There is a potential formation of the double bottom near 104.00 as the price rejected this level twice. There are multiple potential upside targets or resistance levels but as can be seen, the nearest one is located at 105.40. This resistance is confirmed by two Fibonacci retracement levels, namely 23.6%, and 38.2% Fibs as can be seen on the daily chart. This means that there is over 100 pips growth potential in the short term, but only as long as 104.00 support holds.
If/when 105.40 resistance will be penetrated, USD/JPY could continue to rise, and might be aiming for the second downtrend trendline which also corresponds with the extended 200 Exponential Moving Average. If the second trendline with the EMA will be broken, USD/JPY might go much higher, towards the third downtrend trendline near 108.30 resistance, where previously USD/JPY rejected cleanly the 200 EMA.
On this chart, the RSI oscillator has formed a bullish divergence adding extra confidence to the potential upside move. The upside target near 105.40 corresponds to the previous level of support, which might be acting as the resistance in the future. Besides, it also corresponds to the extended 50 EMA as well as the simple downtrend trendline. Considering the time when 105.40 resistance is crossing with the downtrend trendline, it might take only a few days for the upside target to be tested.
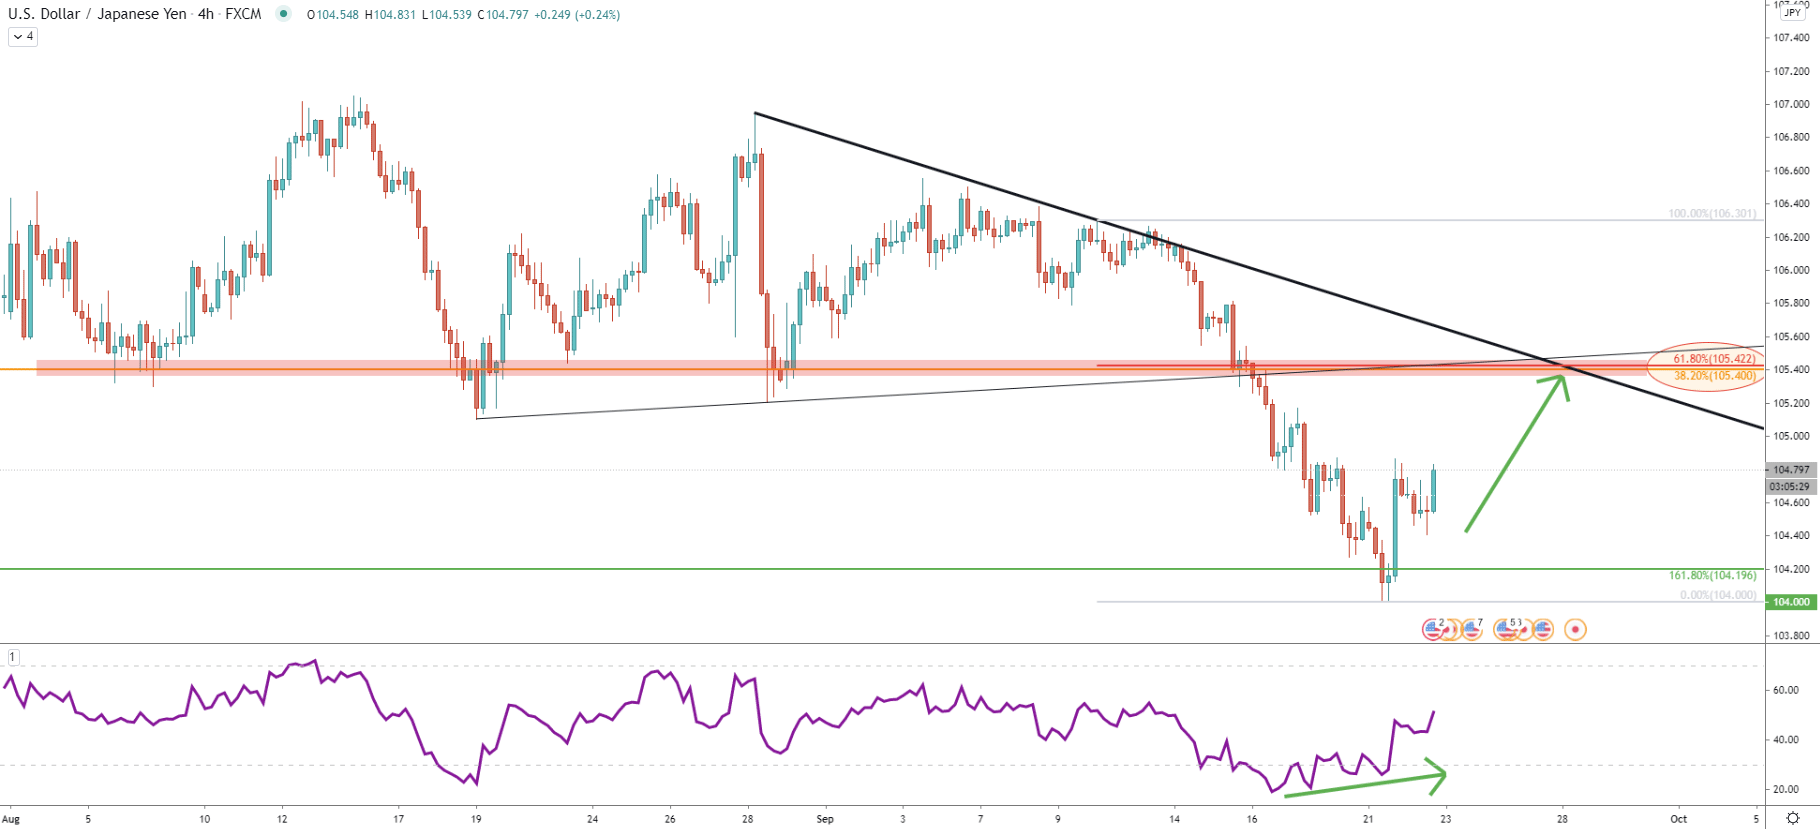
On the 4-hour chart, RSI oscillator also formed a bullish divergence, while the upside target corresponds with yet another Fibonacci retracement level. This is 61.8% Fibs at 105.42, applied to the last downside wave. Moreover, the upside target corresponds to the uptrend trendline, which previously was broken, but might act as the resistance in the coming days.
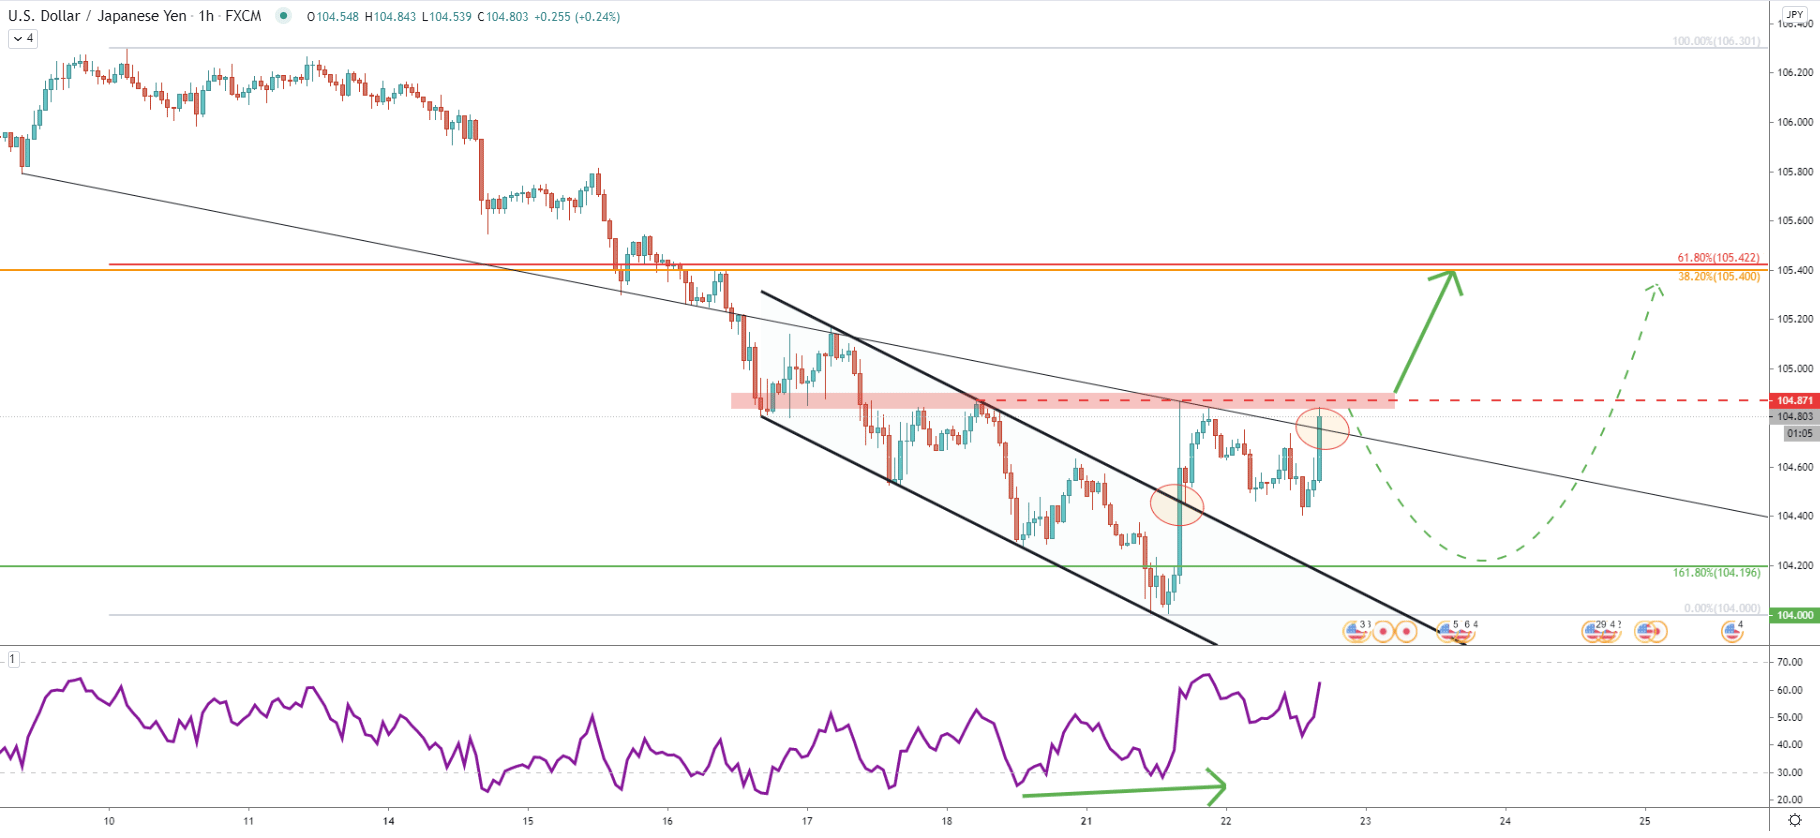
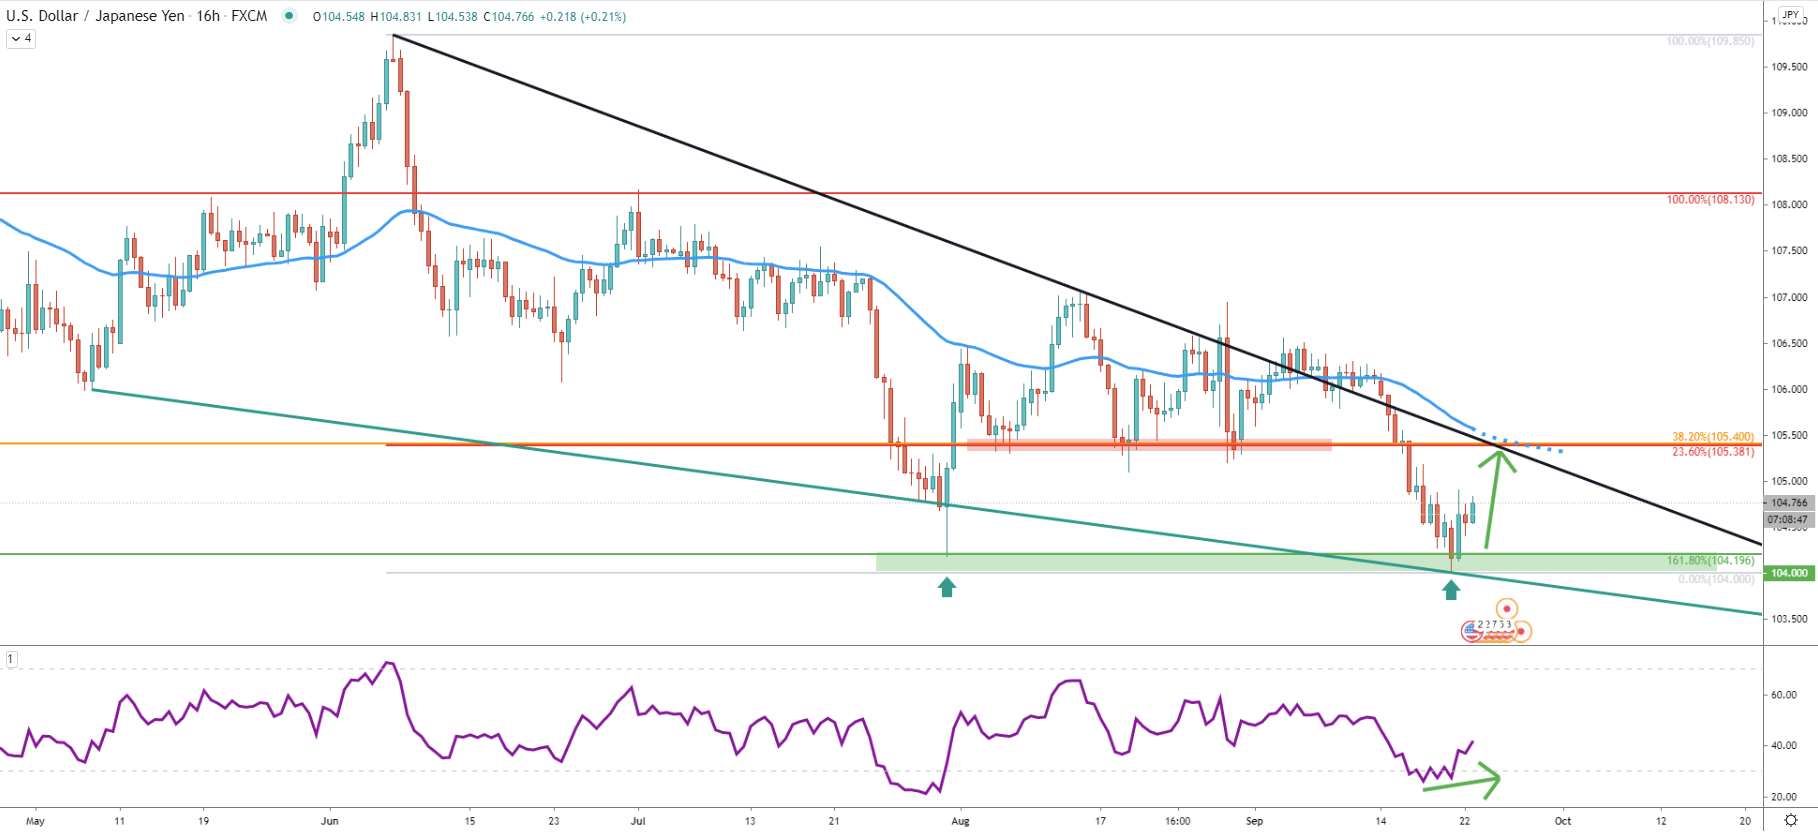
Finally, on the hourly chart RSI yet again formed a bullish divergence after which price broke above the descending channel. Today price has corrected down, but rejected the point of channel breakout, making 104.40 a support area.
On the other hand, the average-price downtrend trendline was rejected, forming the resistance near 104.80. This might result in a short term selling pressure, before/if USD/JPY will continue to move upwards. Buyers could be waiting for the current resistance breakout, upon which uptrend might become exponential.
USD/JPY has reached and rejected the key support area near 104.00 multiple times. On 3 different timeframes, RSI oscillator formed a bullish divergence suggesting a potential corrective move to the upside.
The key nearest resistance and the potential upside target is located at 105.40, which is confirmed by 3 different Fibonacci retracement levels, 2 downtrend trendlines, and 2 extended moving averages.
Only a daily break and close below 104.00 can invalidate the bullish forecast, and at that point USD/JPY is likely to continue trending down, or initiate a consolidation phase.
Support: 104.20, 104.00
Resistance: 104.87, 105.40