
Published: July 8th, 2020
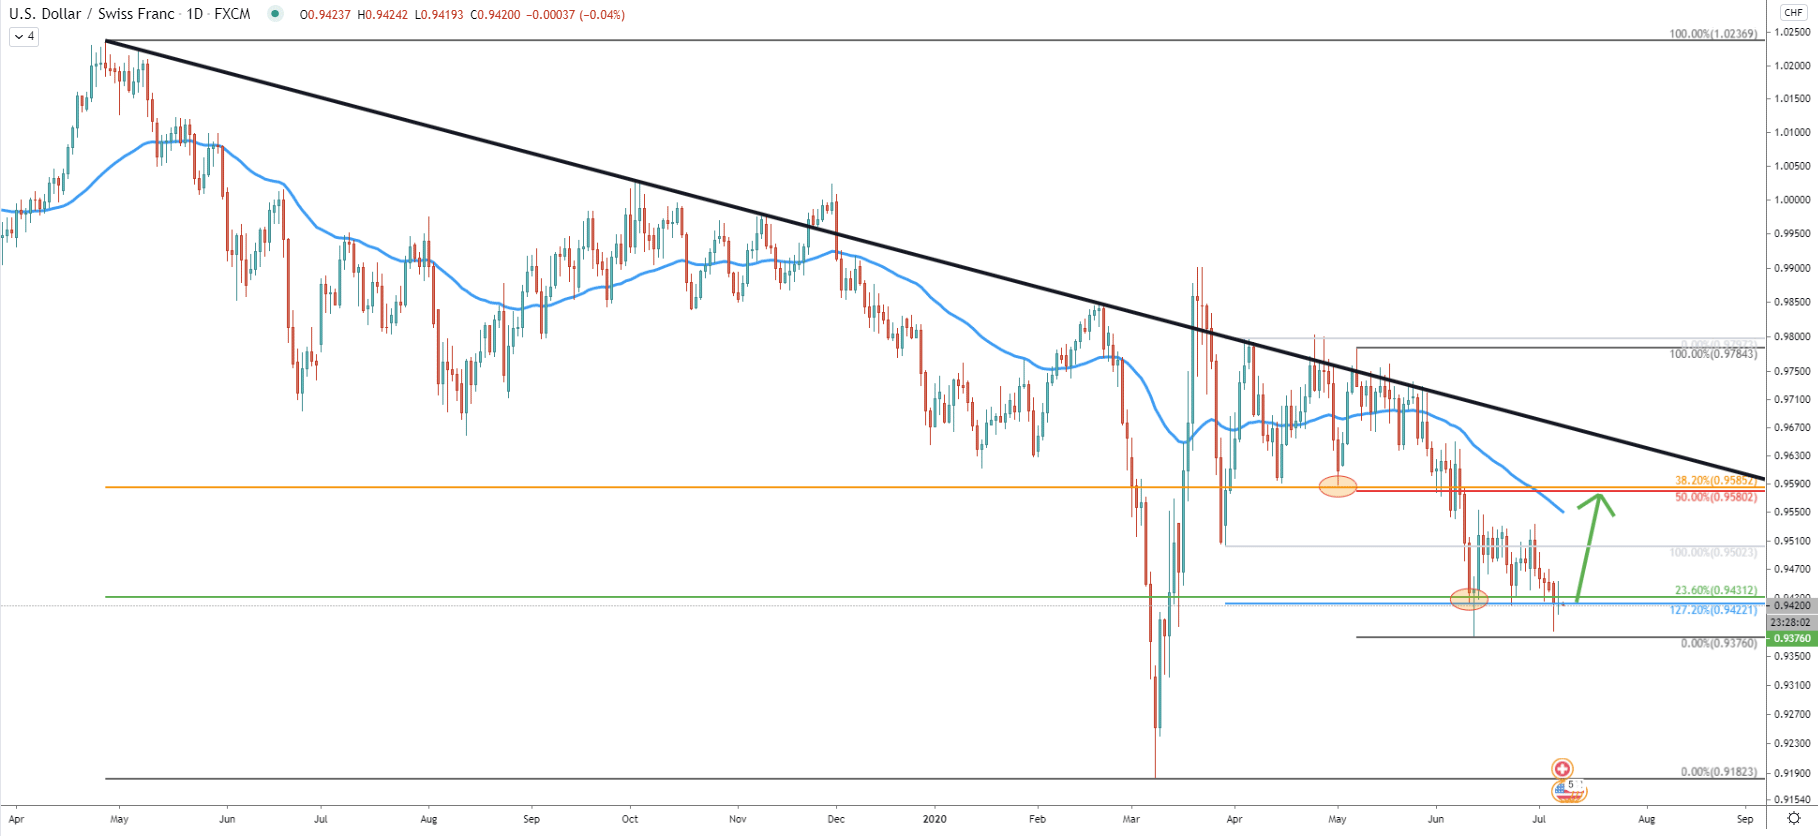
On the Daily timeframe, USD/CHF has produced a double bottom near 0.9400 physiological support. We can also see that the daily close has been right at the 0.9422, which is 127.2% Fibonacci retracement level applied to the first corrective wave up after breaking below the 50 Exponential Moving Average. The bounce off the Fibs was very clean and even on the attempt to break below, daily close still remained above the support.
Price has been ranging between the 0.9555 resistance and 0.9422 support for the past 20 trading days. But on July 6 USD/CHF produced a double bottom near the 127.2% Fibs support.
We’ve applied another Fibonacci retracement indicator to the overall downtrend visible on the chart above. It shows that 23.6% Fibs is the support that also was rejected, while 38.2% Fibs at 0.9585 is the nearest resistance and the potential upside target. This resistance also corresponds to the 50% Fibs applied to the last wave down, which occurred between May 7 - June 11. And besides, 0.9580 previously acted as the support, making it a potential future supply zone.
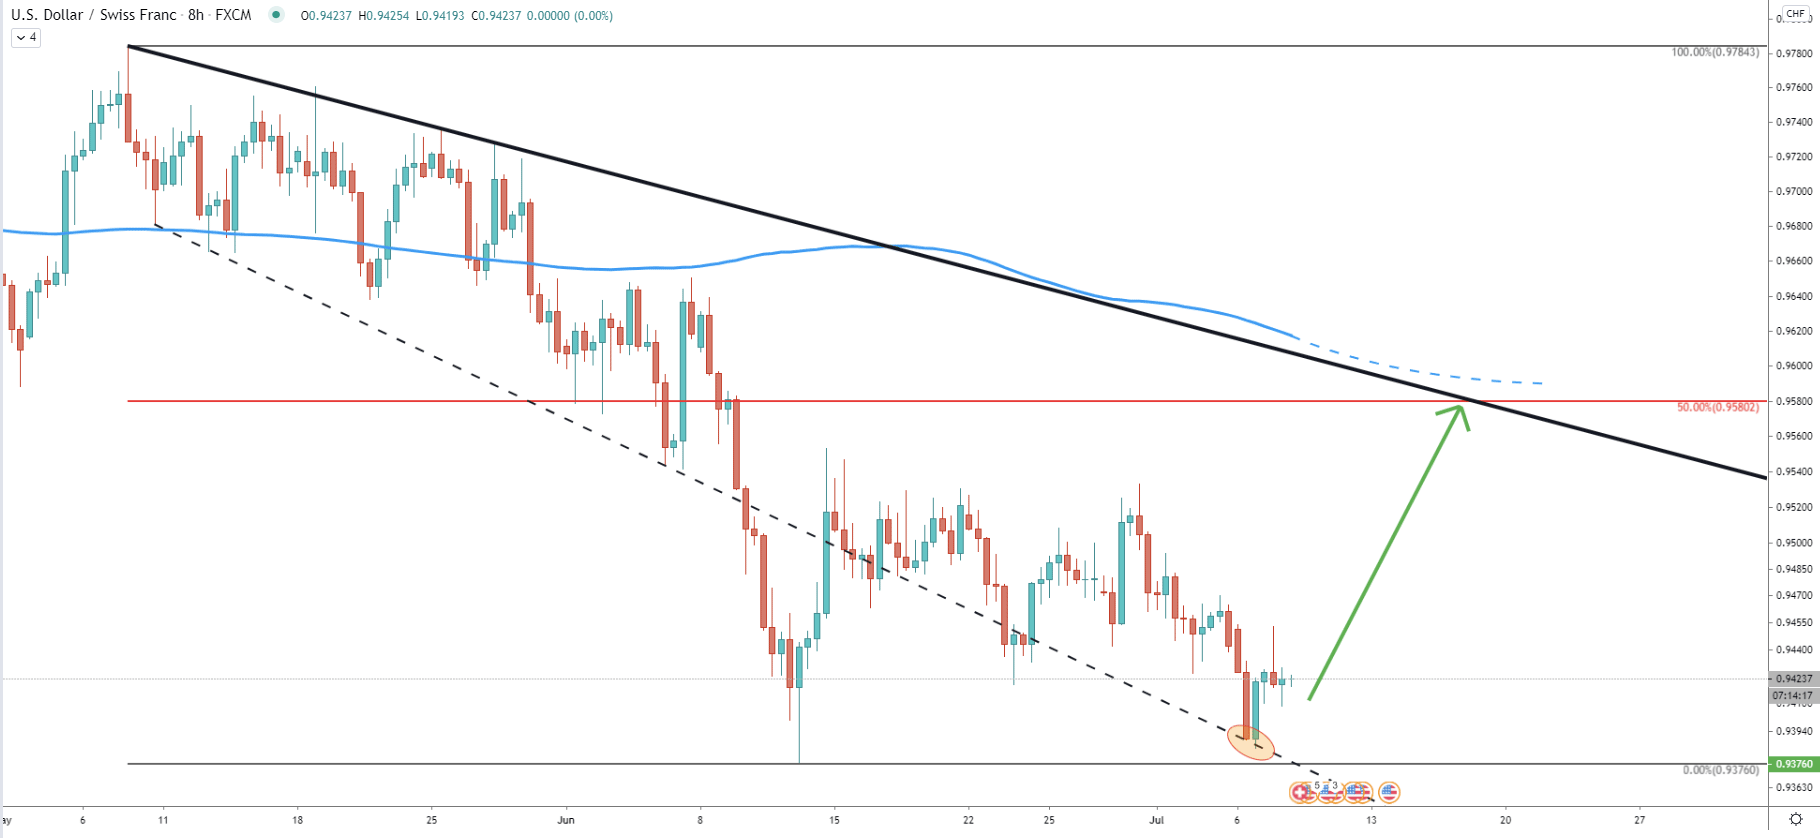
The 8-hour chart goes to show that the support downtrend trendline has been rejected after the pair have produced a double bottom. Therefore, the 0.9400 support area, could be very attractive for buyers. If that will be the case, the price might rise by 150 pips, and test 0.9580 resistance.
On this chart, the resistance corresponds to the 200 Exponential Moving Average as well as the downtrend trendline. It also shows that the upside target could be tested within the next couple of weeks.
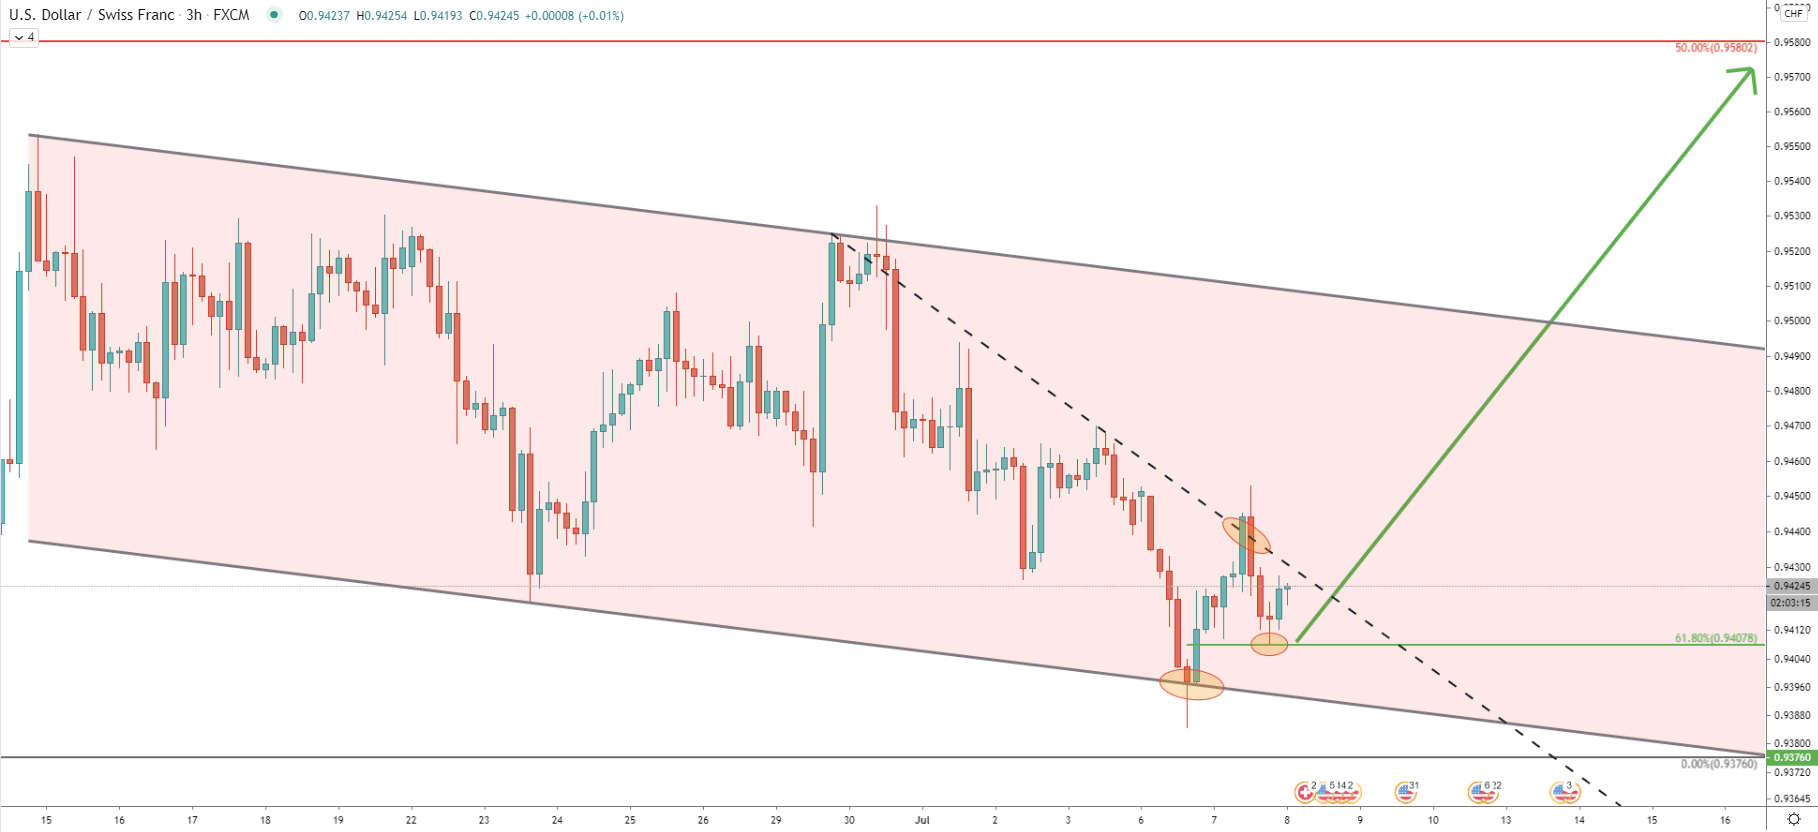
On the 3-hour chart, USD/CHF has reached and rejected the lower trendline of the descending channel, which clearly provided strong support. After, the price went up and broke above the downtrend trendline, which could have been a first confirmation of the bullish intentions of the pair. Following the breakout, the price corrected down and there was a very clean bounce off the 61.8% Fibs at 0.9407. This again confirms the strength of the 0.9400 psychological support, which has been defended strongly by the bulls.
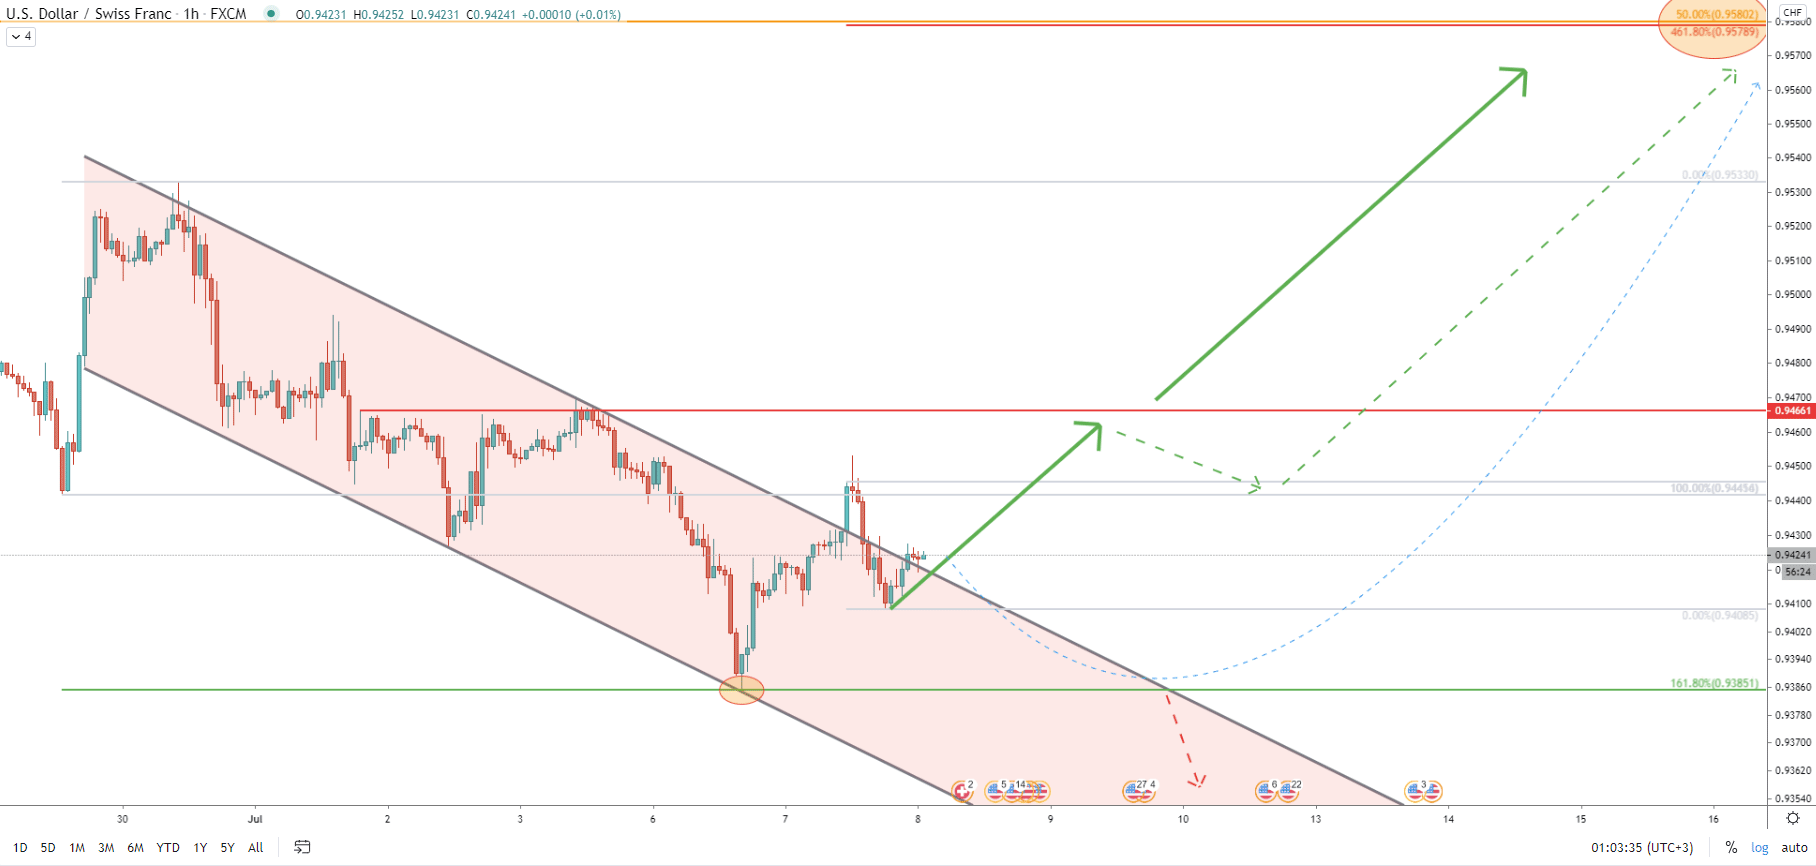
On the 1-hour chart, yet another descending channel was broken. We have presented multiple price development scenarios which can be expected this week. If the price will continue to respect 0.9400 support, there could be a non-stop corrective wave up. The first key resistance is seen at 0.9466 and if it gets broken, next will be 0.9580 area, which on this chart corresponds to two Fibs. First is 50% Fibs as per the daily chart, and the second is 461.8% Fibs applied to the current correction down.
At the same time price might break below the 0.9400 in order to re-test 0.9385 support. This is also a very important level which previously was rejected cleanly. It is confirmed by 161.8% Fibs applied to the 29-30 June wave up.
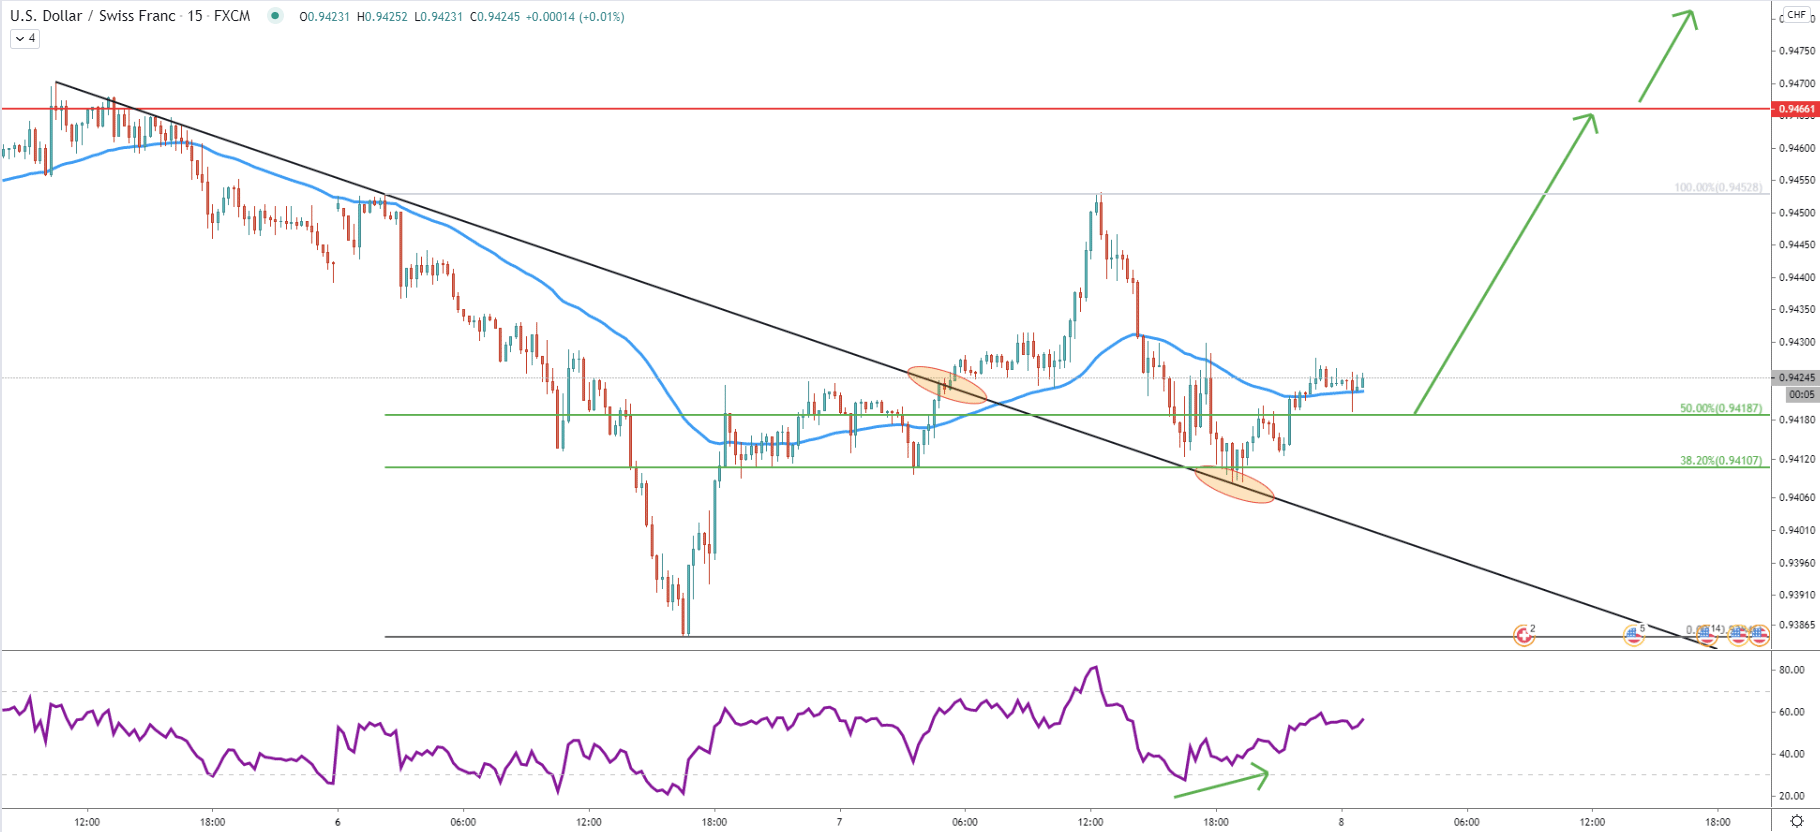
The 15-minute chart also shows a breakout, but this time its a downtrend trendline break. USD/CHF reached 0.9453 high and corrected down to 0.9410. This is a 38.2% Fibonacci support level, applied to the last wave down. It has been rejected along with the downtrend trendline, which has been acting as the support.
When a price has touched the trendline, the RSI formed a bullish divergence, suggesting a potential trend reversal. The 0.9400 yet again proved to be an extremely strong demand zone and while USD/CHF remains near this level, it might provide a good risk/reward buying opportunity.
The 0.9400 psychological support is proving to be a very strong demand zone. And as long as price remains above the 0.9385, USD/CHF can be expected to initiate a corrective wave up.
As per the Daily and Hourly chart, the key resistance and the potential upside target is seen at 0.9580, which is confirmed by 3 different Fibonacci retracement levels, the downtrend trendline, and 200 EMA.
As per the 1-hour chart, 0.9385 level could be very important, because it will help in determining future price development. 1-hour break and close below this support will invalidate potential upside correction and the long term downtrend can be expected to continue.
Support: 0.9385, 0.9400
Resistance: 0.9466, 0.9580