
Published: July 3rd, 2020
Today we have shared an idea on the USD/JPY with the second idea being the USD/CAD. What unites these ideas is the presence of the USD in both pairs, which brings us to the conclusion that the US Dollar could be starting to feel quite confident across the board. Let’s jump onto the analysis of the USD/CAD pair and observe the price action on 5 different timeframes.
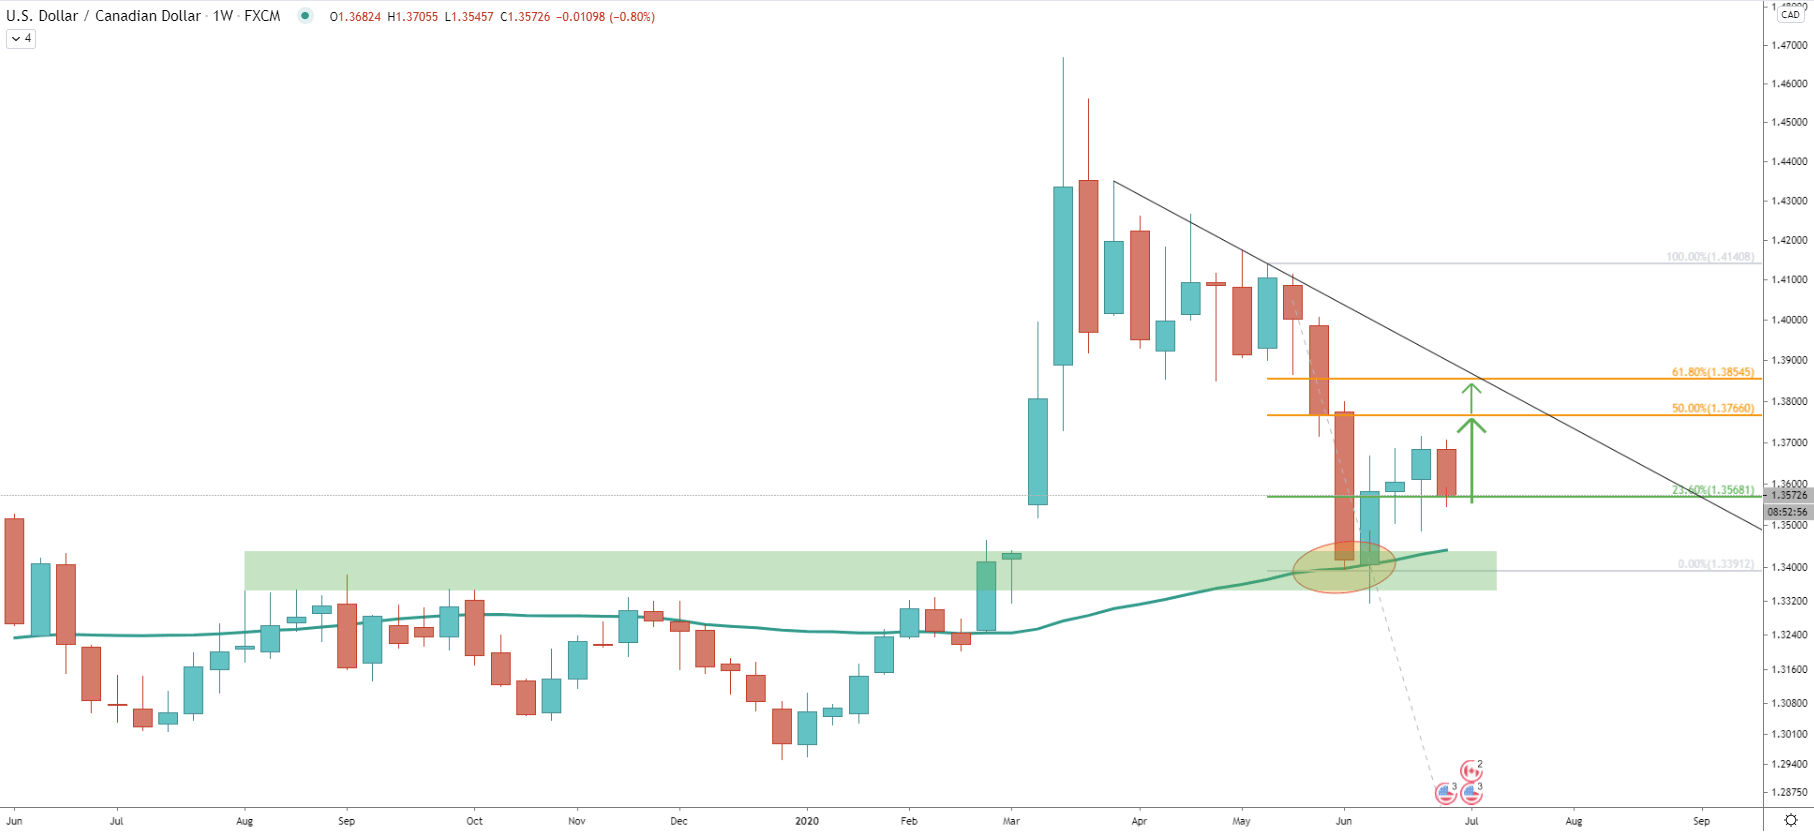
A month ago USD/CAD has reached the bottom while testing 1.3315 low. As we can see Weekly closing price remained above the 50 Simple Moving Average and clearly it was the point from where the price started to move up one again. We have applied the Fibonacci retracement indicator to the last wave down. It shows that the nearest support at 1.3568, which is 23.6% Fibs, and the nearest resistance at 50% Fibs, which is 1.3766. At this point, the probability is in favour of the price moving towards the resistance and below we’ll present more facts supporting this view.
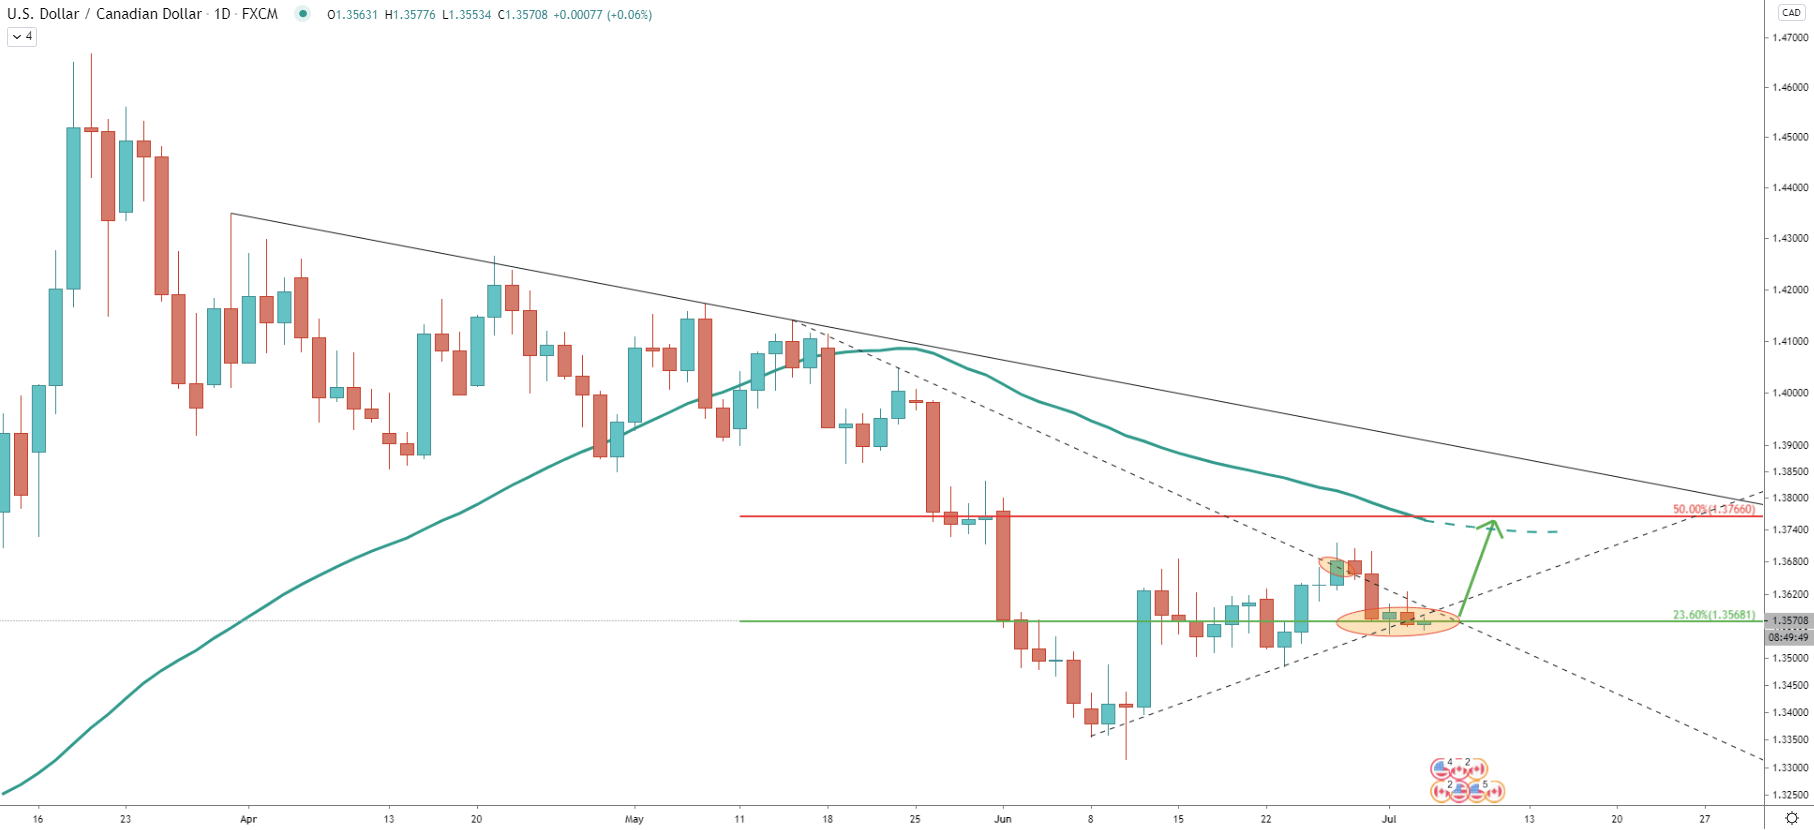
The 23.6% Fibonacci support at 1.3568 was cleanly rejected on the Daily chart. Price attempted to break lower but failed to close below the produced spike. This shows that bulls are defending this support area, which is also confirmed by the uptrend trendline.
Prior to that, price broke above the downtrend trendline, suggesting the validity of an uptrend on the short timeframe, and a correctional move up on a larger scale. The upside target here corresponds to the 50 SMA and could be the critical resistance in the medium term.
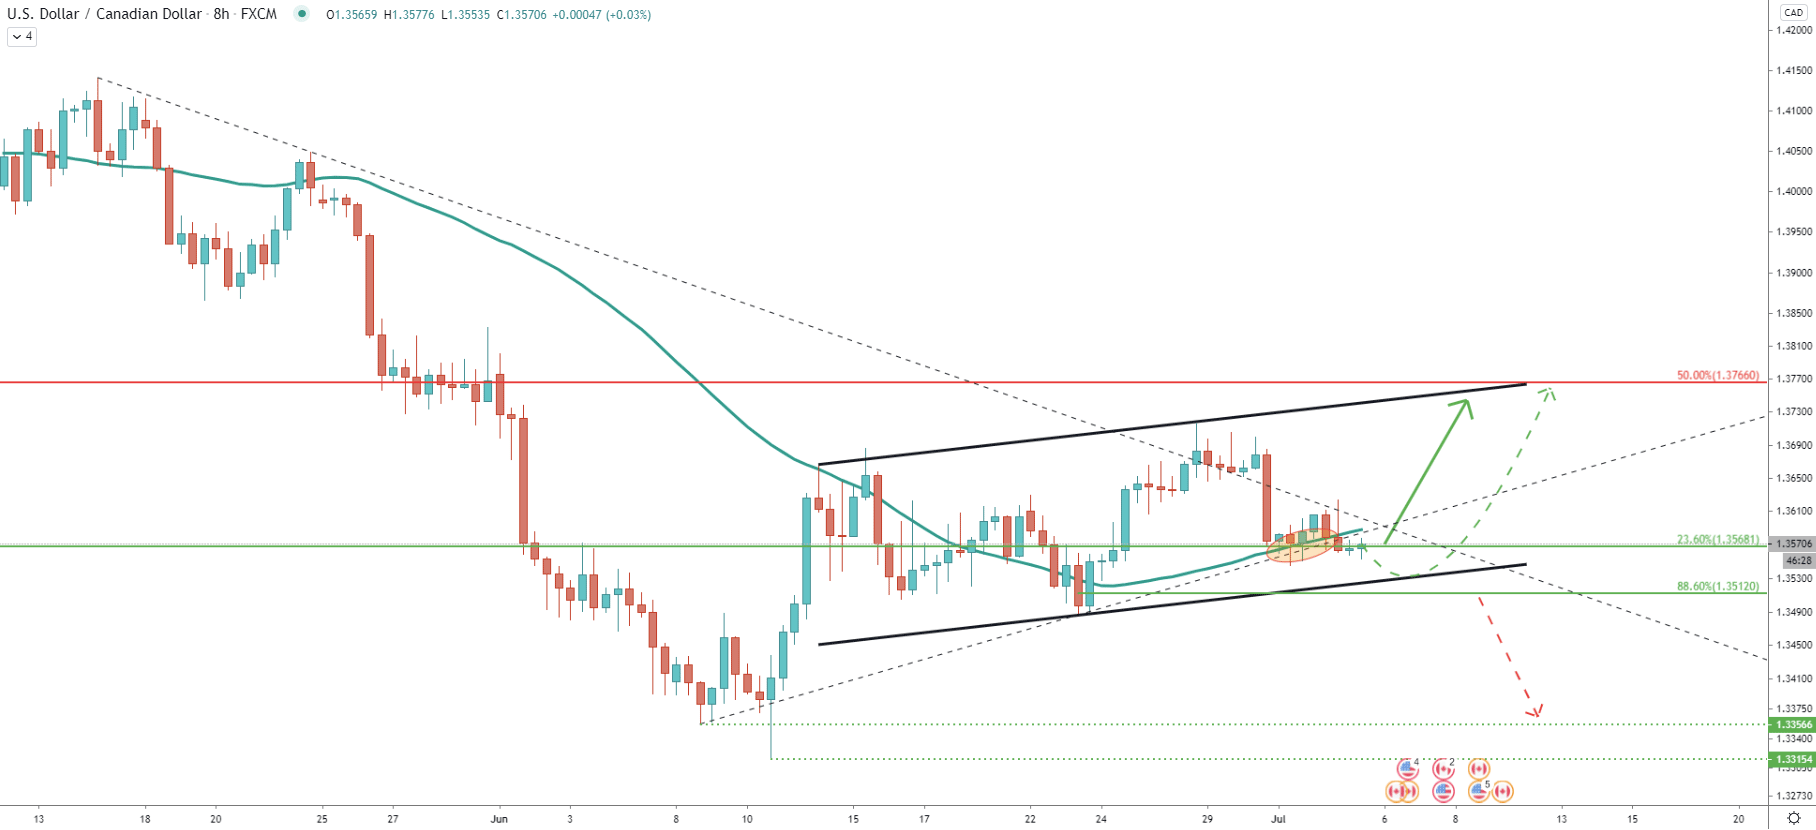
On the 8-hour chart, USD/CAD rejected the 50 SMA, which is currently acting as the support along with the uptrend trendline. But there is still a risk of the price spiking down, to test the lower trendline of the ascending channel, and perhaps 88.6% Fibonacci retracement support at 1.3512. However, considering current price action the probability of further decline at this stage remains low. As long as the Daily close is above the recent low at 1.3545, USD/CAD should be expected to rise towards previously mentioned resistance level, which clearly corresponds to the upper trendline of the ascending channel, or in other words to the resistance uptrend trendline.
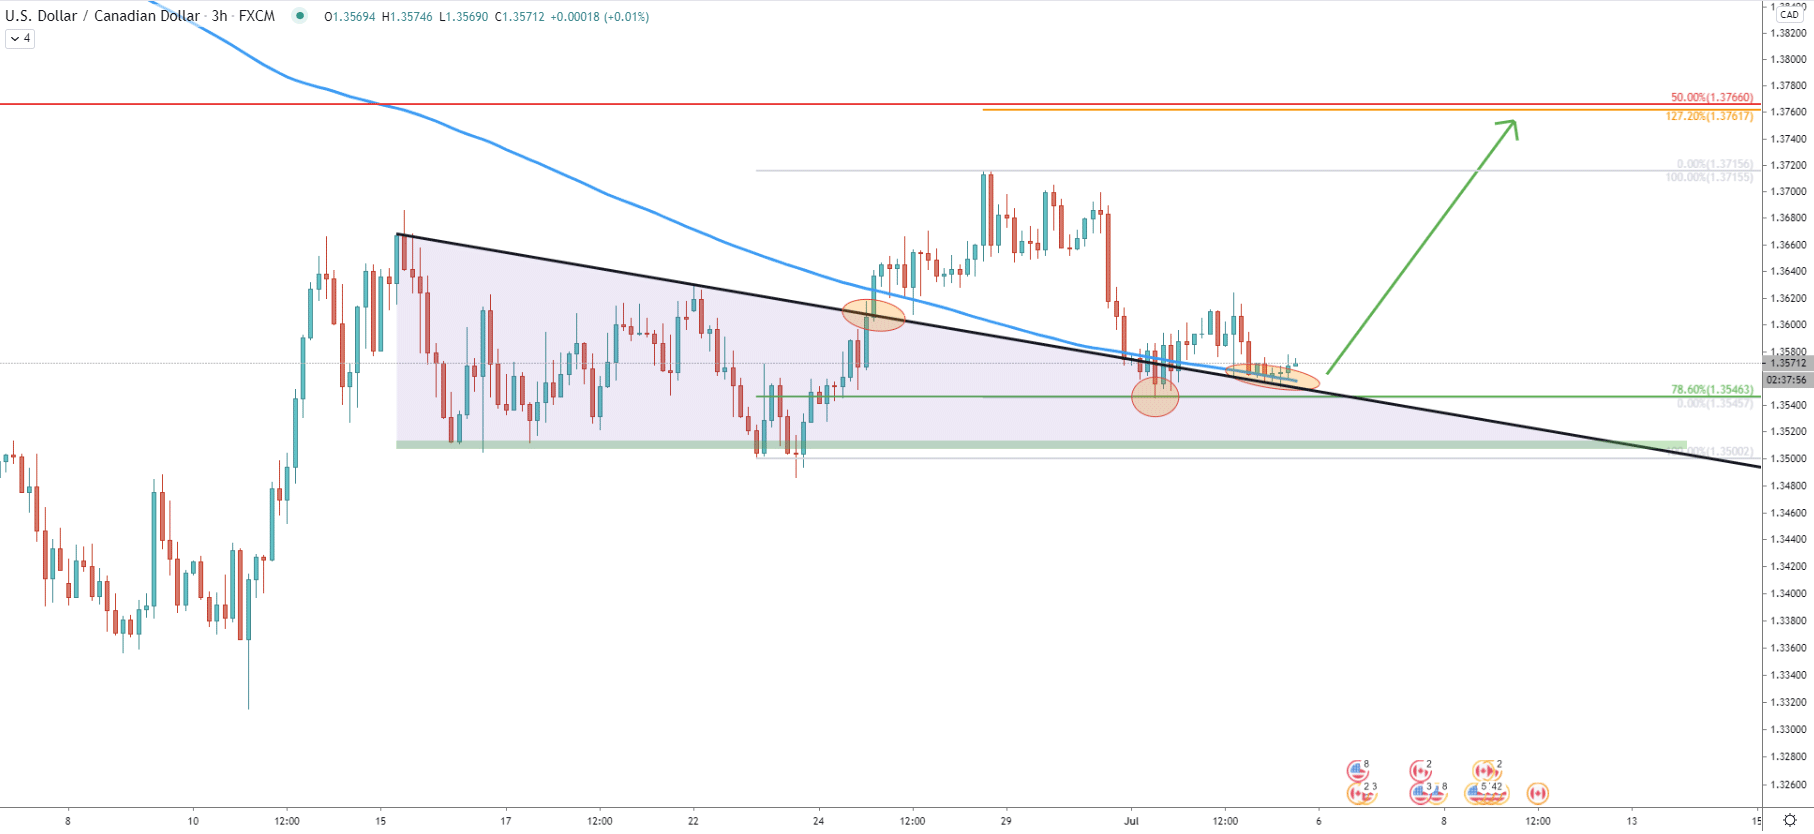
On the 3-hour chart, USD/CAD broke above the 200 Exponential Moving Average as well as triangle pattern and reached 1.3715 high. But then price corrected and found the support precisely at 78.6% Fibs, which is 1.3545. Right now, price is rejecting the previously broken downtrend trendline and EMA, both of which clearly acting as the support.
We have applied the Fibonacci retracement indicator to the current corrective wave down, and it goes to show that 127.2% Fibs almost exactly corresponds to the previously mentioned resistance area near 1.3760. Considering that the support currently is being respected, USD/CAD could be moving up any time, potential by 200 pips.
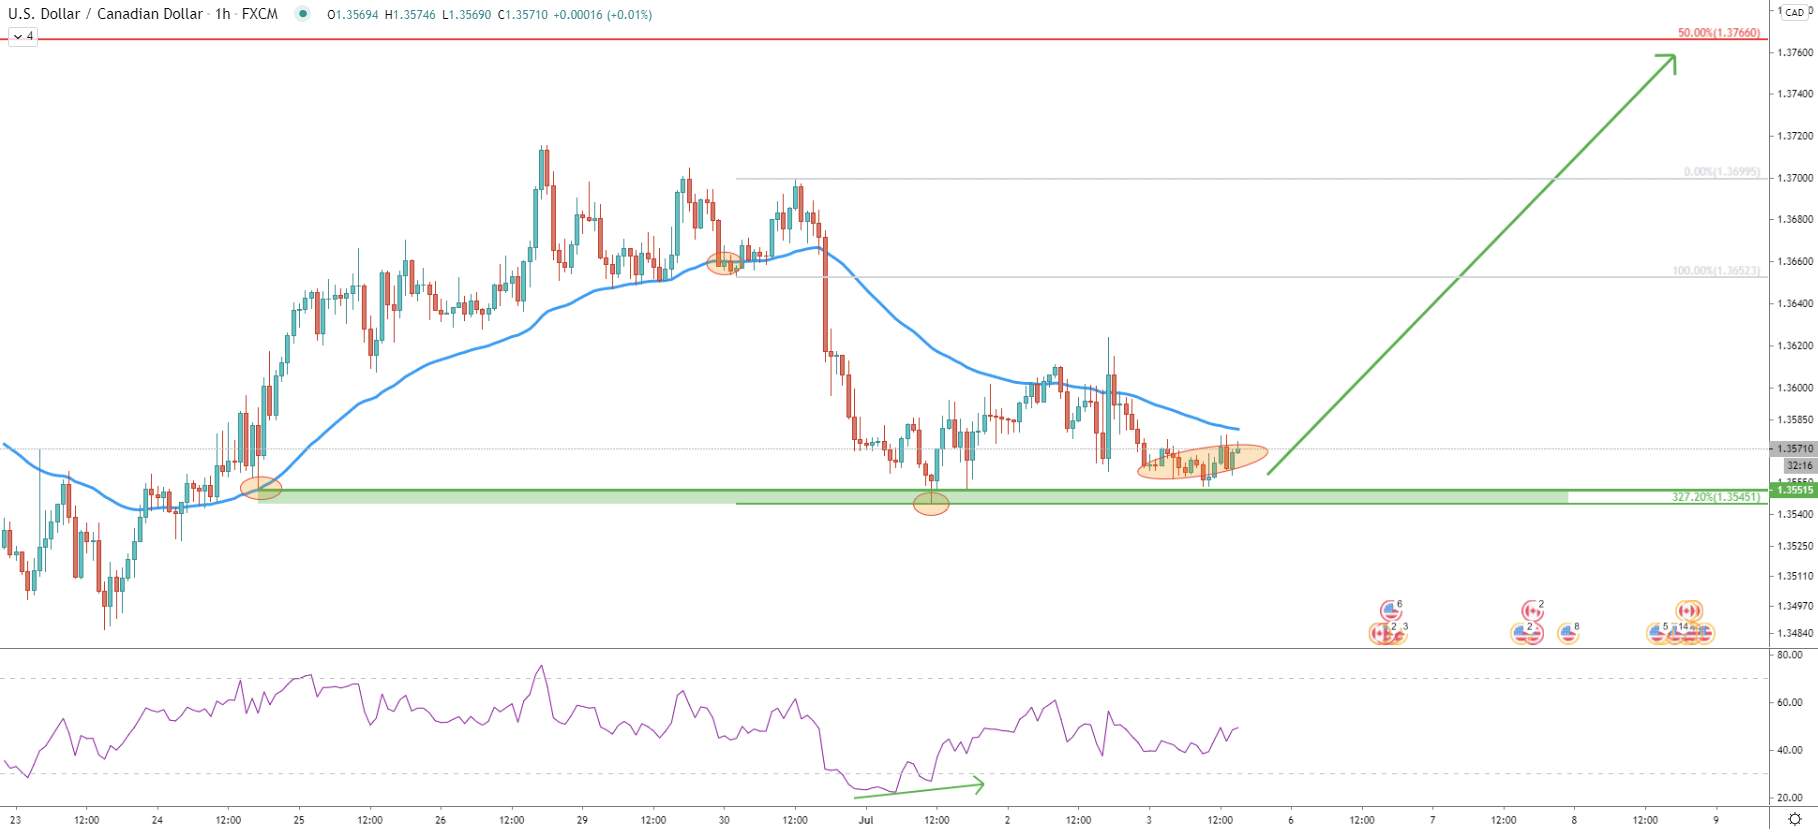
Finally, it is the 1-hour chart, where Fibonacci was applied to the correctional move up after price broke below the 50 EMA. The very important factor here is the clear rejection of the 327.2% retracement level at 1.3545. Besides after the bounce, the RSI oscillator formed a bullish divergence and price broke above the EMA. All these facts strongly suggest a potentially incoming upside move. Obviously such a scenario can only be expected as long as price stays above 1.3545 low.
USD/CAD rejected multiple support levels and indicators, which goes to show that buyers don’t allow the price to go any lower. The key level currently is at 1.3545, which could have been the lowest low before the next wave up.
As per the Daily and 3-hour charts, the strong resistance and the potential downside target is located at 1.3760 area. If this resistance will get broken, USD/CAD might confirmed the long term uptrend continuation.
As per the 8-hour chart, there is a possibility that the price will move lower to test the bottom of the ascending channel and 88.6% Fibonacci retracement level at 1.3512. This makes a 1.3500 psychological level a very important support area. If the price manages to break below it, USD/CAD certainly can be expected to continue trending down, potentially testing 1.3300 area once again.
Support: 1.3568, 1.3545, 1.3512
Resistance: 1.3652, 1.3700, 1.3760