
Published: August 11th, 2020
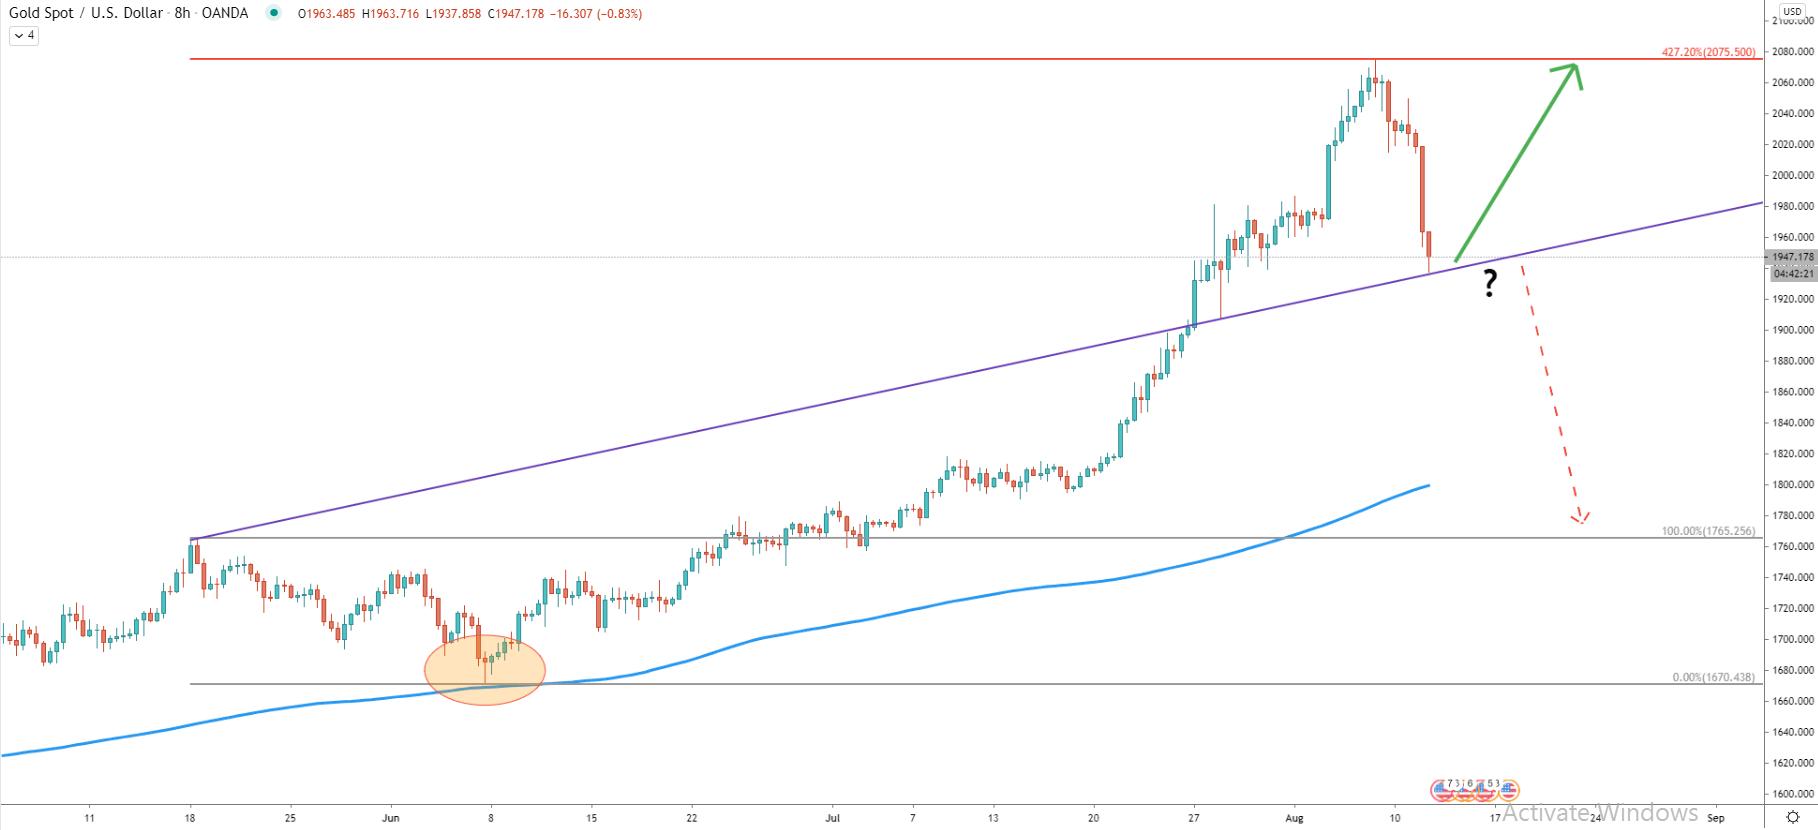
We will start by looking at the price of Gold because it might help to understand the direction of the USD. The price of Gold reflects the overall US Dollar value or in other words, the purchasing power of the Dolar.
On the August 7, XAU/USD has reached the high at 2075 where it cleanly rejected the 427.2% Fibonacci resistance level. Such a bounce resulted in a sharp corrective wave down, which might provide a buying opportunity once again. This is because today Gold approached the average-price uptrend trendline and could be about to continue trending upwards if it will get rejected.
What does it mean for the xxx/USD pairs? Well, most if not all pairs might follow the path of the weak USD, and the AUD/USD is not an exception. Lets’ observe the price action of the AUD/USD on 4 different timeframes.
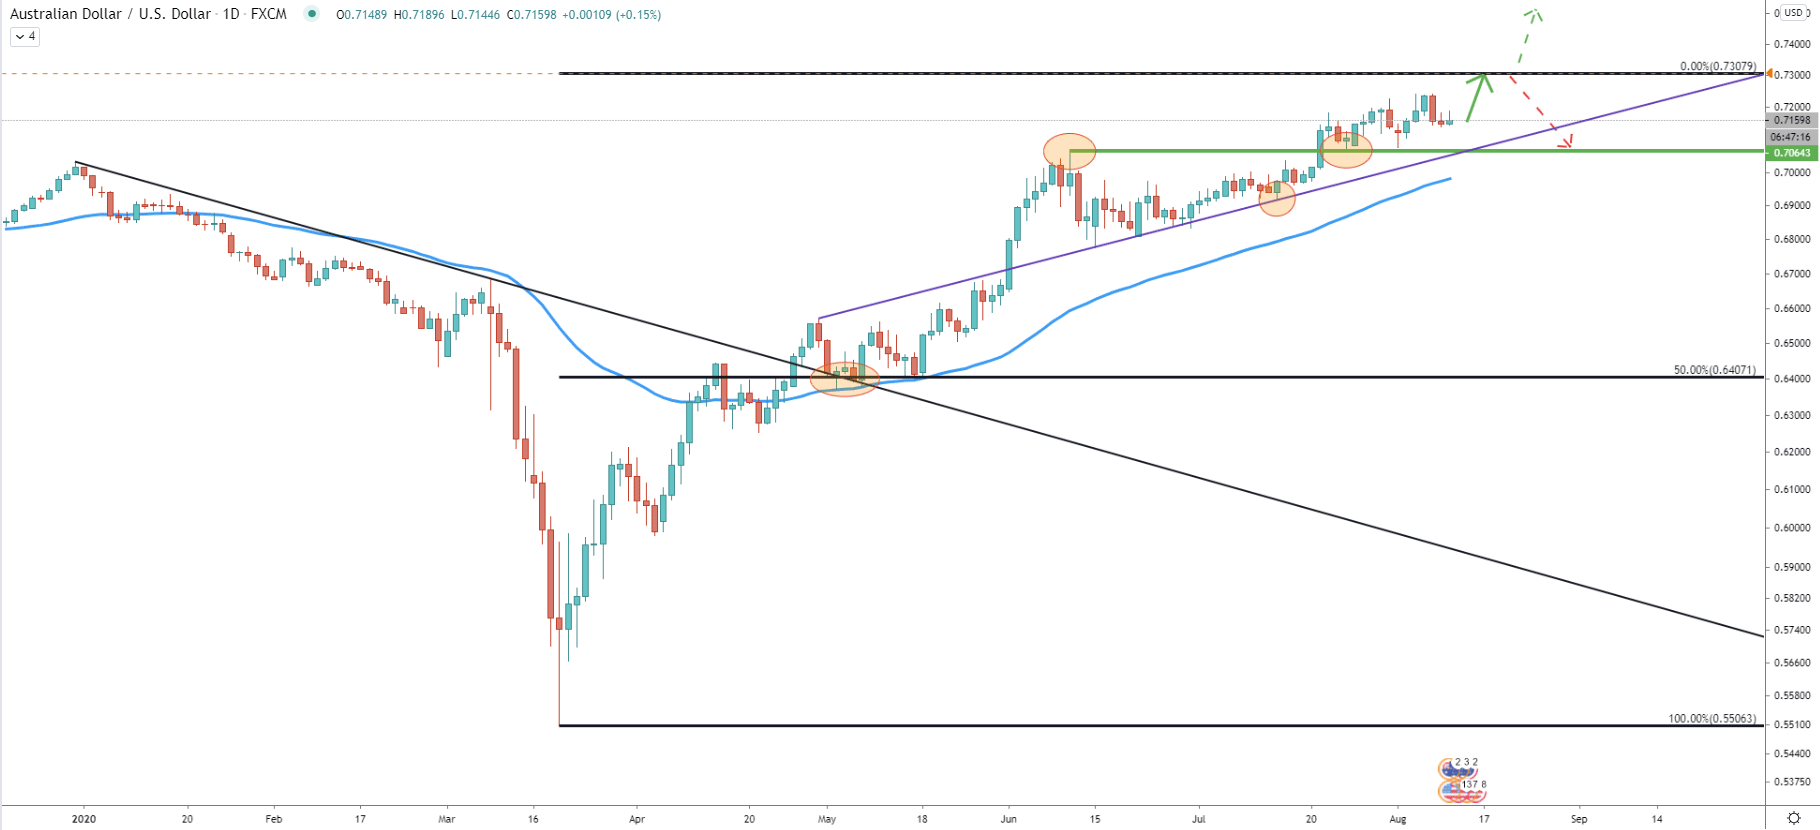
Fibonacci retracement indicator was applied to the downtrend trendline breakout point where 50% was placed to the price where the downtrend trendline was rejected along with the 200 Exponential Moving Average. It shows that the final upside target at 0.7308 is yet to be tested, meaning there is still some room for growth.
Also, similar to the XAU/USD, the AUD/USD continues to reject the average-price uptrend trendline and producing higher highs and higher lows. Currently, price found the support at the previous level of resistance, which is 0.7064. And as long as price remains above this level, uptrend will continue, either slow or fast.
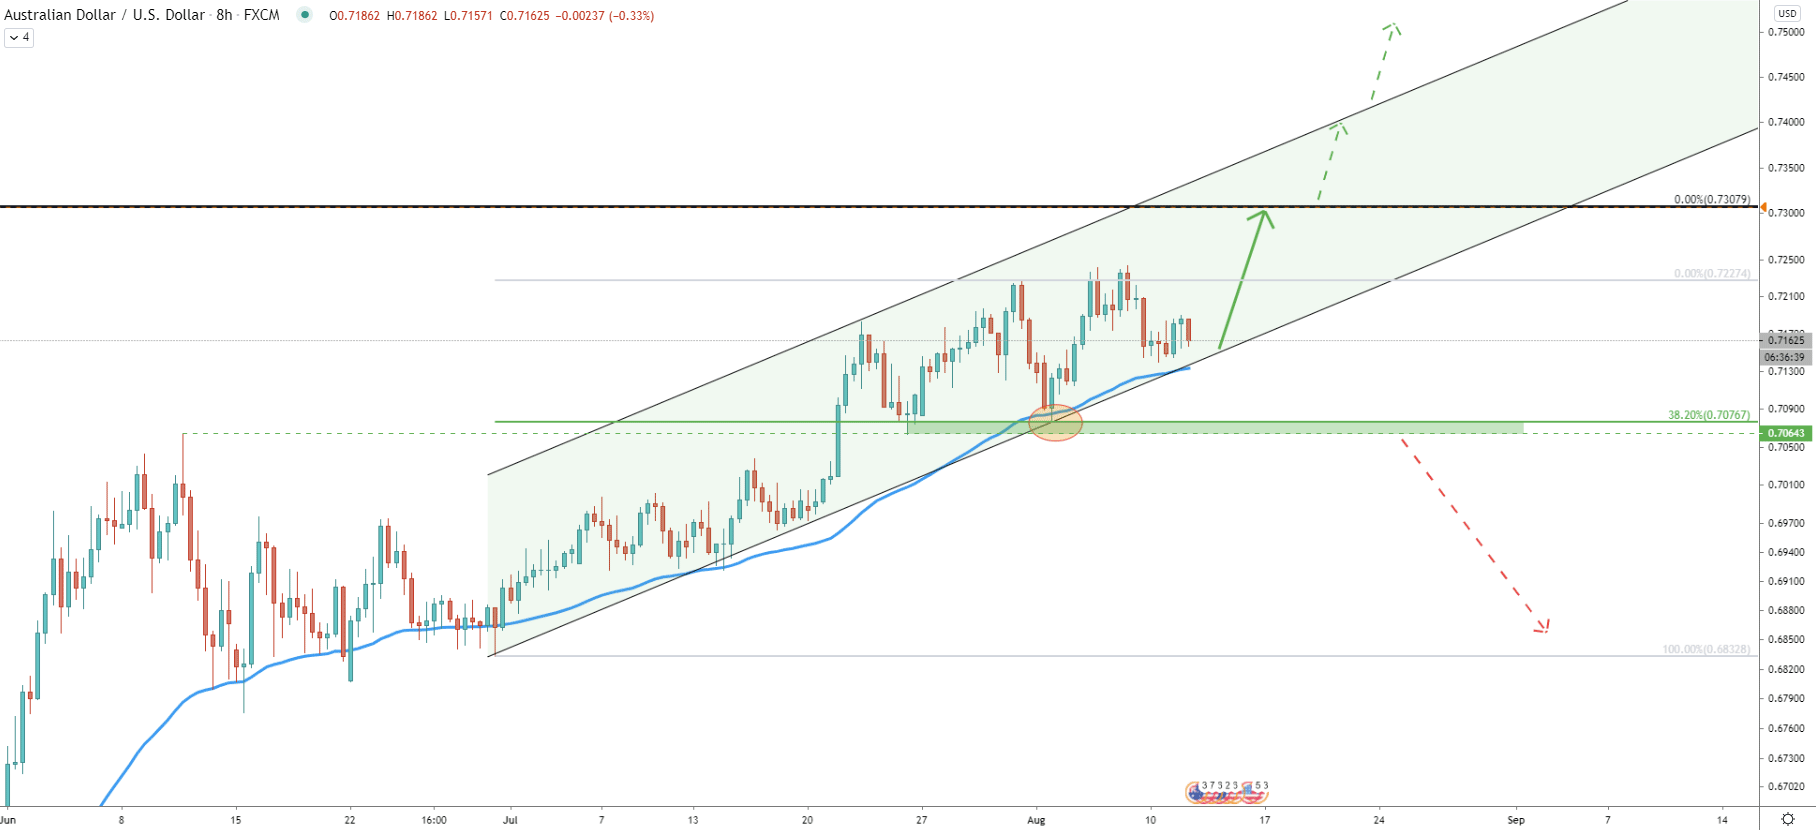
AUD/USD moves within the ascending channel and on the August 3, price bounced off the lower trendline of the channel as well as 50 Exponential Moving Average. Clearly, the massive support area has been formed near 0.7076, which also the previous level of resistance.
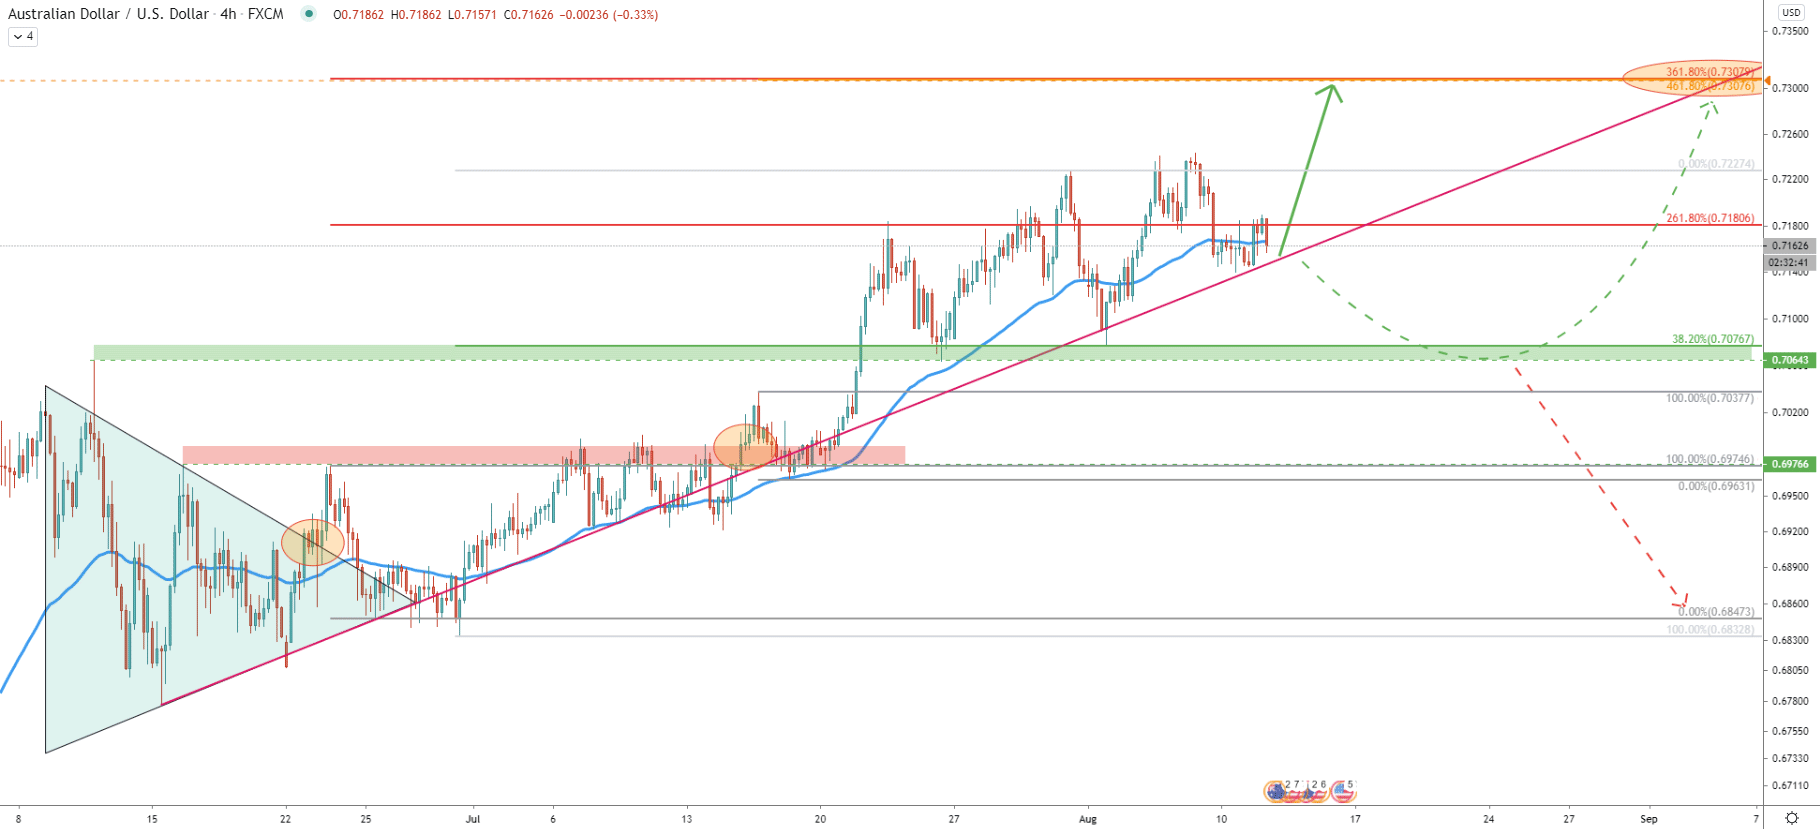
Perhaps the most information on the medium-term price action we can get from the 4-hour chart. Here we have applied two Fibonacci retracement levels. First to the corrective wave down after price broke above the triangle pattern. The second was applied to the corrective wave down after price broke above the 0.6974 resistance area.
We can see that 361.8 and 461.8% Fibs are located at 0.7307, which is exactly where the 0% Fibs (final upside target) is located as per the Daily chart. Now we have 3 different Fibonacci indicators pointing out to the 0.7300 psychological resistance area, which should be the nearest and perhaps the final upside target.
Nonetheless, there might be a consolidation period, where the price will re-test the 0.7076 area, but this only could happen if price breaks below the recently printed low at 0.7140.
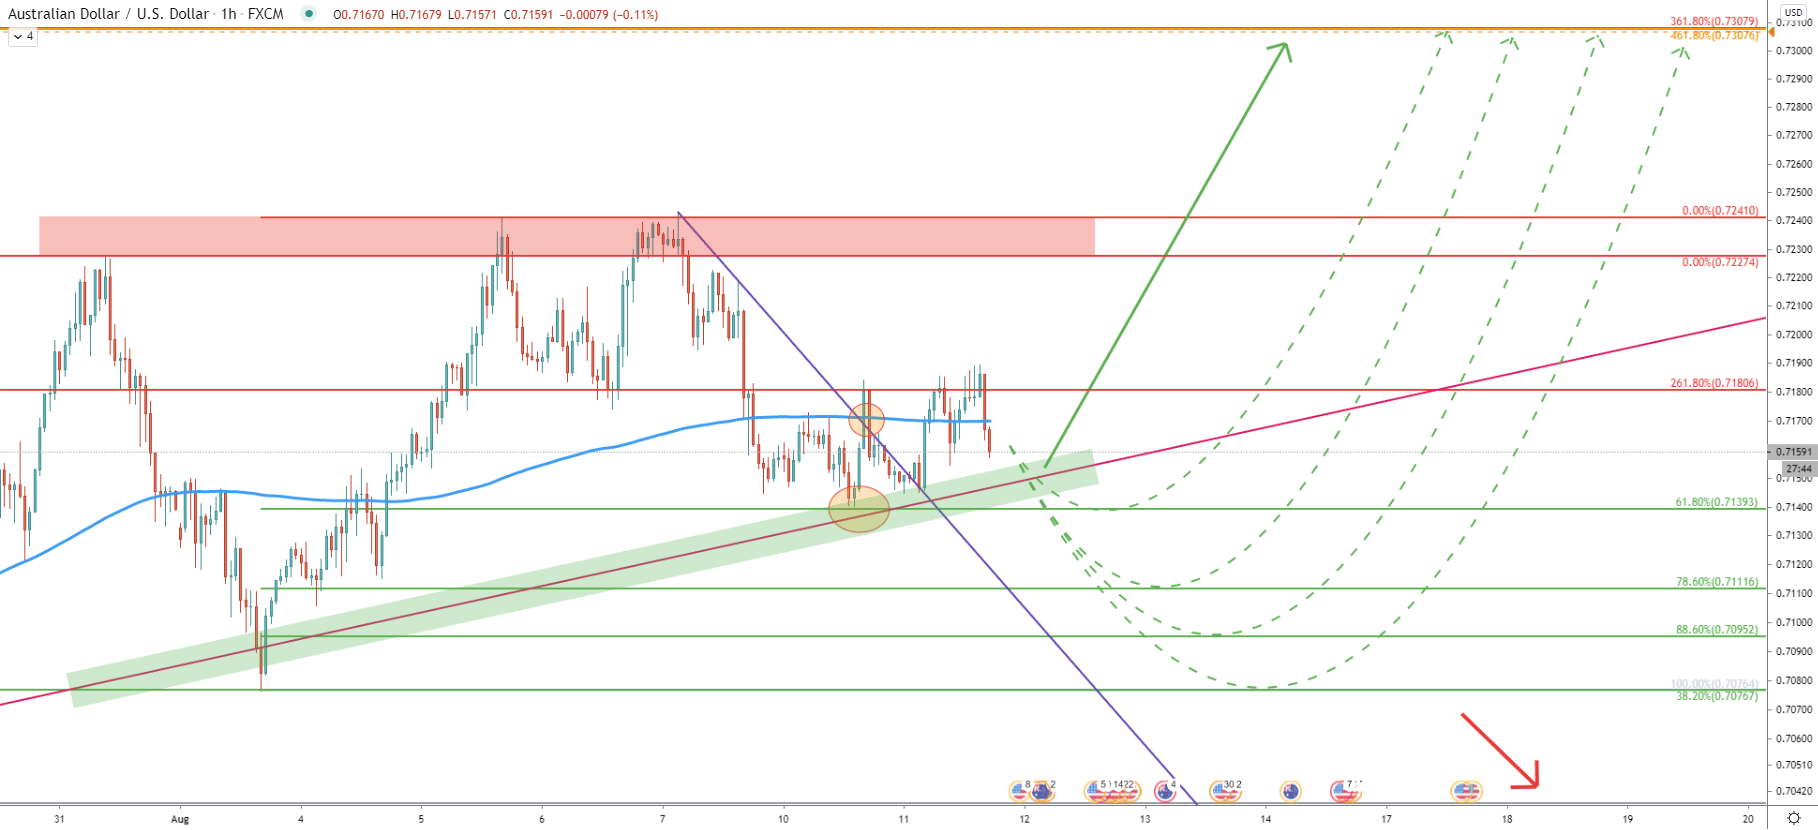
Upon the break and close below the 0.7140 there are multiple scenarios where price cold decline towards one of the Fibonacci support levels before/if uptrend will continue. However, considering the recent rejection of the 61.8% Fibs at 0.7139, the probability remains highly in favour of the uptrend continuation from the current price. Atlhghoug spikes below the 0.7140 support could also be expected.
The AUD/USD long term trend remains very bullish, and based on the 1-hour chart analysis, the price has cleanly rejected the Fibonacci support as well as the uptrend trendline. The next upswing could be starting any time this week, as long as price remains above 0.7140.
The key resistance and the nearest upside target is located at 0.7307, which is confirmed by 3 different Fibonacci retracement levels. It is worth mentioning that the resistance is based extremely close to the 0.7300 psychological price, and could be very attractive for the short term sellers.
It has been mentioned that further price decline can be expected, where AUD/USD could decline even to the 0.7076 support level. But only the Daily break and close below, will immediately invalidate the bullish scenario and price can continue to decline towards the 0.6850 support area as per the 4-hour chart.
Support: 0.7140, 0.7111, 0.7095, 0.7076
Resistance: 0.7180, 0.7227, 0.7241, 0.7307


