
Published: July 16th, 2025
U.S. Bancorp reported $6.93 billion in sales the previous quarter, increasing 3.6% year over year and 0.5% above analysts' revenue projections. The company had a split quarter, missing analysts' substantial financial value per share projections but beating their EPS estimates by a respectable margin.
Analysts predict that U.S. Bancorp's sales will increase 2.7% year-on-year to $7.03 billion in the current quarter, reversing the 5% decline it saw in the same period last year. It is anticipated that adjusted earnings will be $1.07 per share.
Some of U.S. Bancorp's competitors in the specialised banking sector have already released their second-quarter results, which gives us an idea of what to expect. JPMorgan Chase recorded a revenue drop of 10.5%, exceeding projections by 2.9%, while Citigroup delivered a year-over-year revenue increase of 8%, exceeding expectations of analysts by 3.5%.
The investor mood in the diverse banking industry has been positive, as evidenced by the average 8.3% increase in share value over the past month. U.S. Bancorp has risen 5.9% throughout the same period and is expected to report profits at a median analyst market target of $52.83, which is higher than its current price per share of $45.70.
As long as the expense is reasonable, a corporation repurchasing its own shares may be a prudent move when it has more money than it knows what to do with. Fortunately, we have discovered one: a cheap stock that is both repurchasing shares and generating free revenue.
Let's see the further outlook from the USB technical analysis:
In the daily chart of USB, a bullish V-shaped recovery is evident as the price rebounded from the bottom at the 35.21 level. Moreover, a sideways momentum is clear at the top, which signals buyers' dominance in the market.
In the higher timeframe, a long consolidation is evident as the price trades within the 2021-2024 range. As the most recent price is trading at the 50% Retracement level of the long range, we may need more confirmation before anticipating a stable trend. In the weekly timeframe, the price is trading bearish after two consecutive bullish weeks, which signals a possible bearish corrective pressure.
In the volume structure, the broader market pressure is bearish as the high volume line since November 2024 is above the current price. As the recent price has shown a bullish reversal from the yearly low, a bullish recovery above the high volume line might validate the trend continuation signal.
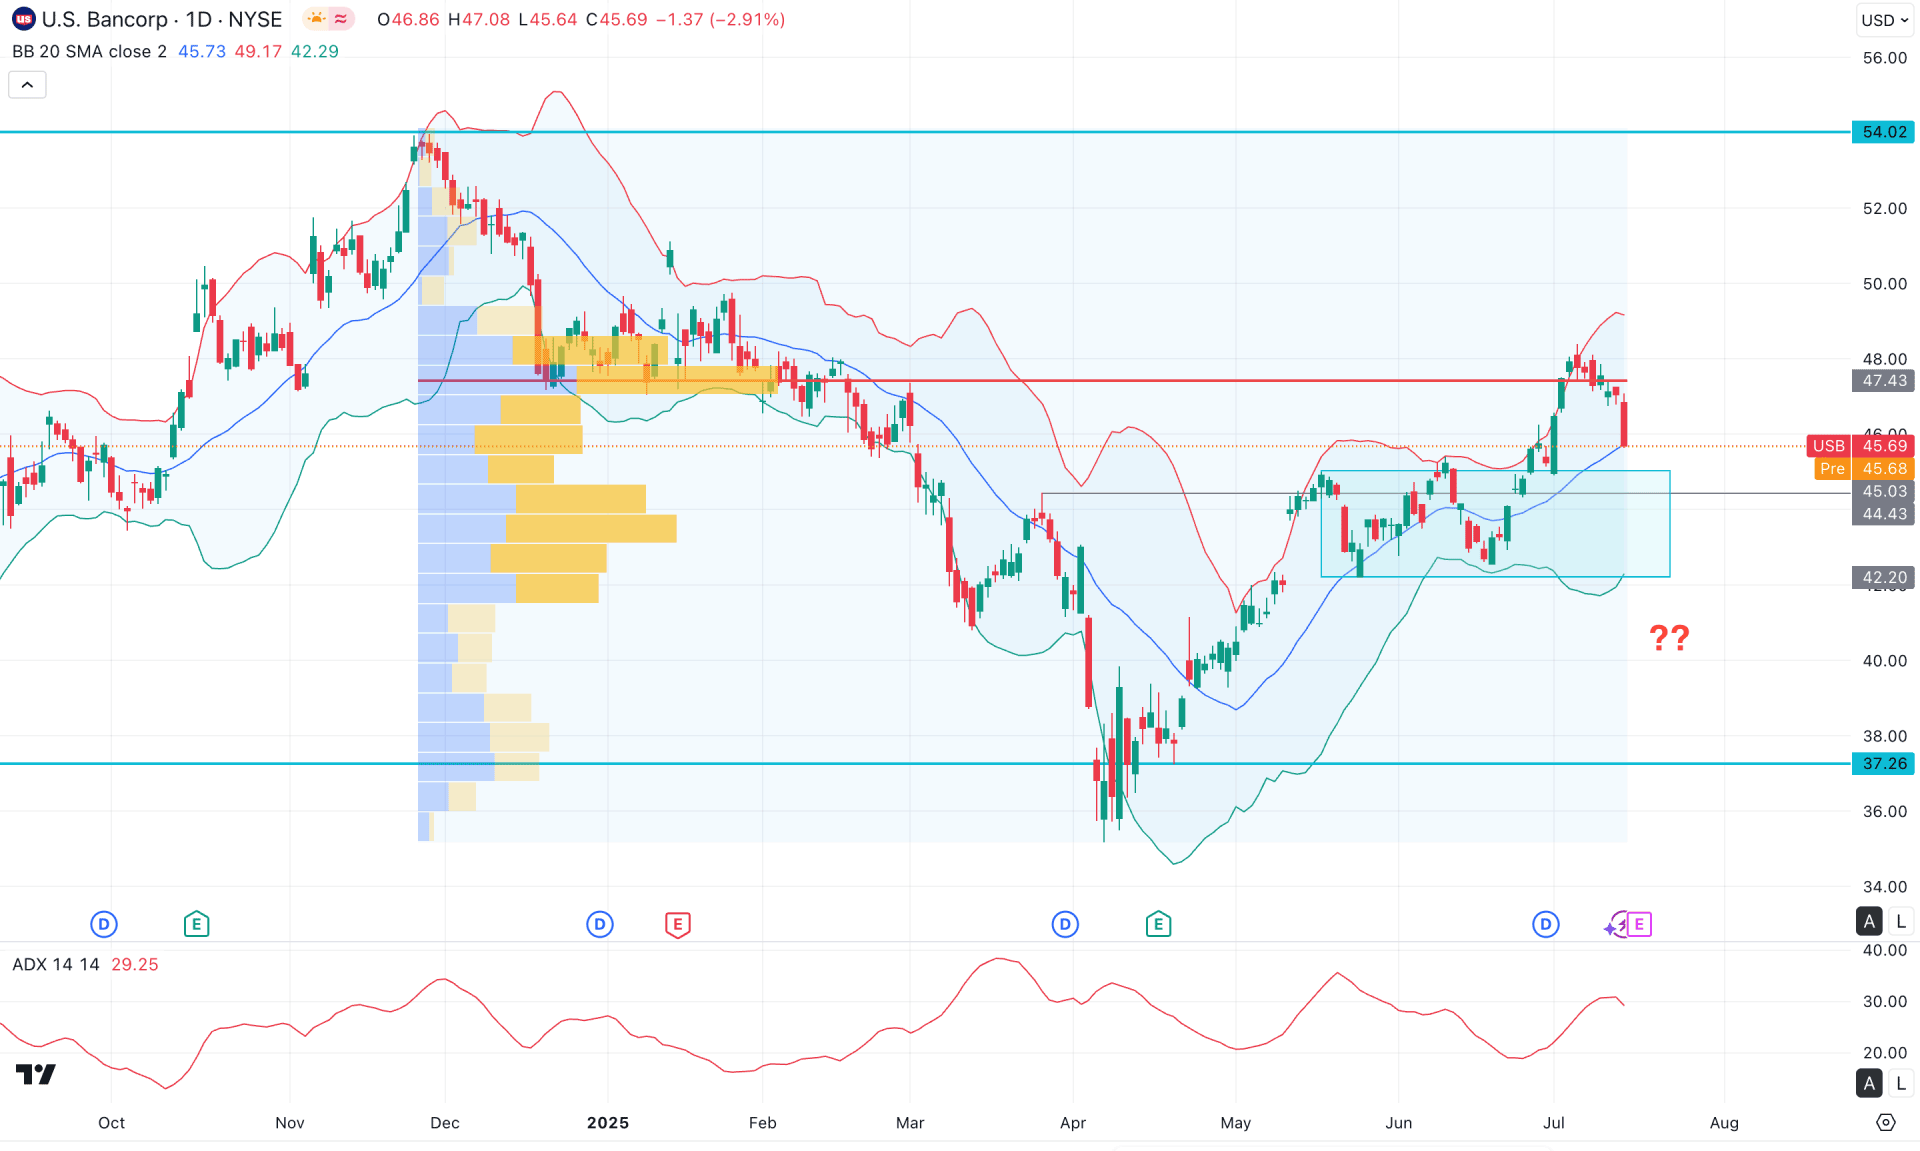
Examining the main price chart, the most recent movement indicates a bullish rectangle pattern breakout before reaching the upper Bollinger Band resistance.
After reaching a high at the 48.38 level, the price continued to move lower from the high-volume line and is currently hovering around the mid-Bollinger Band level. However, the price action remains above the rectangle pattern, signalling active buyers.
In the indicator window, the Average Directional Index (ADX) shows a stable reading around the 30.00 level. As long as the ADX remains above 20.00, we may expect the bullish momentum to continue. Moreover, the Relative Strength Index (RSI) has pulled back from the 70.00 overbought level and reached the neutral 50.00 line. This is an early sign of a potential top formation, which may lead to further downside pressure.
Based on the broader market outlook, the bullish breakout above the 45.03 level is currently facing resistance from the high-volume area at 47.43. In this scenario, the price is encountering downward pressure from the Bollinger Band resistance, which signals a possible bearish continuation within the rectangle zone. As the price fails to sustain buying pressure above the high-volume line, we may expect the downside to extend, with the ultimate target being the rectangle support at the 42.20 level.
On the other hand, a bullish rebound is possible if the price breaks above the 47.43 level with a strong daily close. Alternatively, a bearish corrective move followed by a bullish reversal from the 45.00–44.00 area is also possible. In that case, the price may offer a long opportunity once it stabilises above the 50-day Exponential Moving Average (EMA).
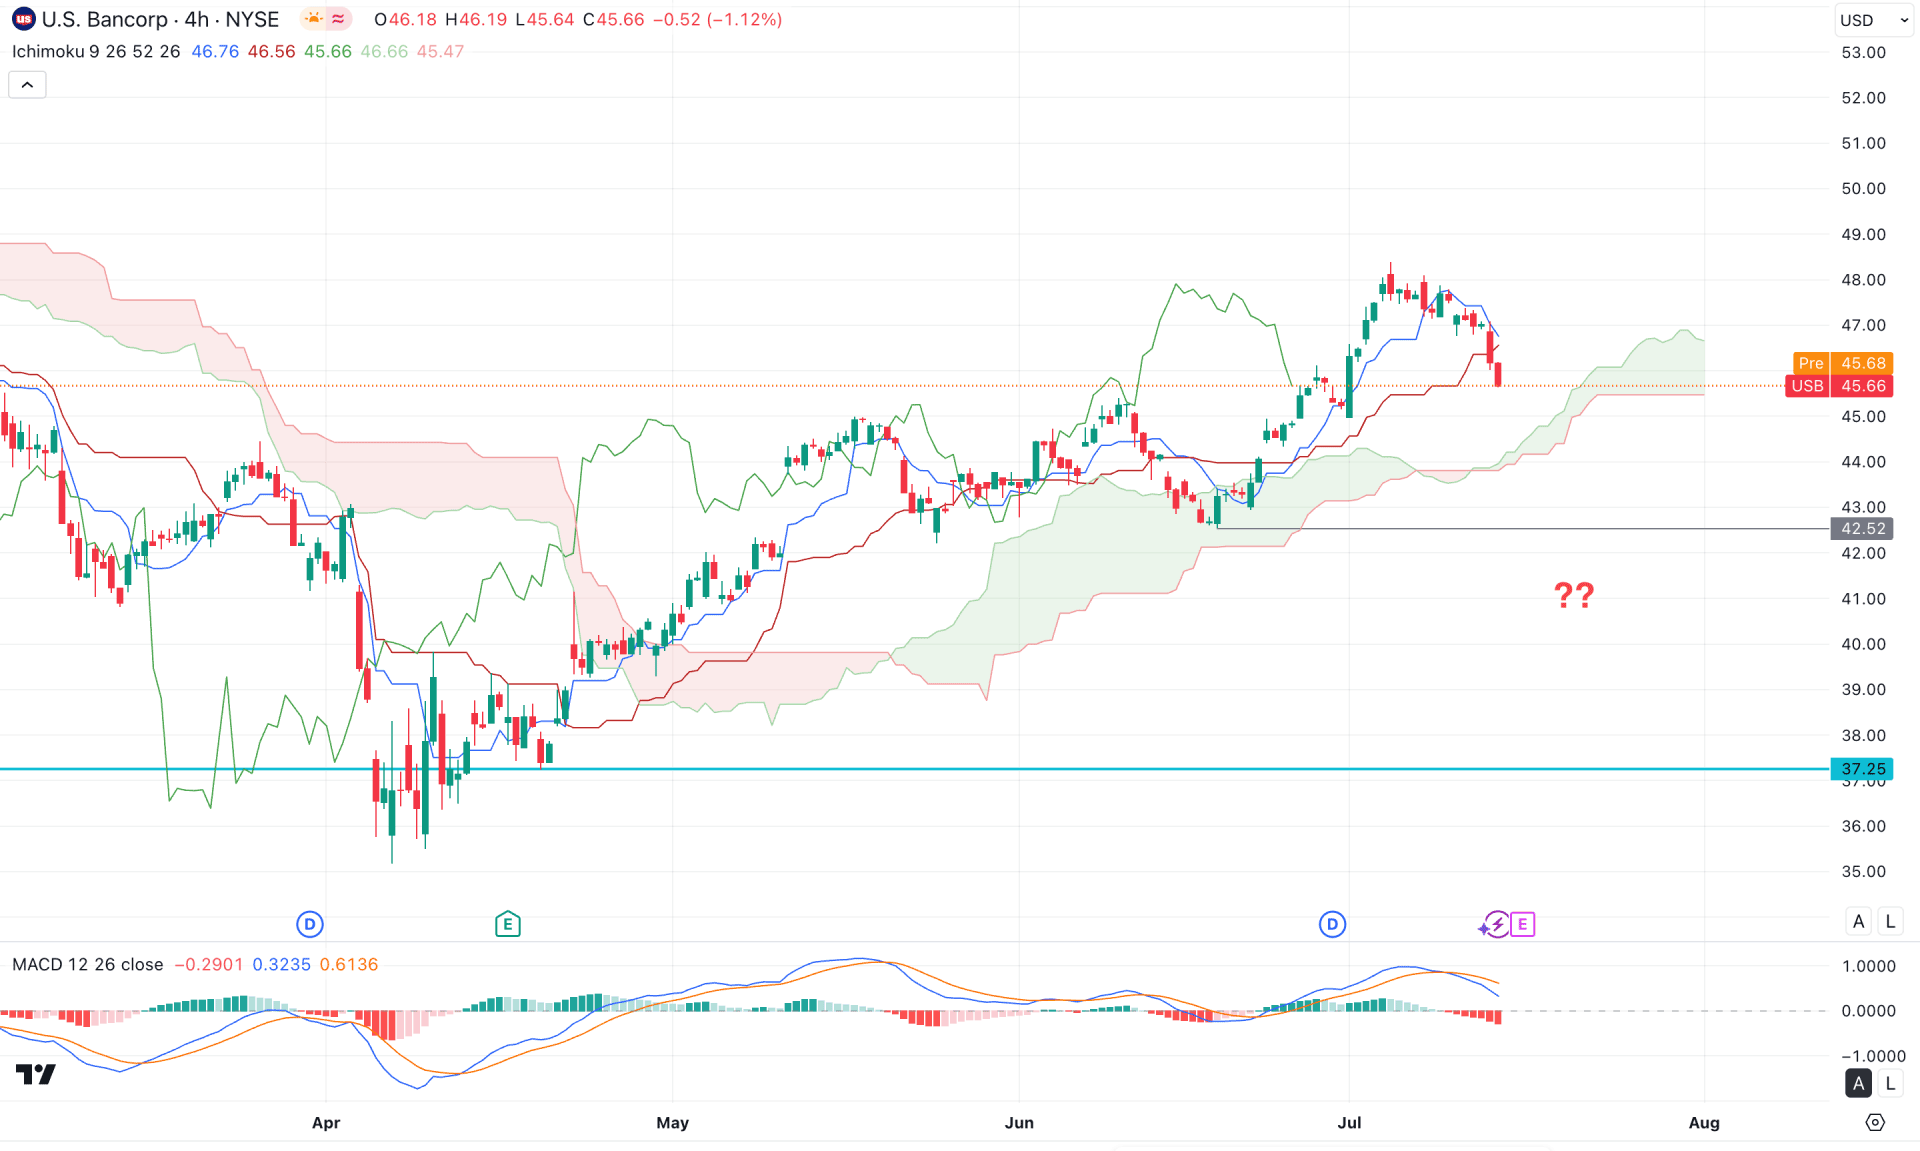
In the four-hour timeframe, the existing market structure remains bullish, as consecutive higher highs are visible above the Kumo cloud area. However, the most recent price action failed to maintain momentum above the dynamic line, with several consecutive four-hour candles closing below the Kijun-sen level. Meanwhile, the Senkou Span A and B lines have flattened in the future cloud, while the Chikou Span has started to move lower.
In the secondary indicator window, the MACD signal line failed to create a new swing high and formed a bearish divergence with the main price. Moreover, the vertical histogram has moved lower, forming consecutive bearish bars.
Based on the overall market structure, investors should closely monitor how the price reacts near the cloud level. Immediate selling pressure with a four-hour candle close below the 42.52 level could invalidate the bullish setup and drive the price down toward the 36.00 level.
On the other hand, a bullish rebound is possible from the 45.00–42.00 support area. In that case, a stable price above the Kijun-sen level, followed by consolidation, could extend bullish pressure toward the 52.00 level.
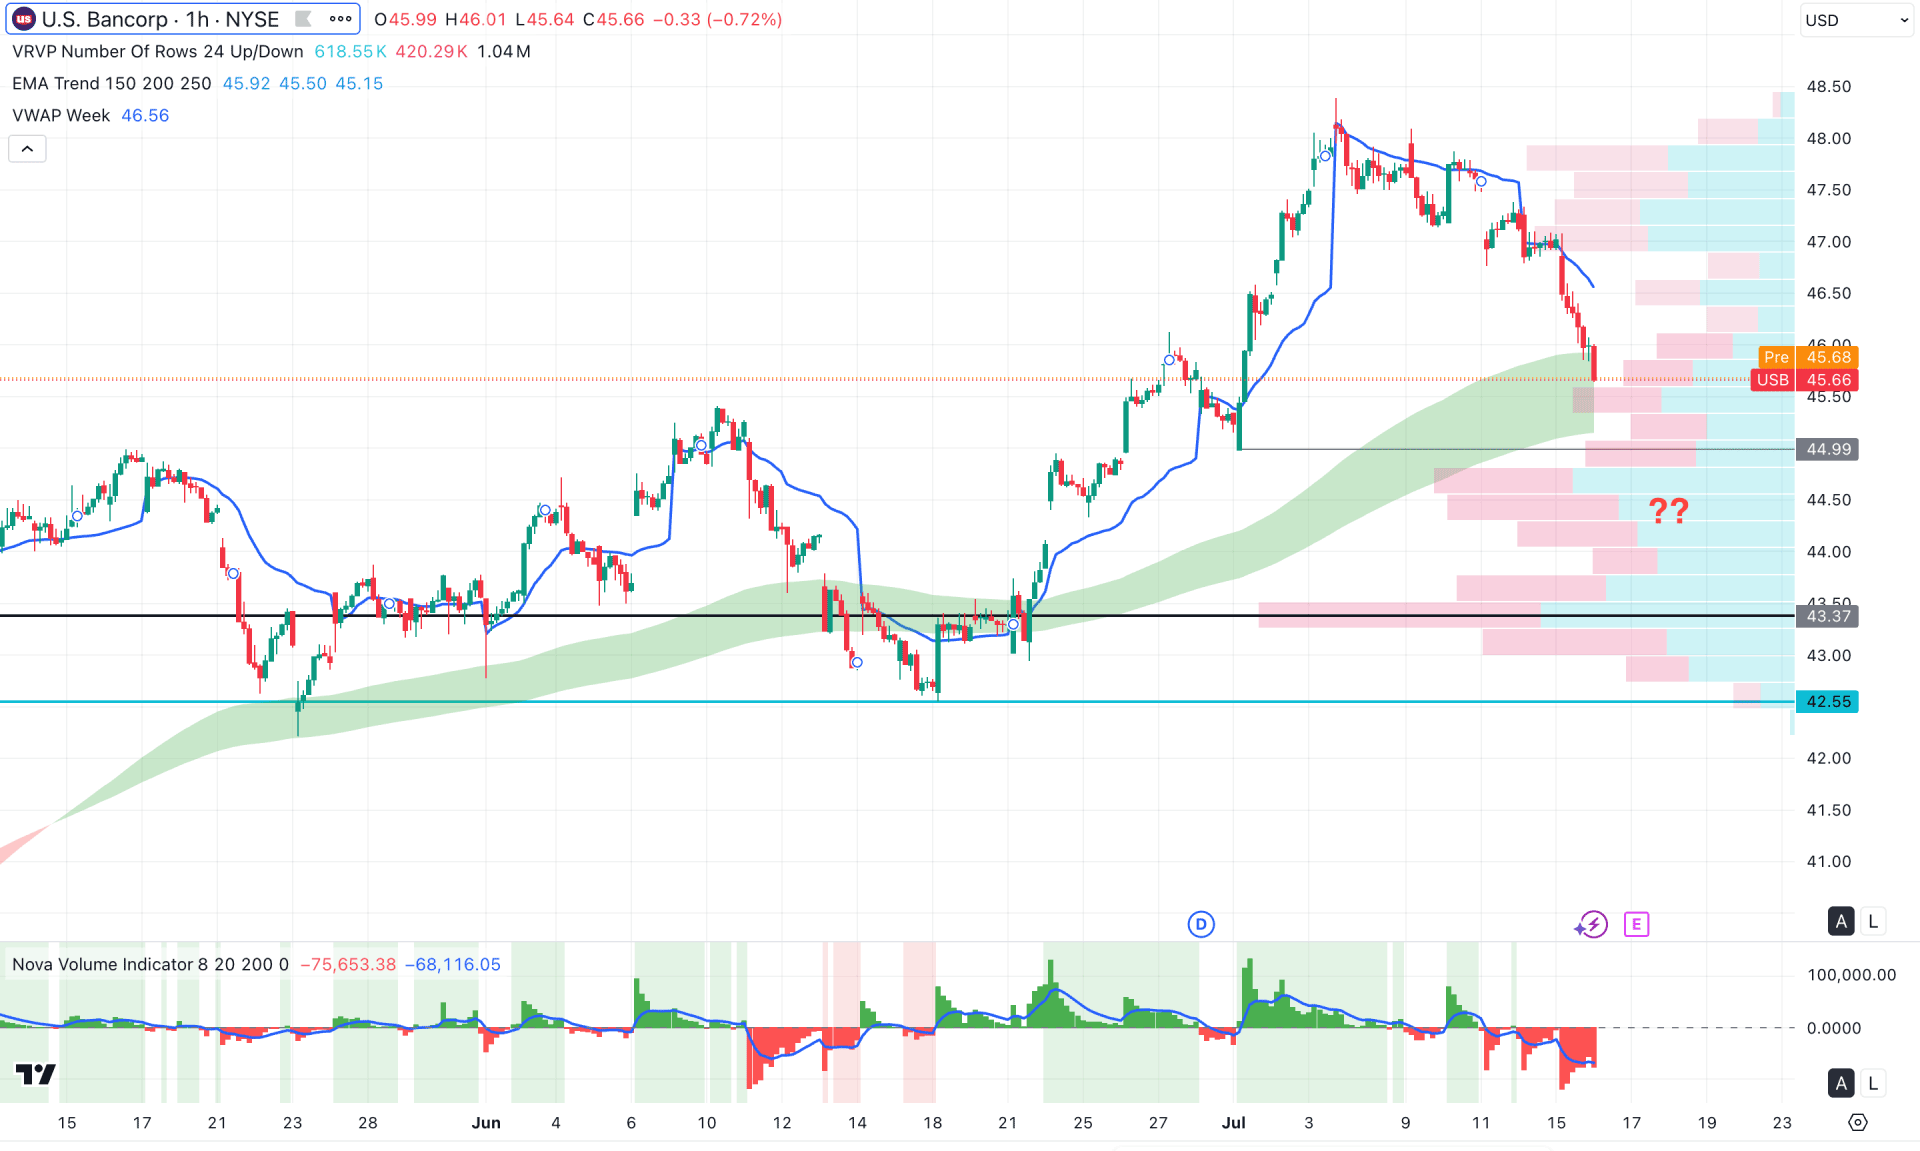
In the hourly timeframe, USB stock is trading below the weekly VWAP level, signaling ongoing selling pressure. However, the moving average wave is acting as immediate support, from where bulls might attempt to regain control. Additionally, the visible range high level remains below the current price, acting as major support at the 43.37 level.
In the volume indicator window, bearish sentiment is confirmed by the break below the VWAP. In this case, investors should monitor how the price reacts at the immediate swing low of 44.99 before anticipating the next move.
Primarily, a bearish break below the 44.99 level could push the price into the liquidity zone. However, a bullish rebound from the 45.00–43.37 area is possible. In that scenario, a bullish hourly candle closing above the VWAP level could offer a buying opportunity, targeting the 50.00 level.
On the other hand, an extended sell-off below the 42.50 level might invalidate the current bullish setup and drive the price lower toward the 39.00 area.
Based on the broader market outlook, the recent bullish breakout on the daily chart still requires validation through intraday price momentum, as the downside correction is still in play. Investors should monitor how the price reacts in the intraday range. A solid bottom formation followed by a bullish breakout could invalidate the short-term bearish pressure and open the door to extend the broader bullish trend.


