
Published: June 30th, 2022
While the broader crypto market is crashing, one coin that is moving opposite the wind is LEO. In the last weekly candle, LEO/USDT provided a 14.32% gain while Bitcoin price was unchanged almost at 2.5%.
Despite the name originating from a Latin fable, UNUS SED LEO provides a real opportunity for investors with the unique character it owns. It is built as a part of the current Bitfinex ecosystem and will circulate for a limited time only. This token's parent company intends to buy back all LEO tokens over the next few years.
IFinex founded this token after Crypto Capital, a payment processor that faced its funds being seized by the government. iFinex is also the parent company of Bitfinex, which warned that it is not possible to recover funds seized by the government. As a result, the company decided to launch the LEO token that will be bought back by the company in the next few years.
The limited availability of LEO tokens made a limited-time opportunity for traders where its entirely different characteristics might extend the bullish momentum even if the broader crypto market moves down.
Let’s see the future price direction from the LEO/USDT Technical analysis:
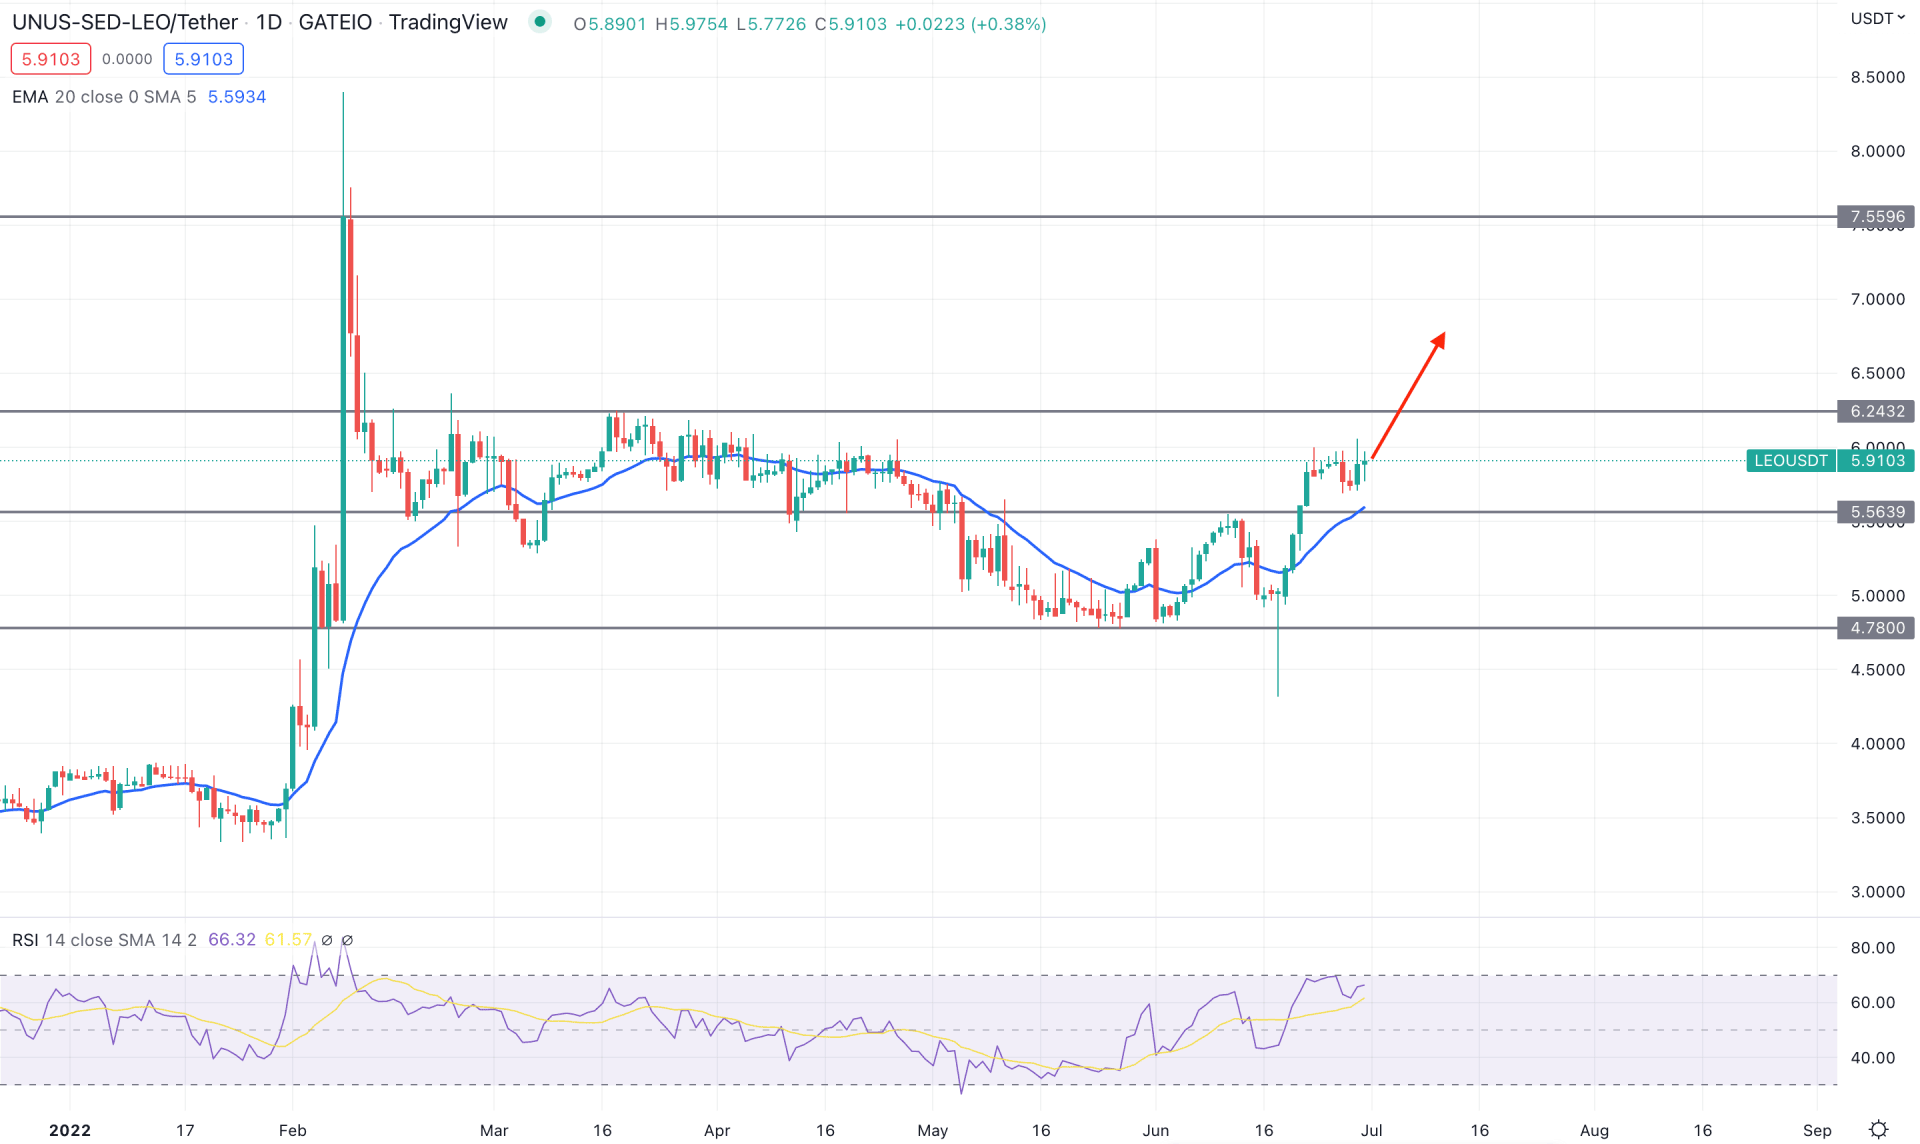
In the LEO/USDT daily chart, the price is trading within a bullish order flow that came from the recent sell-side liquidity grab below the 4.78 key support level. The price moved below the dynamic 20 EMA and static 4.78 level, indicating an excessive selling pressure but failed to hold the momentum. Therefore, the bullish recovery from the 4.78 level would be the key event to consider the upcoming price action as bullish. Moreover, the recent upside momentum above the 5.56 level is backed by a strong bullish impulsive trend that appeared in February. Therefore, as long as the price trades above the 5.56 level, it is more likely to move towards the 7.55 flip zone in the coming days.
The above image shows how the price trades above the dynamic 20 EMA while the RSI remained steady above the neutral 50 level. Moreover, the RSI tends to test and move beyond the 70 overbought level, which will be a strong bullish factor for the price.
Based on the current daily structure, investors should consider the upcoming price action bullish as long as it trades above the static 5.56 support level. In that case, any bullish opportunity from the 5.90 to 5.50 area would provide a high probable bullish trades towards the 7.00 area as a target level.
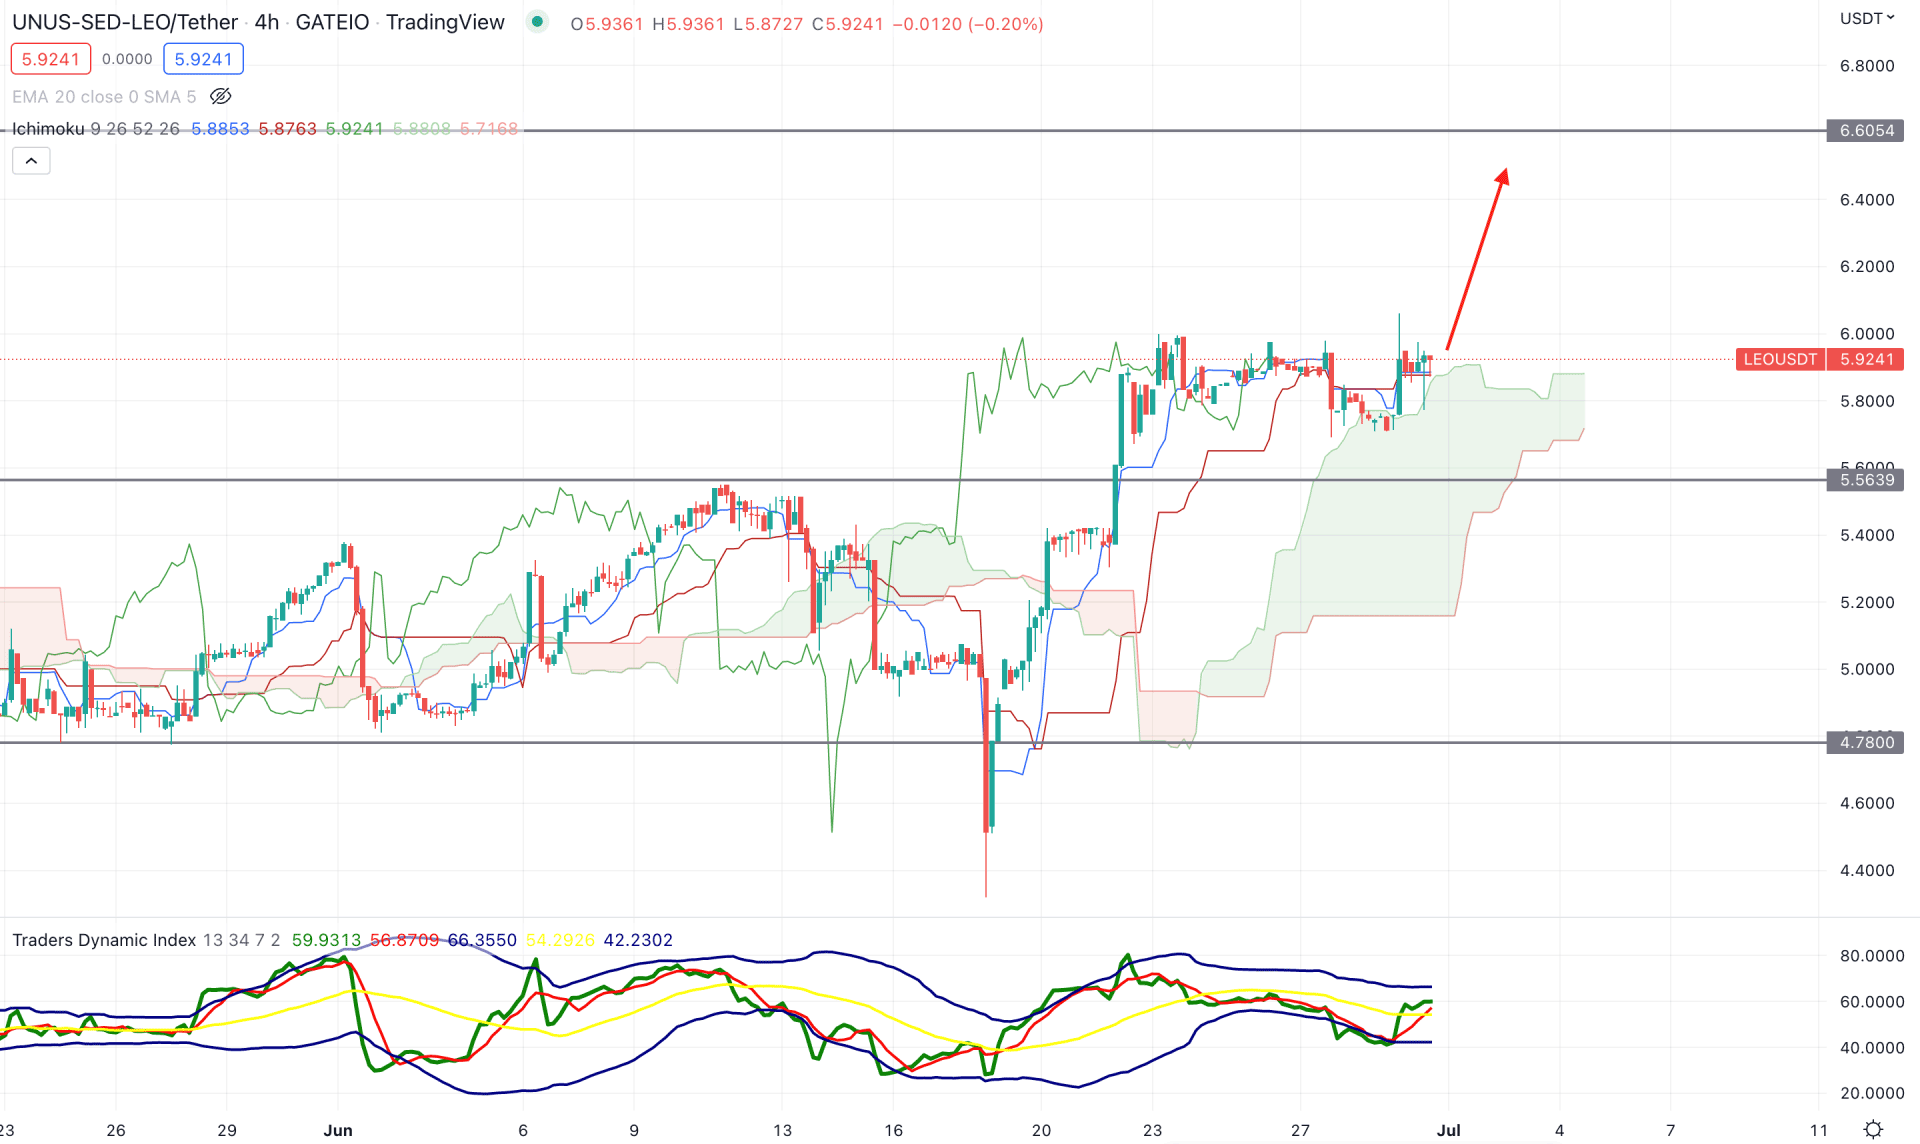
According to the Ichimoku Cloud, LEO/USDT is trading within a strong bullish momentum where the current price has a solid ground above the cloud support. Moreover, in the future cloud, Senkou Span A is above Senkou Span B, indicating a solid position for bulls. Furthermore, the Lagging Span is closer to the price, and any bullish breakout in the Lagging Span would initiate a bullish impulsive trend.
The above image shows how bulls are strong in the price from the Traders Dynamic Index. The TDI line moved above the 50 level and is yet to test the upper band, indicating that there is more room for upside for bulls in the current price action. The dynamic Tenkan Sen and Kijun Sen are also below the price, working as support to the price.
Based on the H4 structure, a new bullish H4 candle above the dynamic Kijun Sen would be a solid bullish opportunity in this pair, where the primary target is to test the 6.60 key resistance level. However, the alternative approach is to wait for the price to break below the 5.56 level to consider the bullish opportunity invalid.
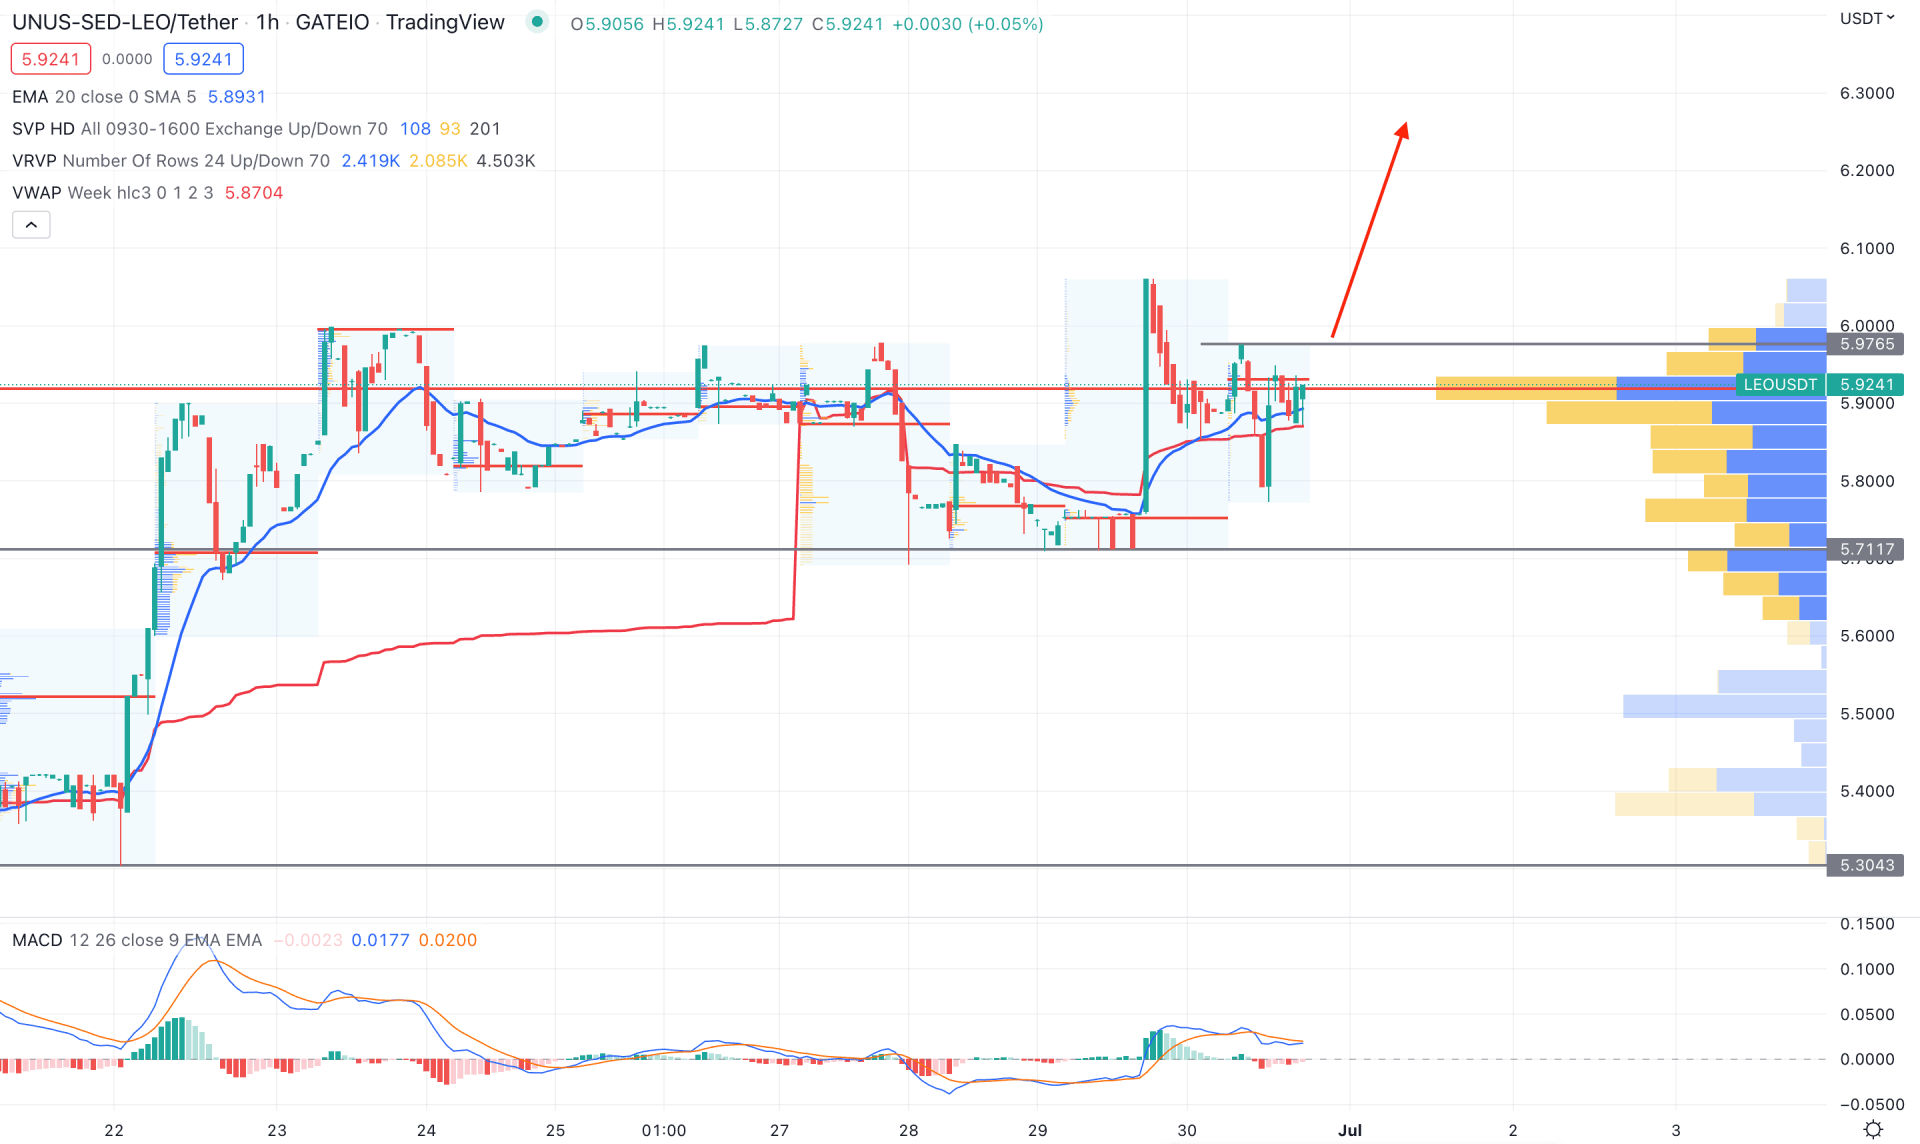
In the LEO/USDT intraday chart, the visible range trading volume shows the highest investor activity areas from where a substantial trend shift may appear. According to the current price range, the highest visible range volume is at the 5.92 level, which is closer to the current price. Moreover, the latest intraday high volume level is above the current price that should be recovered. Therefore, as the broader market trend is bullish, a new H1 candle above the 5.97 level would provide a solid bullish opportunity.
The above image shows how the MACD Histogram is losing its bearish momentum and moving to the neutral zone. Moreover, the dynamic 20 EMA and weekly VWAP are closer to the price and provide immediate support. In that case, as long as the price trades above the dynamic weekly VWAP support, the bullish pressure may extend.
Based on the current price action, LEO/USDT bullish possibility is solid where any bullish rejection in the H4 chart would provide highly accurate bullish trades. The current invalidation level for bulls is towards the 5.56 level, where the ultimate target level is $7.55.


