
Published: July 18th, 2023
Uniswap has introduced its newest blockchain protocol, UniswapX, which seeks to address the issues of high gas fees and failed transactions. The announcement was made at the Paris EthCC conference.
This event has generated a bullish outlook on the native token UNI, which is supported by multiple factors driving the value of the DeFi token higher.
UniswapX introduces a novel design space for decentralized exchanges, which promises enhanced efficiency, flexibility, and transaction potency. Therefore, investors often find this instrument as an attractive investment opportunity.
In addition, UniswapX improves privacy and decentralization compared to its progenitor, Uniswap. While Uniswap's off-chain orders are relatively transparent and easily traceable, UniswapX's increased aggregation makes it less easily traceable and more privacy-protective.
This new protocol's announcement at the EthCC conference is a long-term catalyst that may contribute to a prospective UNI price rally.
The total Value Locked (TVL) for Uniswap is currently $3.833 billion, having recovered from a decline to $3.644 billion in June. The current price of UNI/USDT is trading 7.59% higher than the previous trading week.
Should you extend your portfolio to this instrument? Let's see the complete price outlook from the UNI/USDT technical analysis:
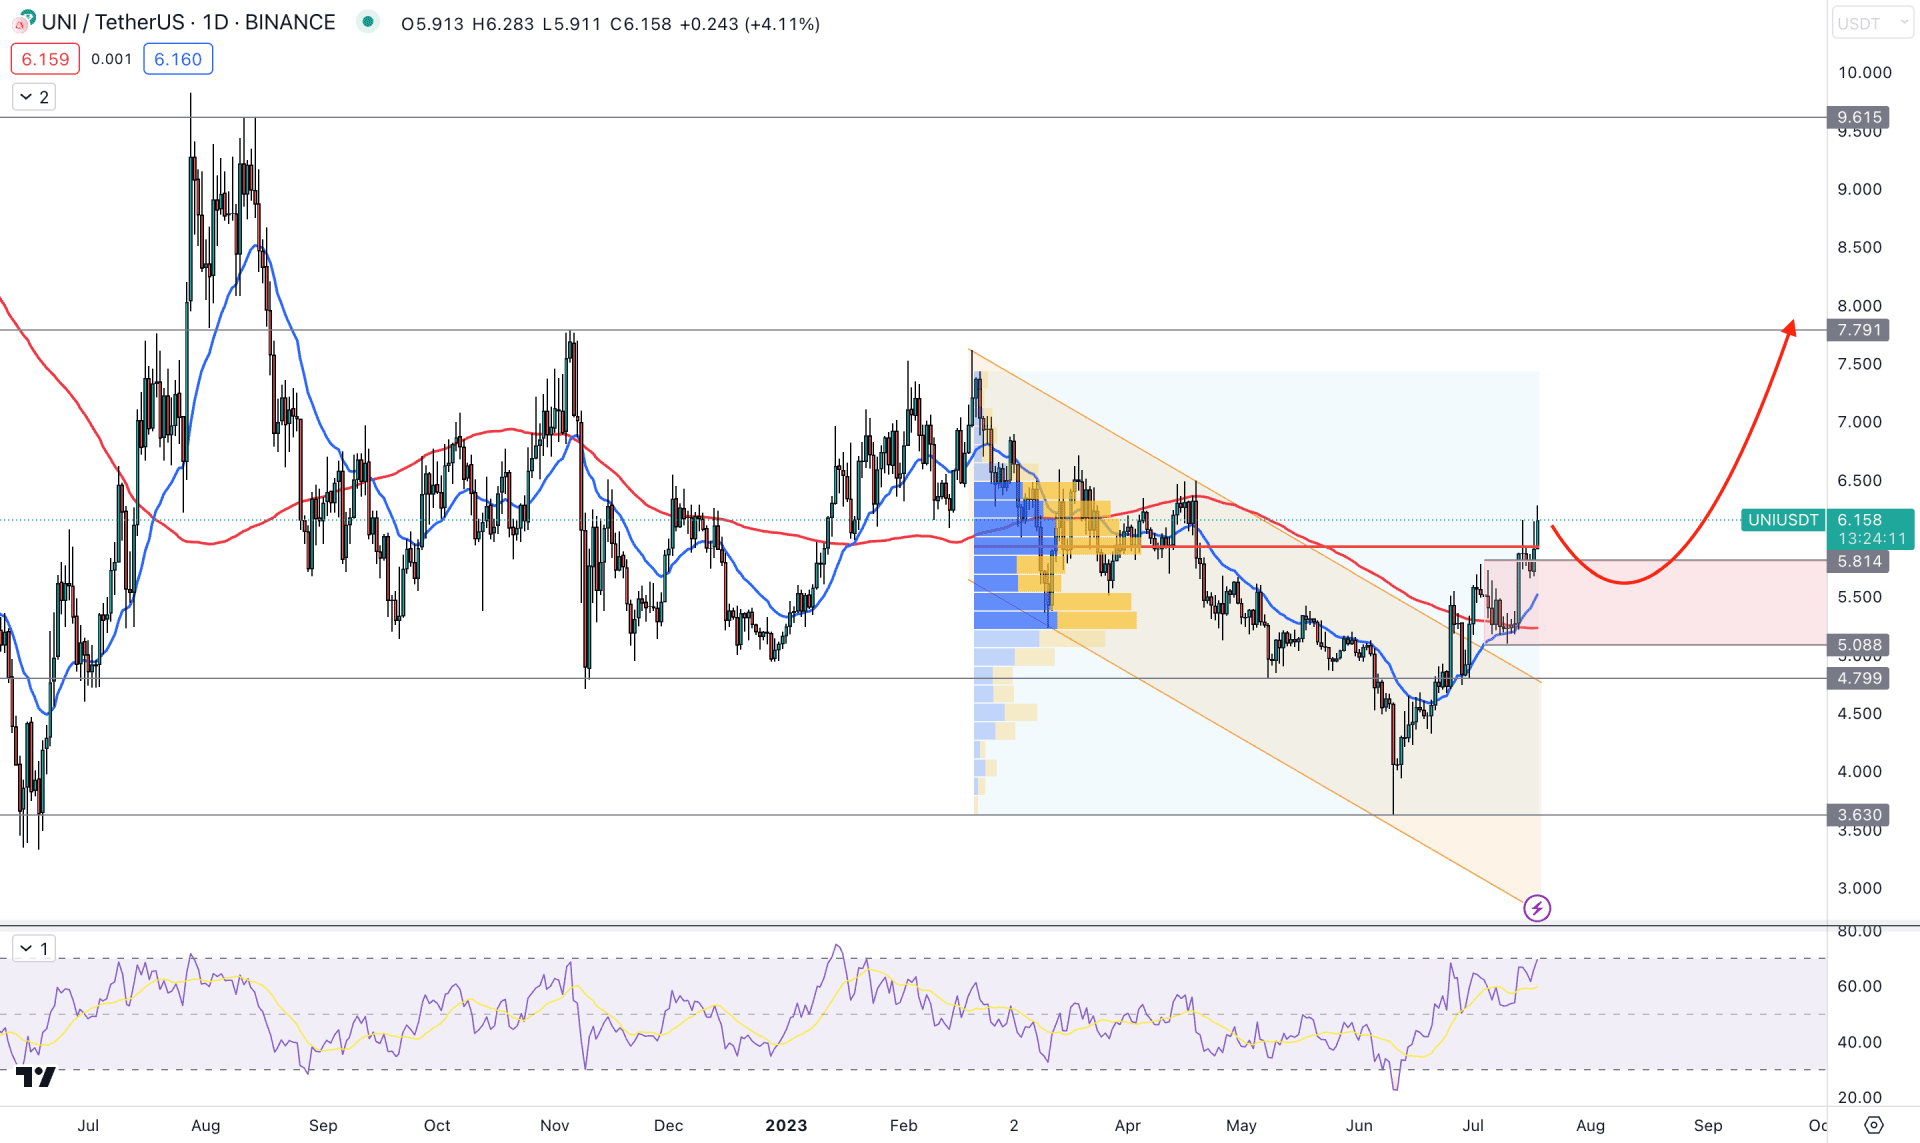
Based on the daily price of UNI/USDT, the broader outlook is corrective as the recent price is trading within a consolidation. However, the higher timeframe price action shows a strong bullish rejection, which may result in a bullish trend continuation in the daily price.
In the monthly time frame, a long wicked bullish candle supports bulls while the weekly price shows a 69% price change from the 3.660 swing low.
A strong descending channel breakout is visible in the daily price, while the current price holds bullish momentum above the channel resistance. As a result, the confluence buying possibility came from the bullish crossover between the 100 and 50-day Moving averages, while both lines are working as support levels. Therefore, the primary outlook for this instrument is to look for long trades only as long as it trades above the 100-day SMA level.
The highest trading volume since 19 February 2023 is at the 5.934 static level, while the current price struggles to hold momentum above it. It is a sign that bulls are active in the market, but an increased trading volume is not seen from the 3.630 bottom. Solid price action above the high volume level is needed before aiming for strong upward pressure.
In the secondary window, the current 14-period Relative Strength Index (RSI) reached the 70.00 overbought area, which signals extreme buying pressure in the market.
Based on the daily price outlook of UNI/USDT, investors may expect a bullish trend continuation after a valid rebound. The volume structure does not support bulls, so downward pressure may come towards the 5.088 or 4.799 area. On the other hand, a strong bearish break below this level with a D1 candle below the 4.700 level could eliminate the bullish structure and discount the price toward the 3.630 level.
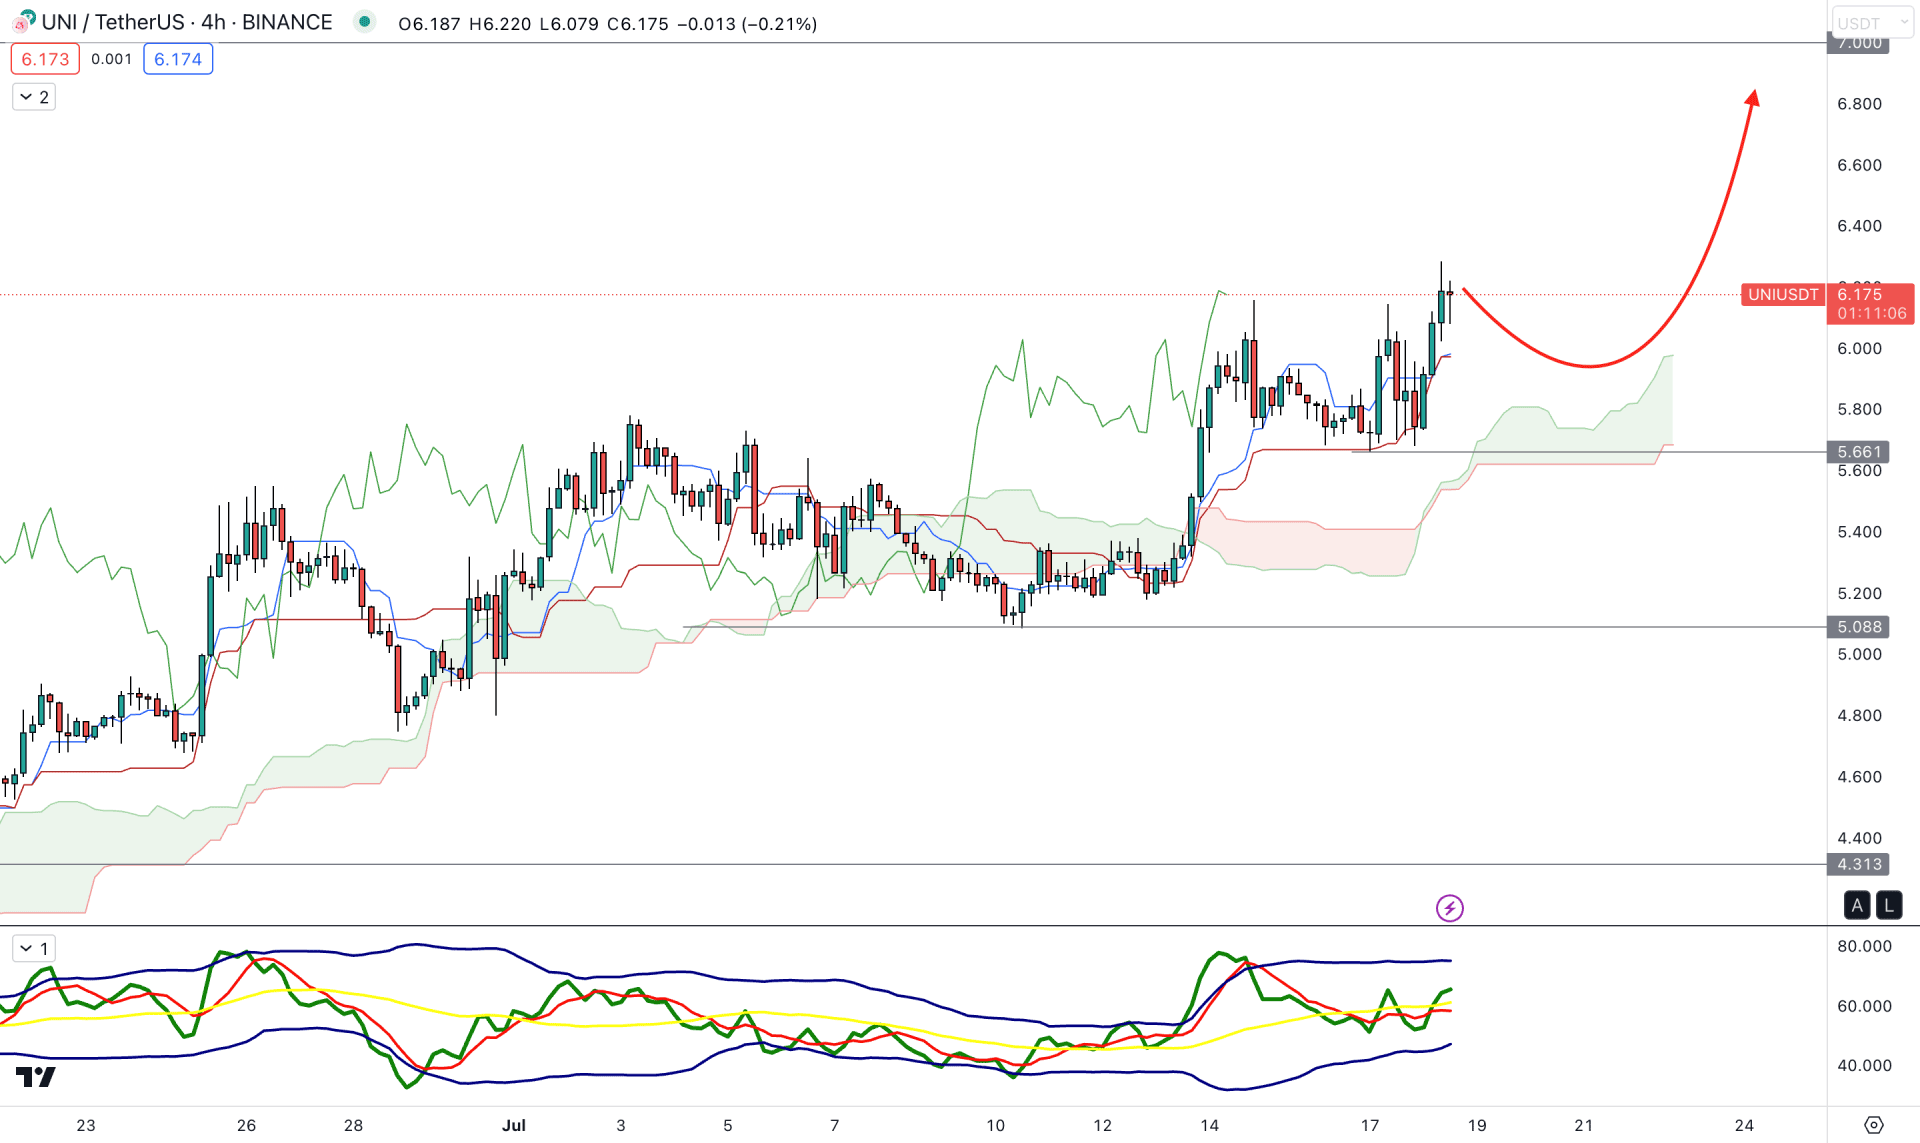
In the H4 timeframe, the broader market direction is bullish as the current price formed multiple higher highs above the Ichimoku Kumo Cloud. Also, the future cloud shows a strong upward pressure as the Senkou Span A and B move higher.
A consolidation phase is seen at the 5.661 static support level, which formed a bullish range breakout towards the major market trend.
The current TDI indicator shows a sideways movement in the indicator window, but the TDI level remains steady above the neutral line.
Based on the current H4 price structure, the bullish market trend is strong, and the price is more likely to extend upward pressure in the coming days.
Any bullish rejection from the dynamic Kijun Sen or static 5.661 level could be a long opportunity, but breaking below the 5.400 level would lower the price towards the 4.600 level.
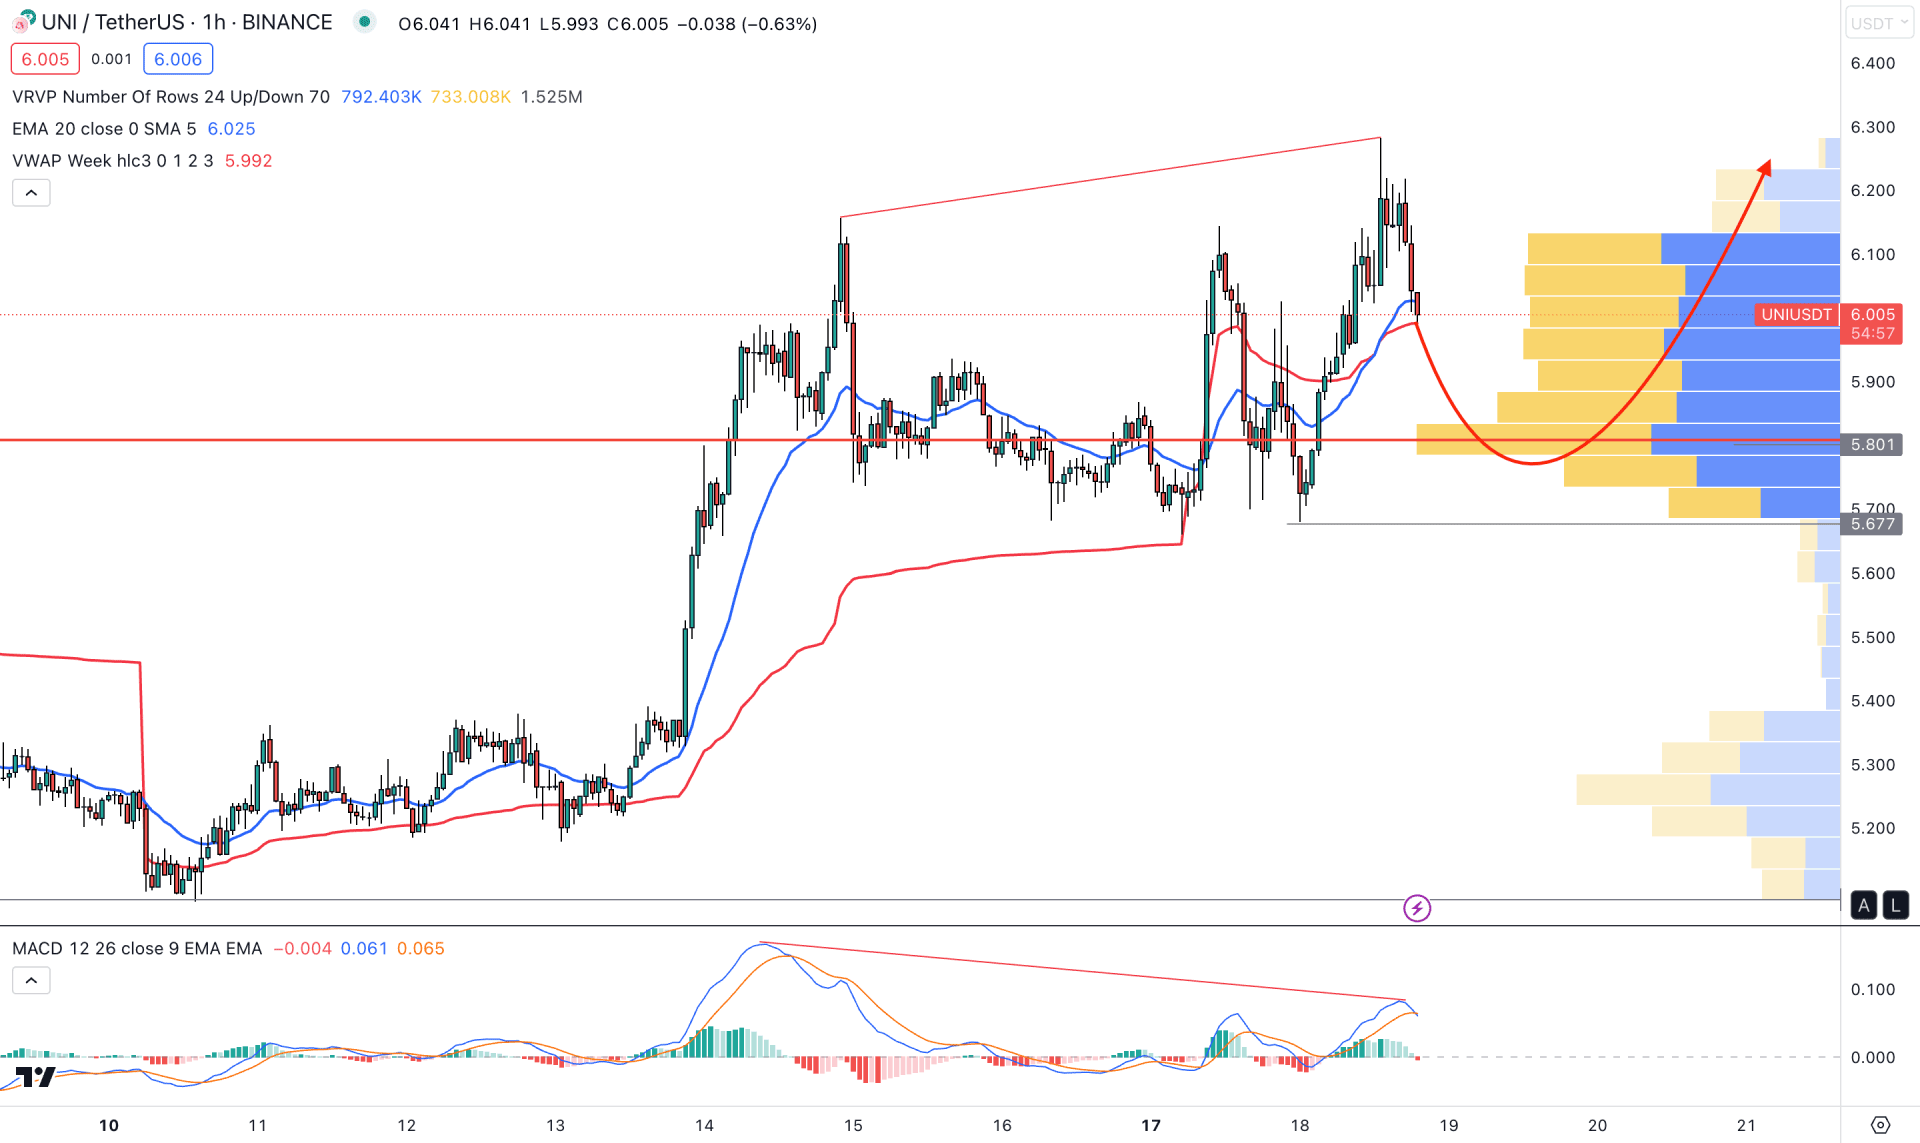
In the H1 timeframe, the broader market direction is bullish, while the current visible range high volume level backs the buyers' presence.
The most recent chart shows a correction price action as the dynamic 20 EMA and VWAP are closer together. It indicates that investors might experience a stable trend after a solid breakout.
On the other hand, a potential divergence is visible with the MACD EMA, while the current Histogram is bearish.
We may expect a bullish trend continuation after a considerable correction based on the current price action. Any bullish rebound from the 5.801 to the 5.600 area could be a high probable long opportunity in this pair. However, breaking below the 5.600 level could lower the price towards the 5.088 area.
Based on the current market outlook, the UNI/USDT price is trading within a strong bullish trend, where any intraday bearish correction could offer a long opportunity. Investors should closely monitor the price action to find the best area to buy this instrument from the intraday chart.


