
Published: July 9th, 2024
Transak, a provider of web3 payment infrastructure, has formed a partnership with Uniswap Labs to serve as a fiat on-ramp partner. This partnership will allow users to make fiat-to-crypto purchases directly from the Uniswap Wallet.
Transak announced the partnership, emphasizing that it will provide users with a smooth and intuitive on-ramp experience in the DeFi sector.
The Uniswap Wallet is self-custodial and offers direct access to the Uniswap protocol, the world's most popular and largest decentralized exchange. This integration enables users to exchange and trade tokens seamlessly within the application. Transak's integration enables users to purchase cryptocurrency directly within the application, eliminating the need to transmit funds from a centralized exchange and potentially attracting new users.
Users from more than 160 countries can purchase cryptocurrency directly in the Uniswap Wallet using various global and local payment methods, such as Apple Pay, Google Pay, credit/debit cards, and localized payment options.
This partnership could simplify the purchasing process for new users and facilitate a more extensive engagement with DeFi ecosystems. The UNI price has remained momentum after this fundamental update. Now, investors should closely monitor how the price reacts as the technical chart shows an emerging bullish opportunity.
Let's see how the price could perform from the UNI/USDT technical analysis:
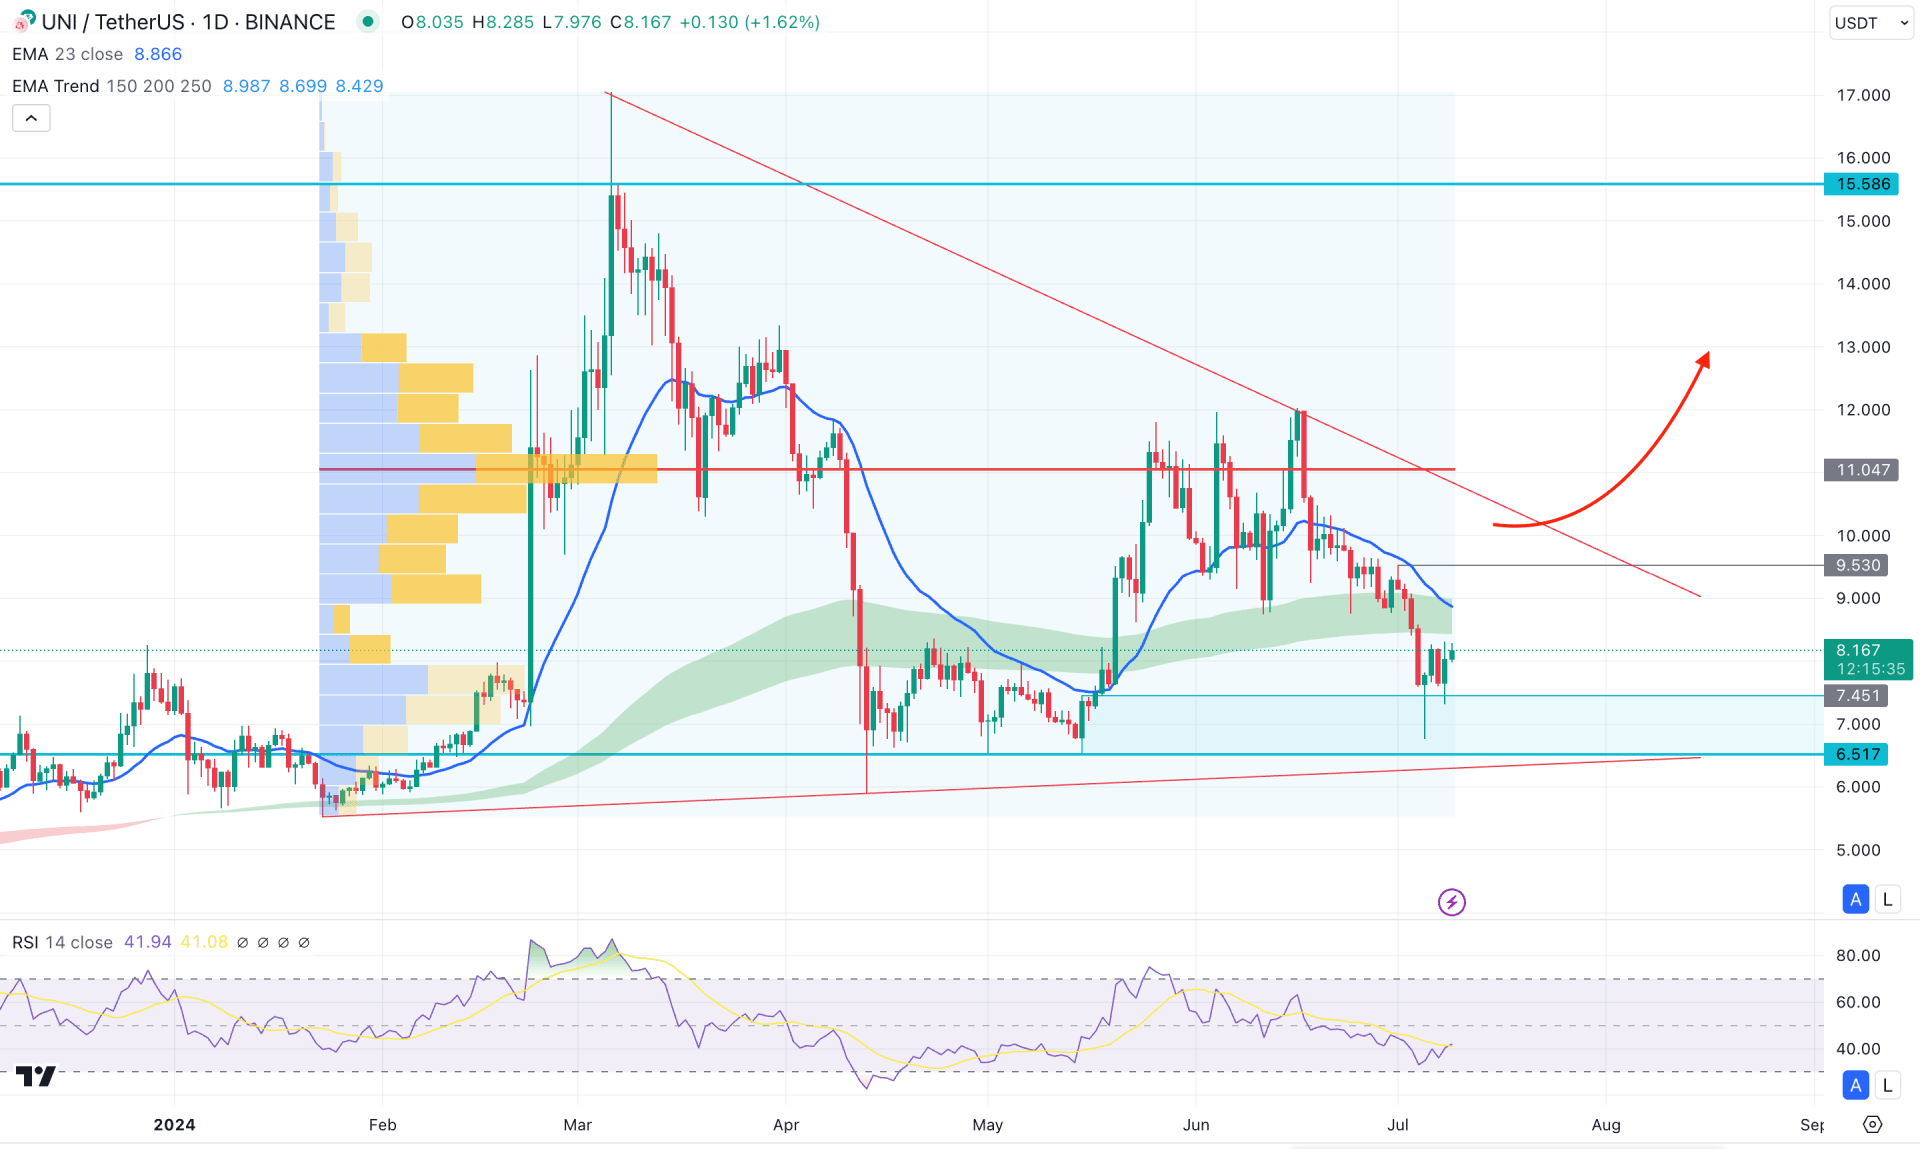
In the daily chart on UNI/USDT, the recent price shows corrective pressure, where the most recent price hovers at the crucial bullish order block. Investors should closely monitor how the price trades in this area, as valid buying pressure could resume the broader bullish trend at any time.
In the higher timeframe, the monthly candlestick pattern suggests a bearish continuation, with the May 2024 low still protected. Moreover, the weekly price shows a clear outlook for the pennant pattern, where a valid bullish break above the trend line resistance is needed before forming a bullish impulse.
The volume structure is still on the sellers side, where the most active level since January 2024 is at 11.04 level. As long as the current price trades below the high volume level, we may expect the downside pressure to continue.
In the main price chart, the most recent price shows a buying pressure from the 7.45 to 6.51 demand zone from where a buying pressure might come. However, the Moving Average wave remains downward above the current price, suggesting a major bearish trend. Moreover, the 20-day Exponential Moving Average is also above the current price, signaling a confluence selling pressure.
In the secondary window, the Relative Strength Index (RSI) suggests a downside pressure as it hovers below the 50.00 neutral point.
Based on the daily market outlook of UNI/USDT, the bullish continuation with a daily candle above the 9.53 resistance level could activate the long-term buying opportunity. In that case, the upward pressure could extend and find a resistance from the 15.58 level.
On the bearish side, the bearish rejection from the EMA wave with a daily close below the 7.00 psychological level could lower the price towards the 5.00 area.
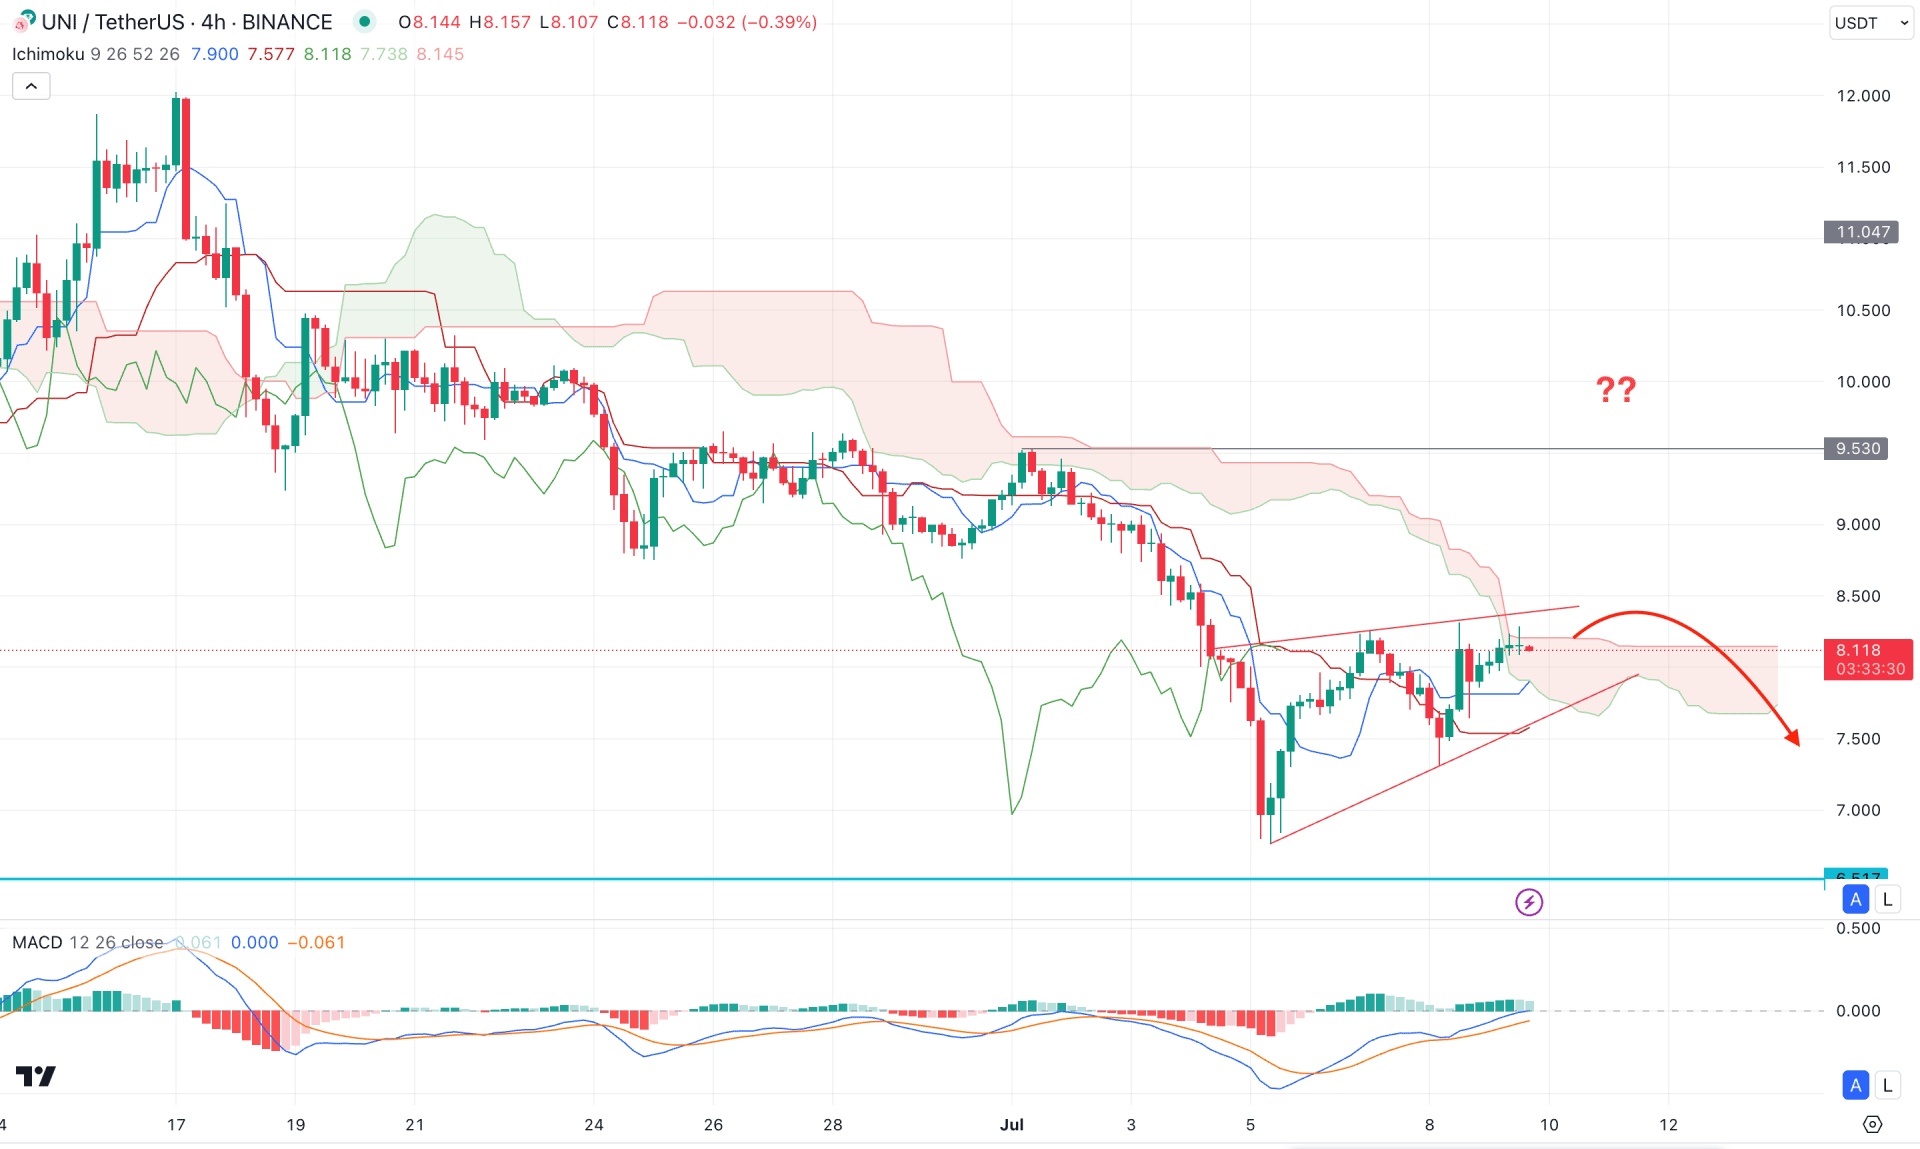
In the H4 timeframe, the most recent UNI/USDT price shows a corrective bullish pressure, while the broader context is bearish below the Ichimoku Cloud. Moreover, the future cloud suggests a downside continuation as the Senkou Span A is below the Senkou Span B.
In the secondary window, the MACD Histogram remains above the neutral point, while the Signal line remains bearish.
Based on the current market outlook of UNI/USDT, the recent bearish pressure could open a short opportunity after having an H4 candle below the Dynamic Kijun Sen line. In that case, the downside pressure could lower the price towards the 6.51 support level.
On the other hand, the downside pressure is valid as long as the current price hovers below the 9.00 psychological line. A bullish pressure with an H4 candle above the 9.53 resistance level could open a long opportunity, targeting the 12.00 level.
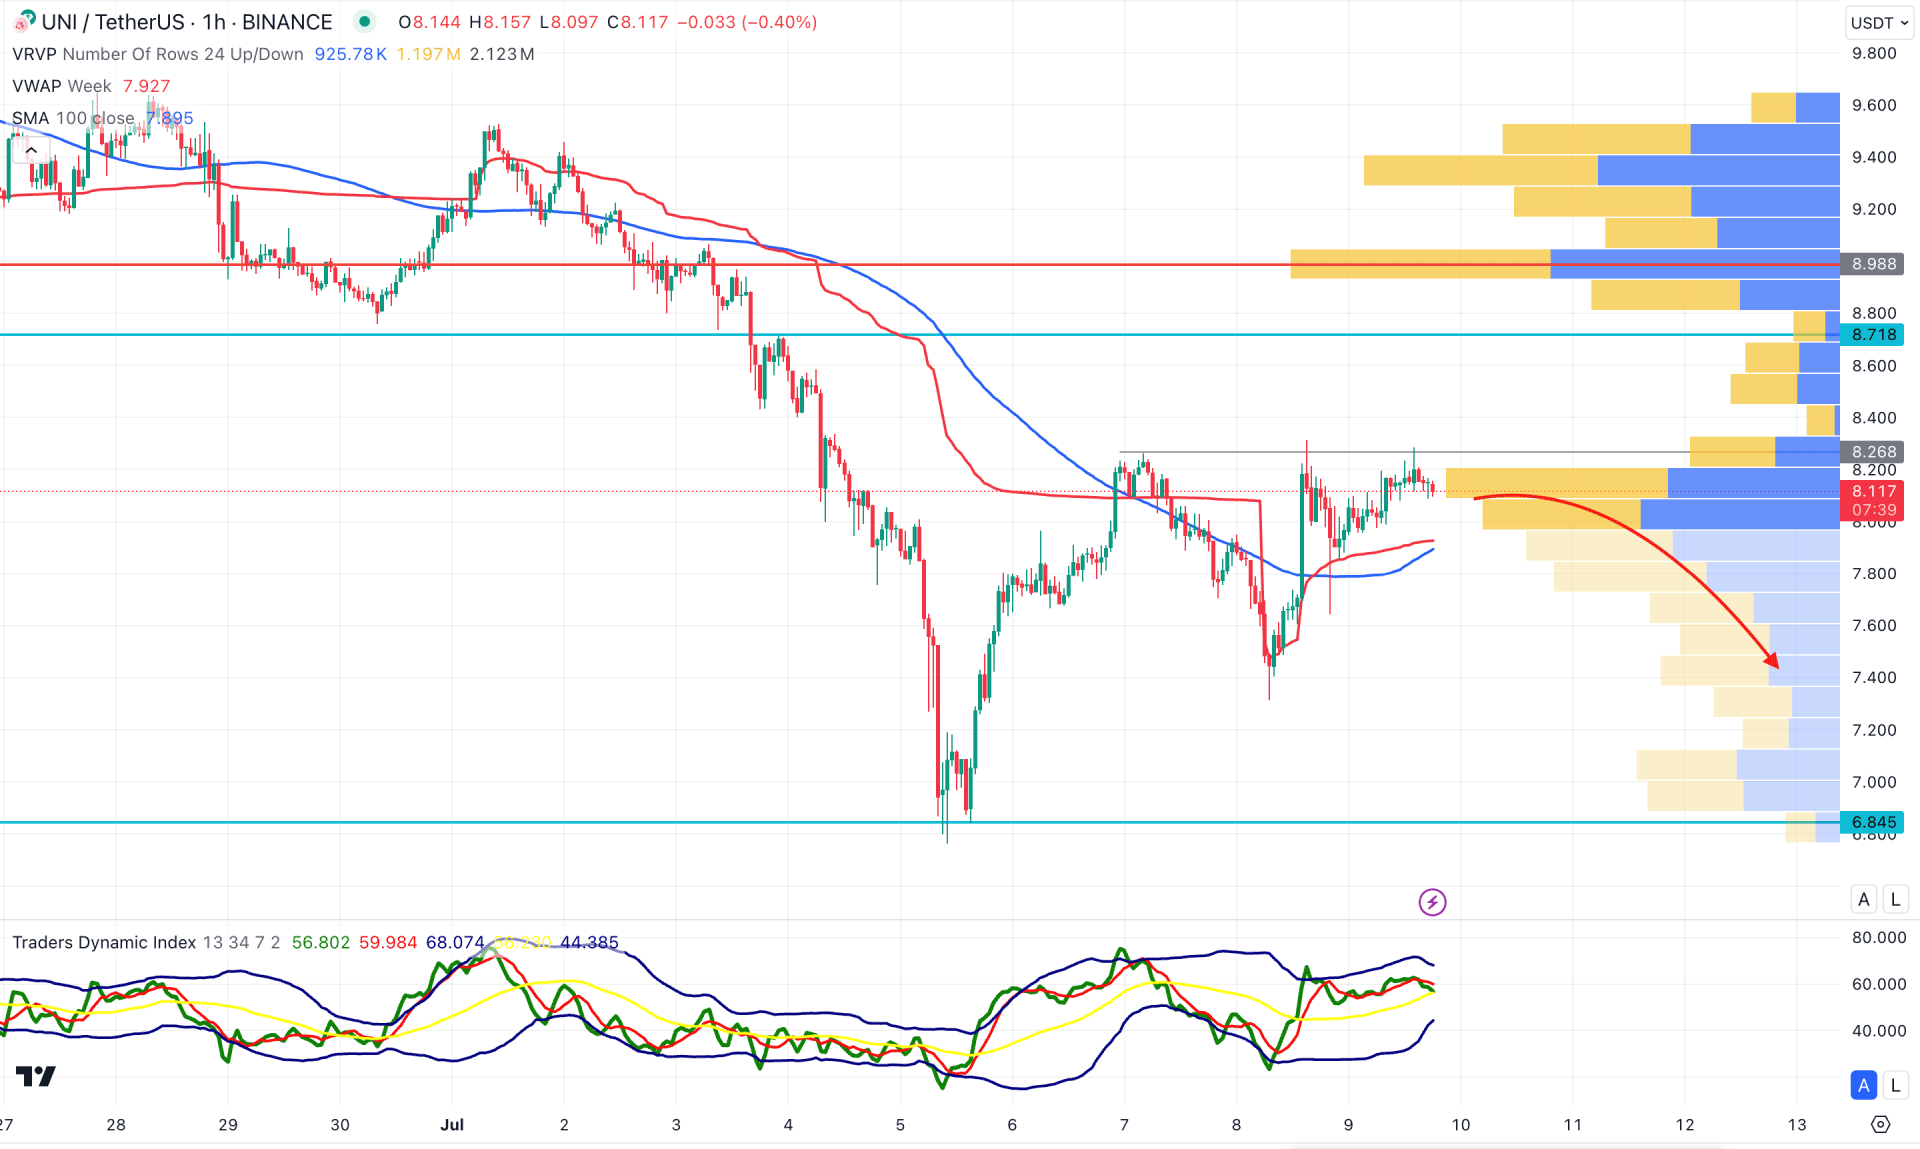
In the hourly time frame, the recent price consolidates below the visible range high volume line where the near-term resistance is at the 8.26 level. However, the 100 Simple Moving Average and weekly VWAP are below the current price.
The Traders Dynamic Index (TDI) remains sideways above the 50.00 line, which might work as a barrier to bulls.
Based on the H1 outlook, a downside pressure with an H1 candle below the dynamic weekly VWAP level could lower the price toward the 7.20 low.
The alternative approach is to look for a long opportunity after breaking out from the 8.98 resistance level. In that case, the buying pressure might extend, where the main aim is to test the 9.80 level.
Based on the ongoing market outlook, UNI/USDT is more likely to increase its buying pressure after validating the market trend in the daily chart. However, the weekly Pennant pattern is still valid, which needs a valid breakout before forming a long-term market trend.


