
Published: September 28th, 2022
Uniswap provides the opportunity of exchanging digital assets without any involvement in exchanges. It has become the world's largest decentralized exchange (DEX), handling over $1.1 trillion with more than 111 million transactions.
Uniswap has a protocol for developers to build decentralized apps for the financial sector. Some of the top-notch applications have been made with this ecosystem, like TrustWallet, Universe Finance, Token Terminal and so on.
As per the current price action, this token moved 8.86% up from the weekly opening while Bitcoin remained neutral with a bullish spike. As this token is holding a strong position during the bear market, it would be a great source of making profits for buyers.
Recently, this token showed a buyer's interest in developers' plan to disrupt leading centralized companies like Binance and Coinbase. During Messari’s Mainnet event, the COO of the company exposed several products to boost the market share.
Let’s see the future price direction of the Uniswap token from the UNI/USDT Technical analysis:
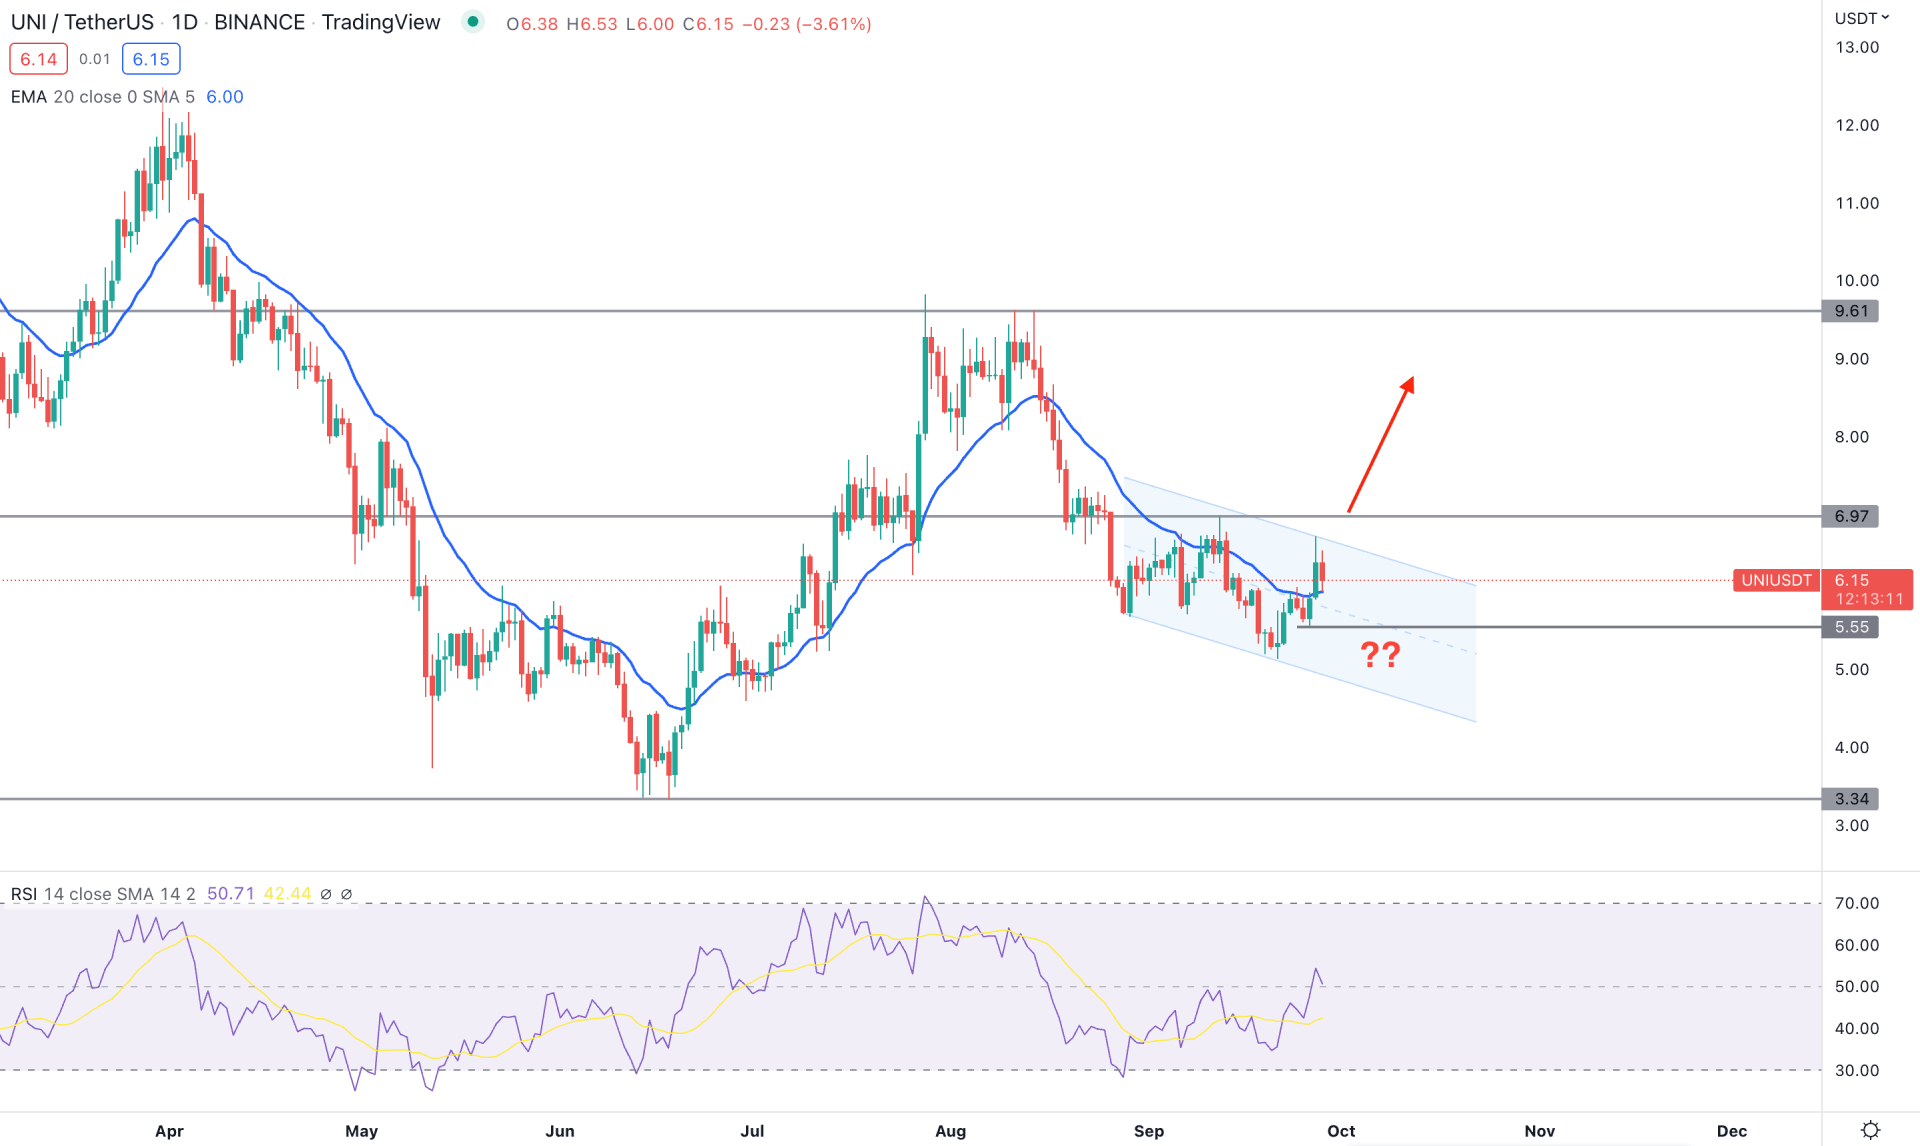
In the UNI/USDT daily chart, the current trading range starts from the 3.34 swing low to the 9.61 swing high from where the bullish and bearish Quasimodo pattern appeared. As the current price is trading below 50% of the range, any bullish opportunity has a higher possibility of providing a good RR.
Although the current price is within the correction of 3.34 to 9.61 high, a bullish continuation should come with a proper candlestick formation. The current price is still trading within a descending channel, where the near-term resistance is at 6.97. Therefore, a bullish breakout above the 6.97 level would be the primary requirement before targeting the 9.61 level.
The dynamic 20-day Exponential Moving Average in the main window is below the price, backed by a strong bullish daily close above it. Moreover, the Relative Strength Index shows buyers' momentum as the current level is above the 50% area, aiming for the overbought 70% zone.
Based on the daily price structure of UNI/USDT, a strong bullish daily candle above 6.97 would confirm the possible buying pressure towards the 10.00 area. On the other hand, a new bearish daily candle below the 20 DMA could eliminate all bullish possibilities and lower the price toward the 3.34 support level.
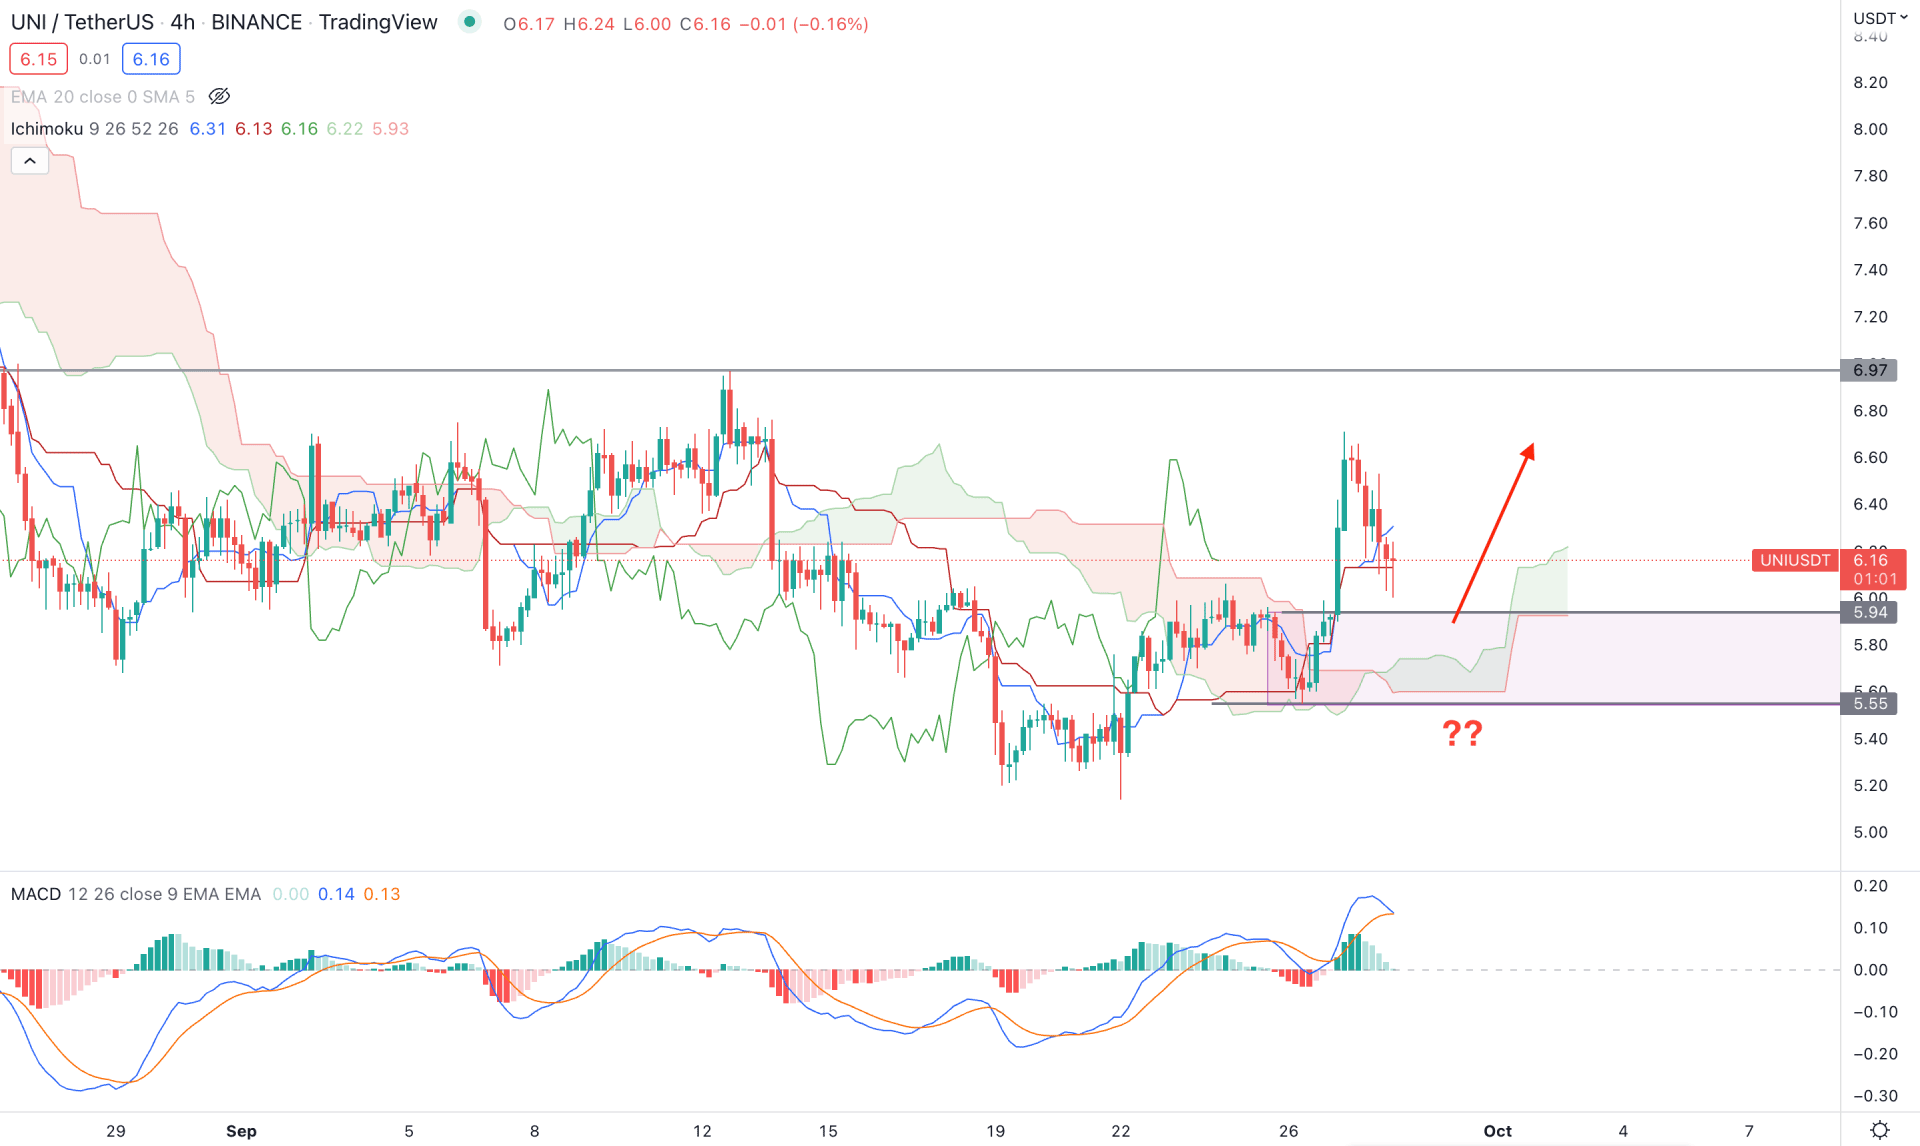
The ideal buying approach in Ichimoku Cloud trading is to find the price above the Kumo Cloud, supported by dynamic levels. The same scenario is present in the UNI/USDT H4 chart, where Senkou Span A is above Senkou Span B in the future cloud.
The price spent some time within the Kumo Cloud before forming an impulsive pressure above it that came with a new swing level. Therefore, the price is more likely to return to the last bearish zone before the buy happens and form bullish rejection candlesticks. It could open a bullish opportunity where the main aim will be to test the near-term 6.97 swing high before making another upside pressure.
Based on the H4 price prediction, any bullish rejection from 5.94 to 5.55 zone with an H4 close above the dynamic Kijun Sen would offer a buying opportunity, targeting the 8.00 level.
On the other hand, breaking below the 5.50 level with a bearish H4 close could eliminate the bullish opportunity and lower the price to the 5.00 area.
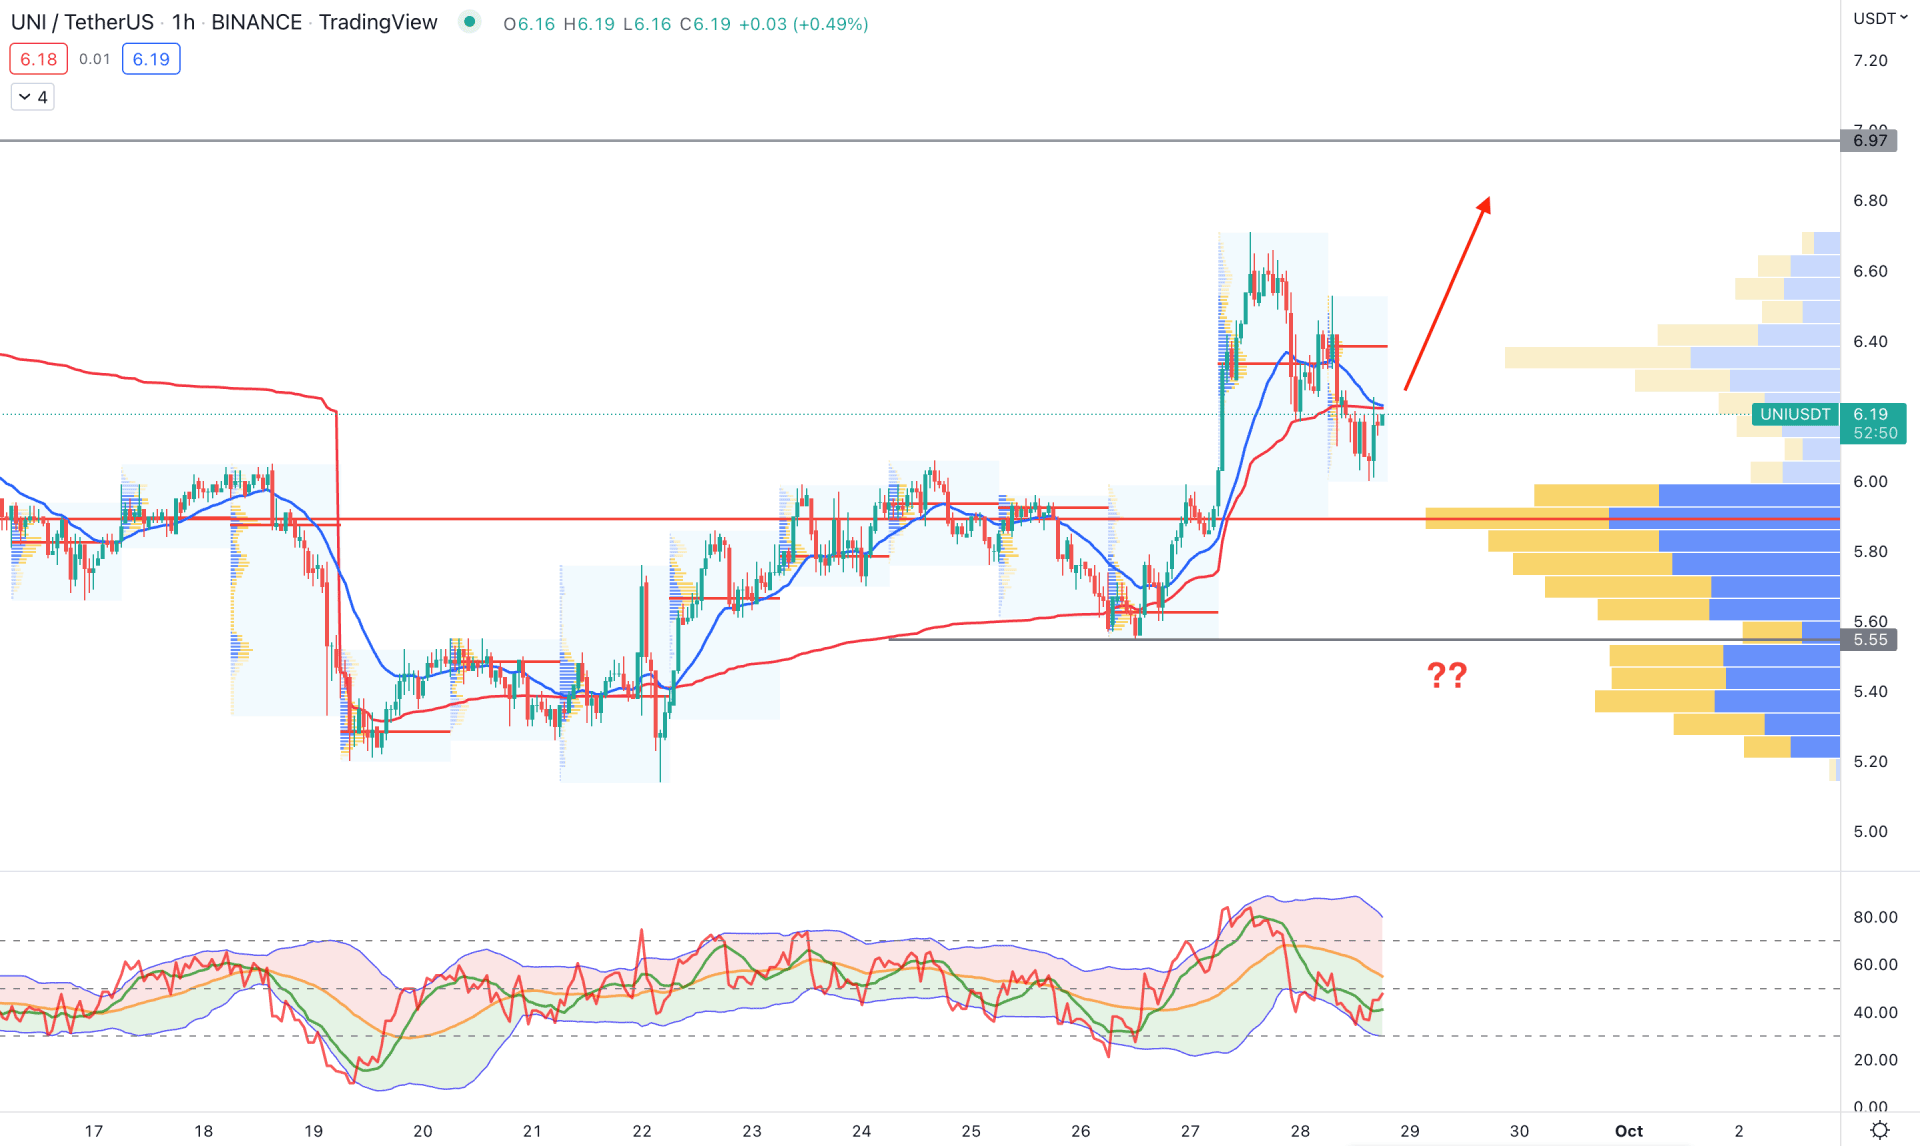
In the H1 timeframe, the broader market trend is bullish as the current price is above the high volume level of 5.90, from where a bullish impulsive pressure appeared. However, the price corrected lower below the dynamic 20 EMA and weekly VWAP.
Moreover, the latest intraday high volume level is above the price, where a new level should be formed below the price to increase the bullish pressure. The indicator window shows a buying possibility as the TDI level rebounded from the lower band.
Based on the H1 chart, a new bullish H1 candle above the dynamic 20 EMA would higher the price towards the 6.97 level. Another approach is to fund a buying pressure from the 6.00 to 5.55 area, but breaking below the 5.00 level would eliminate the bullish structure.
Based on the current analysis, UNI/USDT bulls should wait for a valid breakout with a candle close above the 6.97 level in the daily chart. On the other hand, the failure to hold the price above the 5.55 level could extend the range towards the 3.34 level.


