Published: November 7th, 2023
Uniswap (UNI), an industry-leading decentralized exchange (DEX), has encountered ongoing obstacles in the shape of sandwich assaults and MEV bots.
MEV (Miner Extractable Value) algorithms are mechanized programs that miners employ to optimise their earnings by detecting profitable prospects within blockchain transactions.
A sandwich attack occurs when an MEV bot positions itself strategically between a trader's transaction and the blockchain. It will enable price manipulation and ultimately cause the trader to sell at a diminished price or purchase at an inflated price.
Recent reports from Arkham Intelligence indicate that a user identified as 0Η568 suffered a catastrophic loss of $700,000 within a brief span of 12 seconds as a result of MEV malware. The error occurred when the user attempted to establish a fresh pool for WBTC-CRV on Uniswap v3. By. Therefore, they unintentionally increased the value of liquidity by $1.5 million, which is considerably higher than its fair market value.
In addition, the Hong Kong-based cryptocurrency platform HashKey Exchange has announced the addition of Uniswap (UNI) to its list of supported assets. This action came as a commitment of the exchange to its regional expansion strategy. HashKey Exchange has announced that UNI deposits will be accepted, and trading is scheduled to begin on November 9, 2023, which could work as a strong bullish factor for UNI.
Let’s see the upcoming price direction of this coin from the UNIUSDT technical analysis:

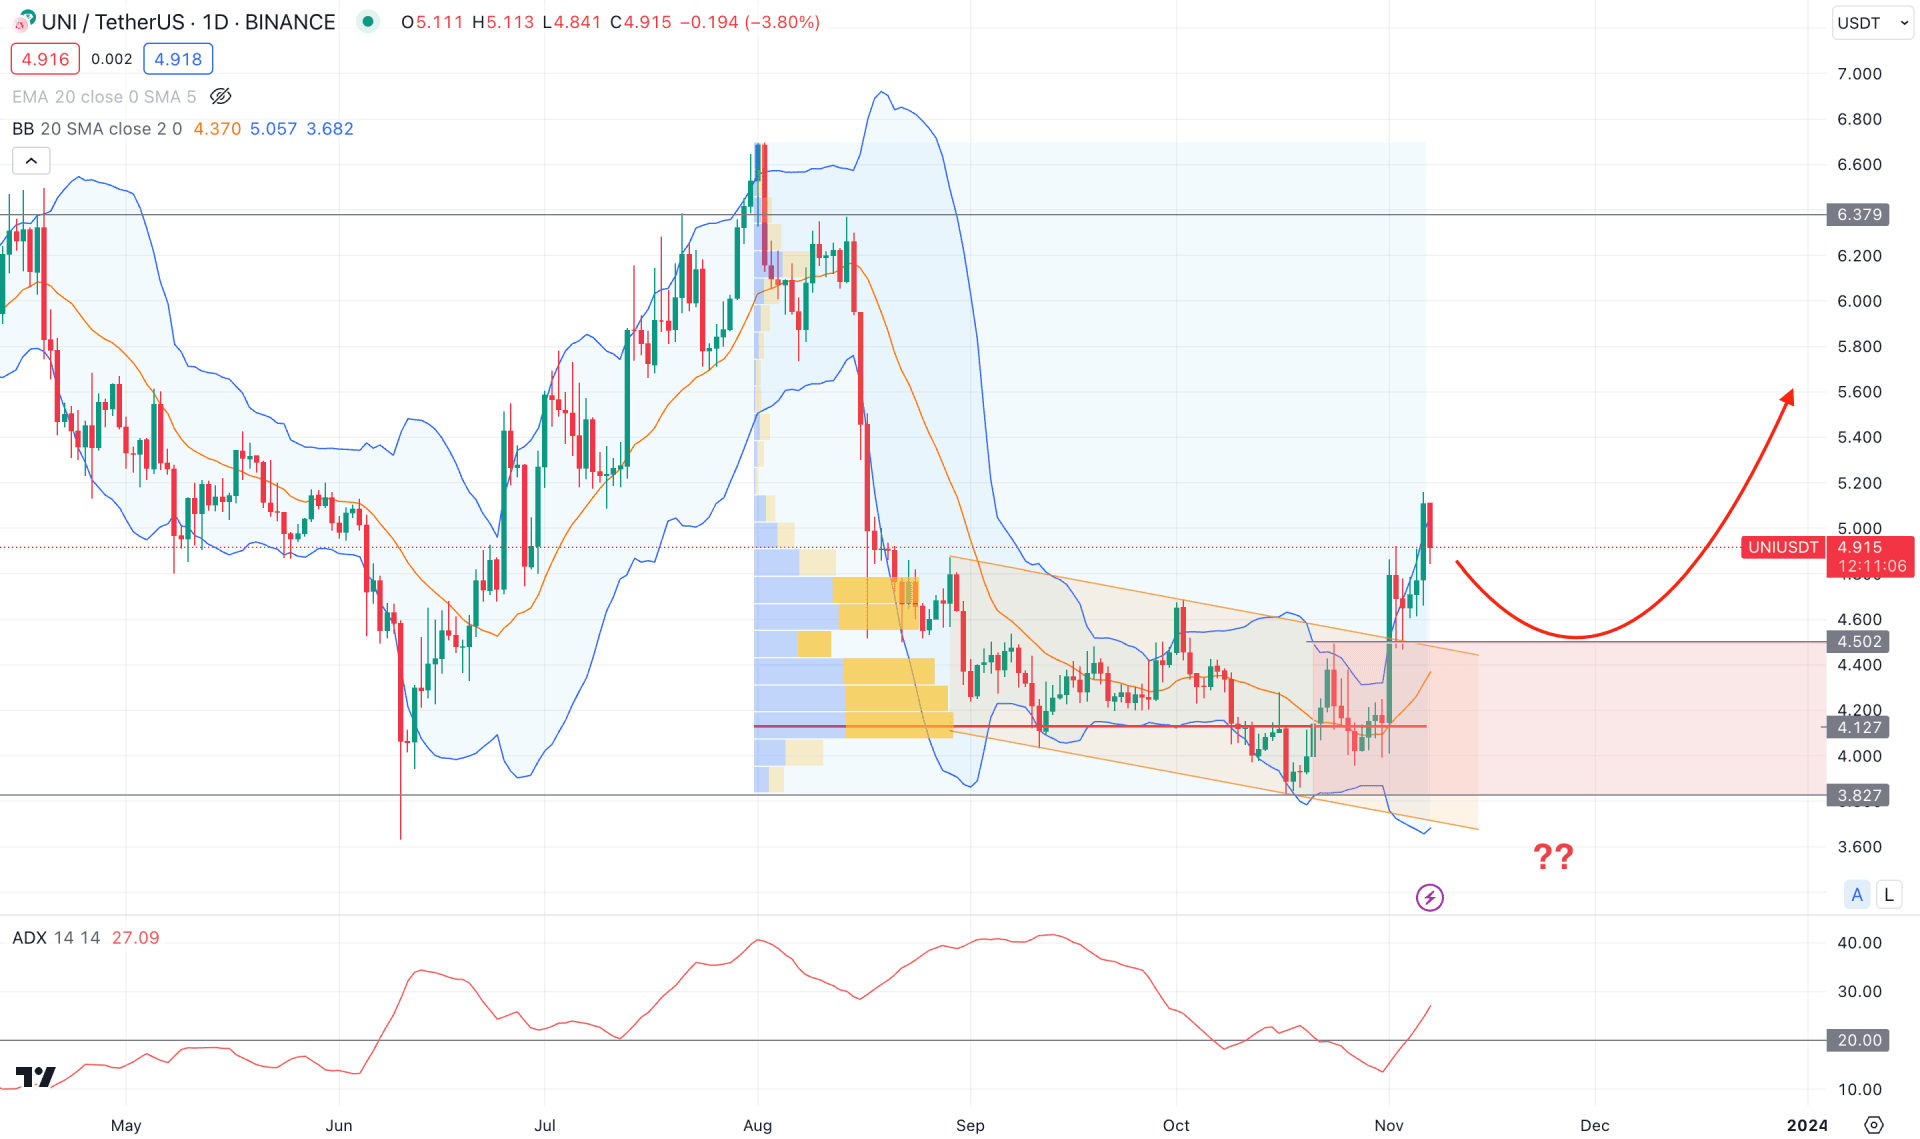
In the daily chart of UNIUSDT, a minor bearish channel breakout from a valid bottom is the primary sign that bulls have joined the market.
In the higher timeframe, the monthly chart suggests an ongoing bullish presence as it trades above the October higher. In the weekly chart, a valid bullish weekly candle is seen above the last 10 week’s average price, which shows buyers' presence in the market. Therefore, as long as the price trades within the last week’s low of 4.012, the upward possibility is solid.
In the daily chart, a new high-volume level formation is seen within the descending channel, which is a sign of strong buyers’ accumulation in the market. Moreover, the channel breakout with a bullish daily candle above the channel resistance is a sign of a valid breakout. In that case, a bearish correction is pending towards the channel resistance, from where a valid bullish rejection could be a long opportunity.
Moreover, the recent price shows a valid daily candle above the middle Bollinger Bands, which is a sign of ongoing buying pressure in the market. However, bulls have bound a barrier at the upper Bollinger Bands from where a bearish correction is pending.
In the secondary window, an ongoing bullish trend is seen as the current ADX is at the 27.18 level. In that case, more upside pressure might come as long as the ADX remains above the 20.00 level.
Based on the current market outlook, a valid bearish correction and a bullish reversal from the 4.500 to 3.827 area could be a long opportunity. In that case, the upside pressure might find resistance at the 6.379 level before moving to the 7.835 level.

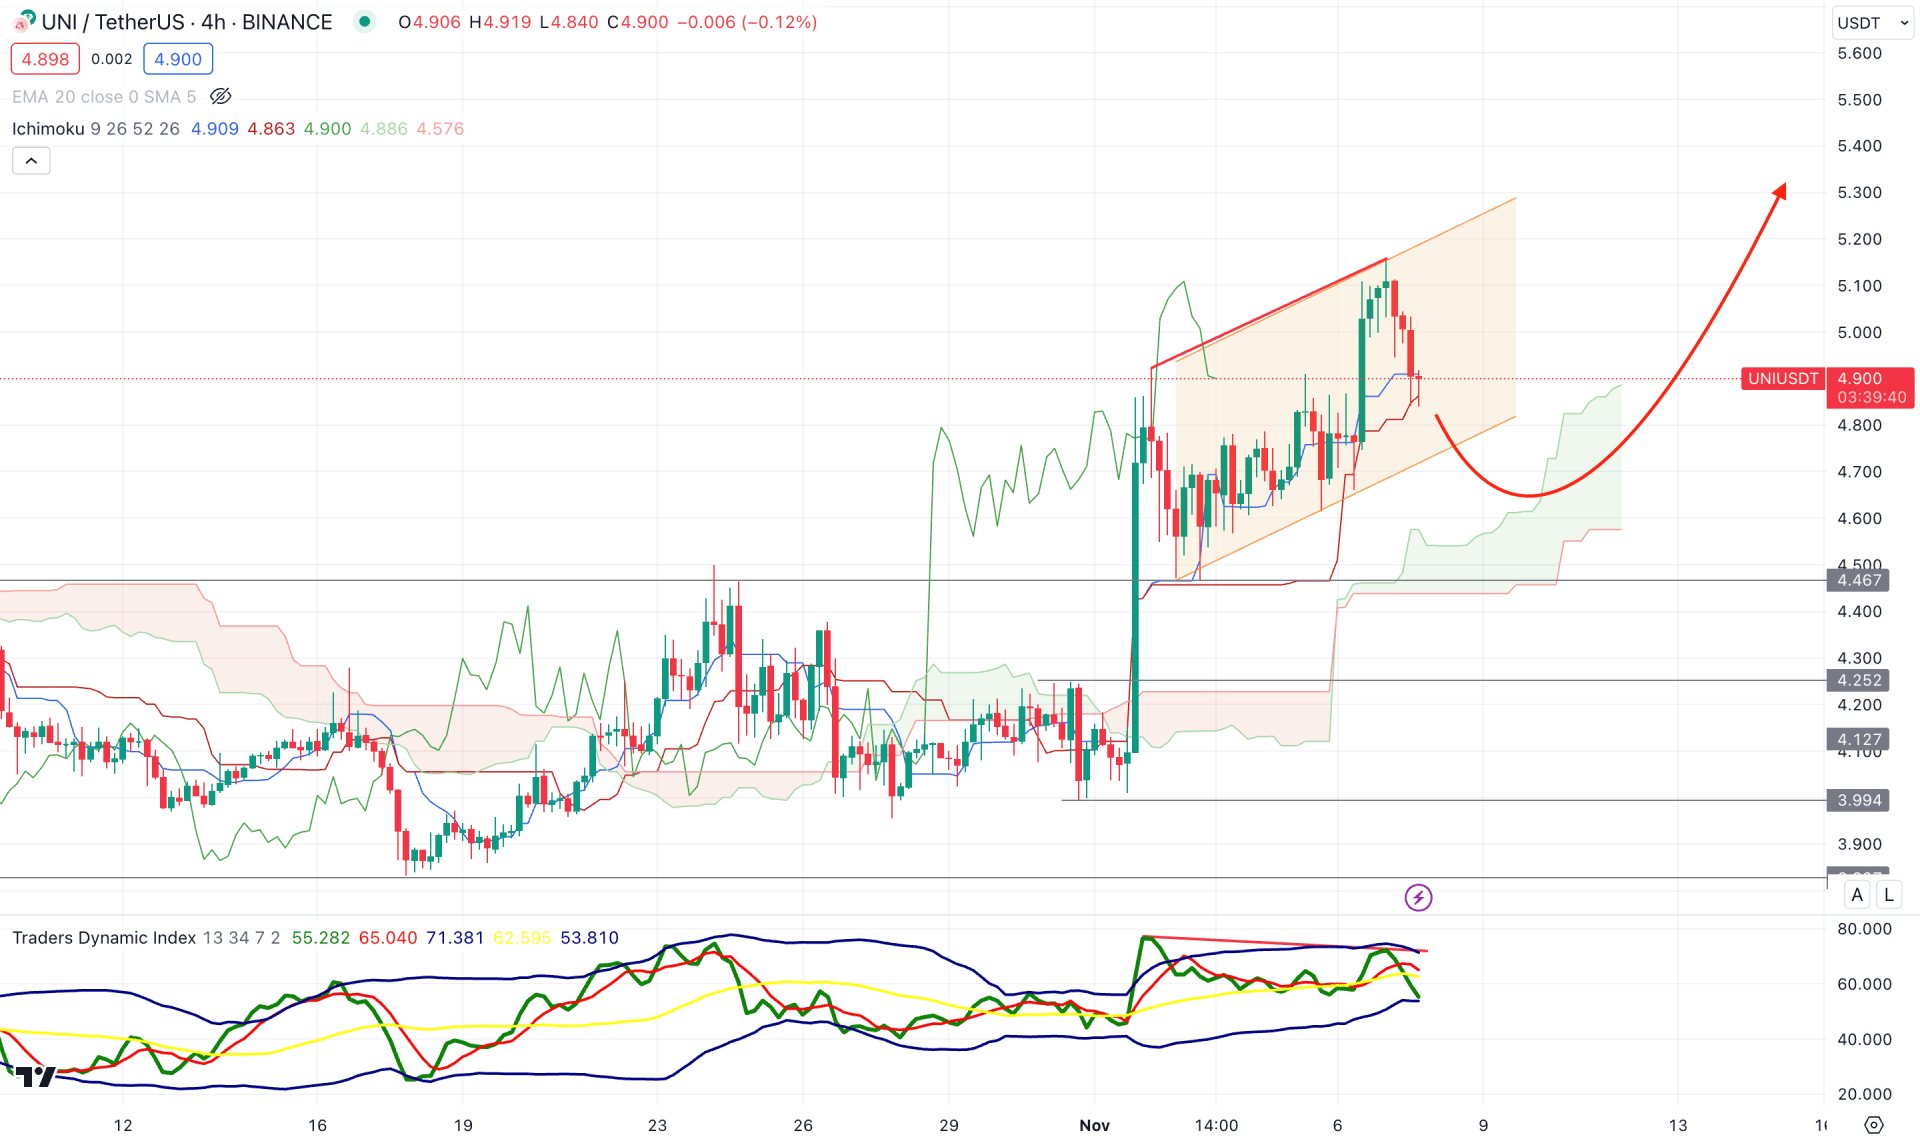
In the H4 time frame, the current buying pressure is present above the Ichimoku Kumo Cloud, while the future cloud is strongly bullish.
Although the price trades above the cloud support, a corrective price action with an ascending channel indicates less buying pressure in the market. Moreover, the strong bullish pressure from the 3.994 bottom came with an imbalance formation, which needs to fill up before extending the buying pressure.
In that case, a bearish channel breakout could find support at the 4.467 level, from where a bullish rejection might indicate a long opportunity. However, a bearish H4 candle below the 4.467 level could extend the bearish pressure towards the 4.252 to 3.994 area, from where a buying pressure might come.
On the other hand, valid bearish pressure below the 3.900 level might open a short opportunity, which could lower the price towards the 3.500 level.

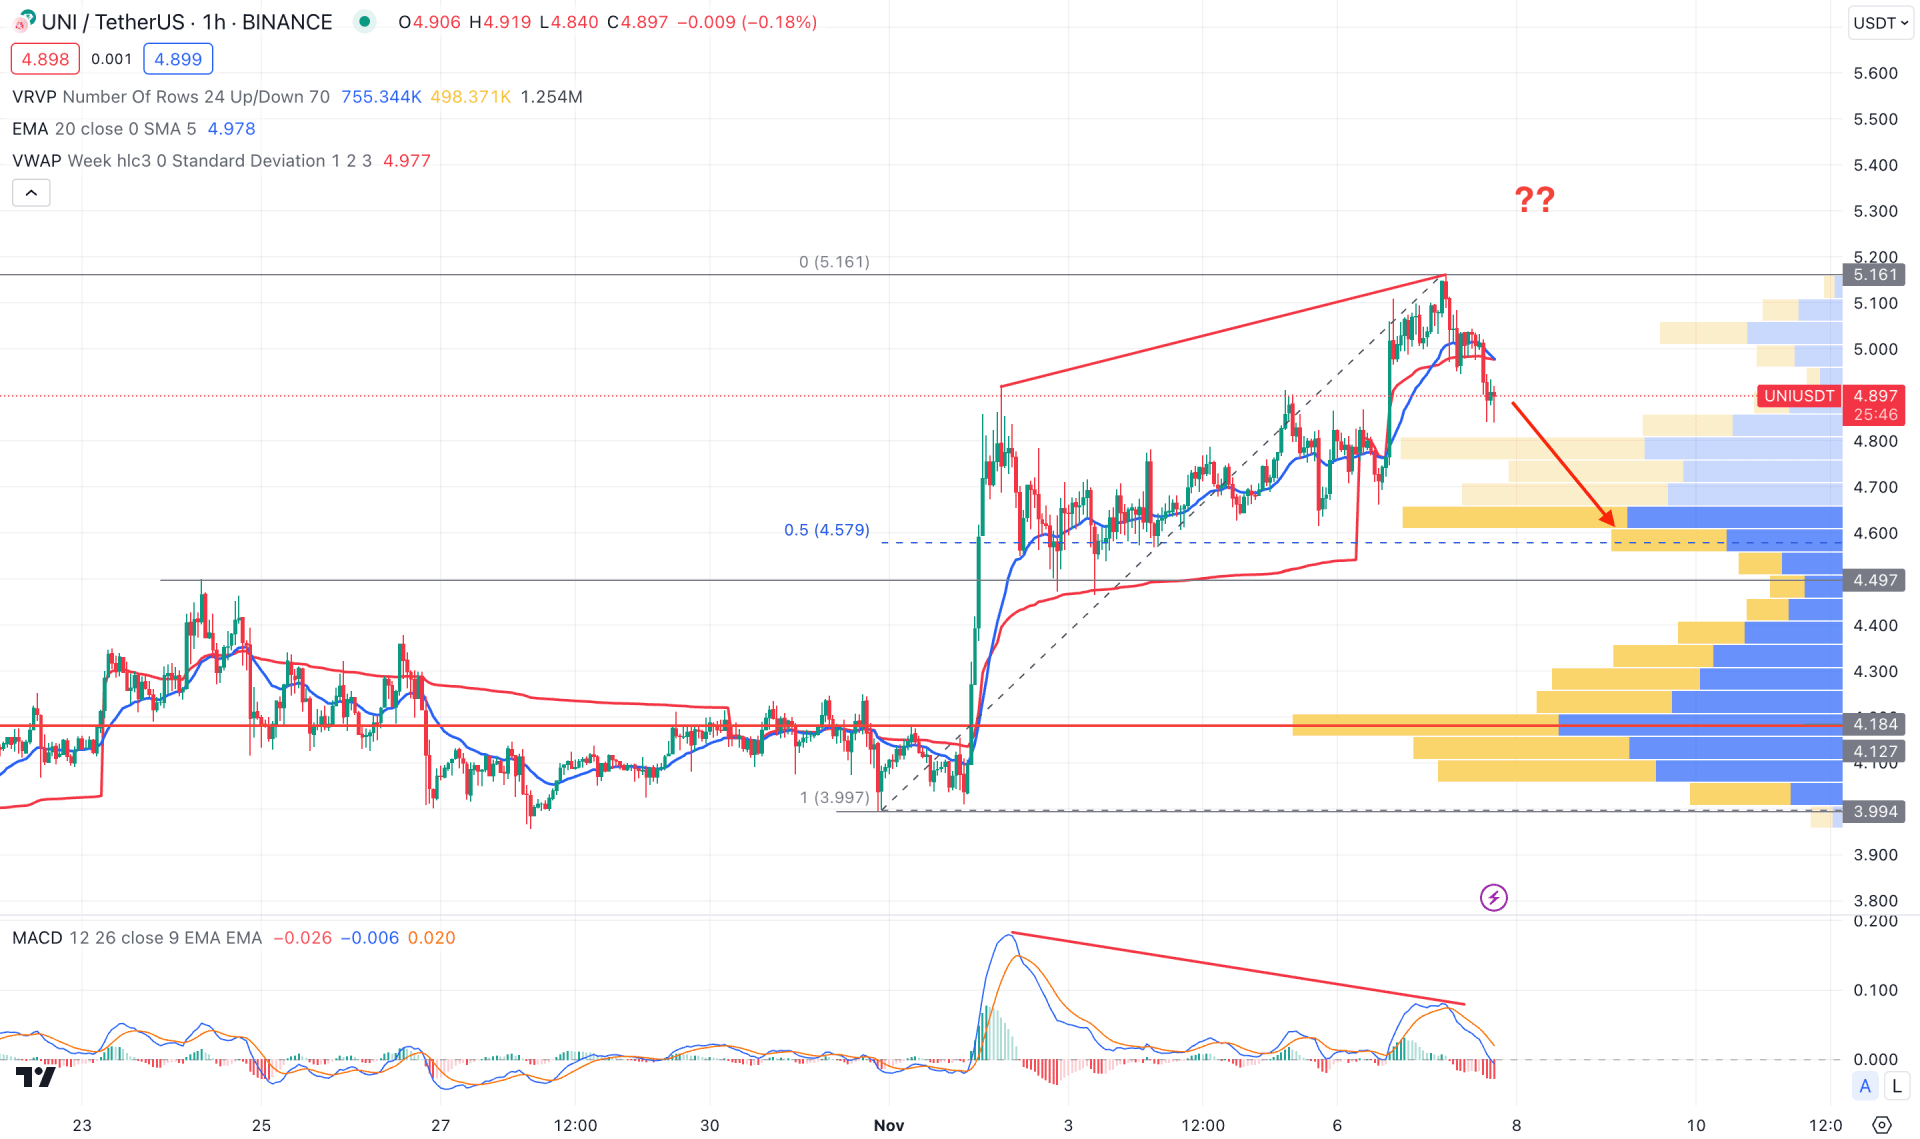
In the H1 chart, recent price trades at the premium zone from the 3.997 low to the 5.161 high, as the 50% Fibonacci Retracement level is at the 4.579 level.
Moreover, the gap between the price and the static 4.184 high volume level suggests a bearish correction as a mean reversion.
Based on the h1 structure, a bearish correction is pending as the recent price trades below the dynamic 20 EMA. However, a deeper correction below the 4.579 level with a valid bullish rejection could be a long opportunity for this pair, targeting the 6.000 psychological level.
Based on the current outlook, the upcoming coin listing event could be a bullish factor for UNIUSDT, offering a buying opportunity after a bearish correction. However, investors should monitor how the price trades at the channel support as a bearish break below this level could eliminate the buying possibility.